


5 Popular Momentum Indicators Used in Technical Analysis in 2026
FXOpen

Momentum indicators, often referred to as oscillators, are technical analysis tools used to measure the speed and strength of price movements in financial markets. Instead of focusing on the direction of a trend, these indicators analyse how quickly prices change, allowing traders to evaluate whether momentum is strengthening or weakening.
In this article, we examine five momentum indicators widely used in trading — Relative Strength Index (RSI), Moving Average Convergence Divergence (MACD), Average Directional Index (ADX), Commodity Channel Index (CCI) — and discuss how traders interpret their signals in market analysis.
Comparison of Popular Momentum Indicators
What Is a Momentum Indicator?
Momentum analysis in trading refers to the rate at which an asset's price accelerates or decelerates. Understanding momentum may assist traders in identifying potential trend continuations or reversals.
A momentum indicator is a technical analysis tool that measures how quickly and strongly an asset’s price is moving. Instead of showing the direction of the trend, it highlights the strength behind price movements. By comparing price changes over a set period, momentum trading indicators can help traders see if a market is gaining or losing strength. This information is often used to spot potential overbought or oversold conditions and to identify possible entry or exit points.
A stock momentum oscillator like the Relative Strength Index (RSI), for instance, may indicate that stocks are currently bought or sold too heavily and their price is due for a reversal.
Types of Momentum Indicator Signals
Momentum oscillators do not focus on the direction of the price movement, but rather on the strength behind it. They’re able to quantify and represent hidden clues about the future market direction. By learning to read momentum technical indicators, traders can develop trading strategies and identify conditions for new trades.
Momentum tools produce a range of signals that may help traders interpret market conditions. Let’s take a look at some of the most common momentum signals, including overbought/oversold conditions, divergences, and crossovers.
Overbought and Oversold Conditions
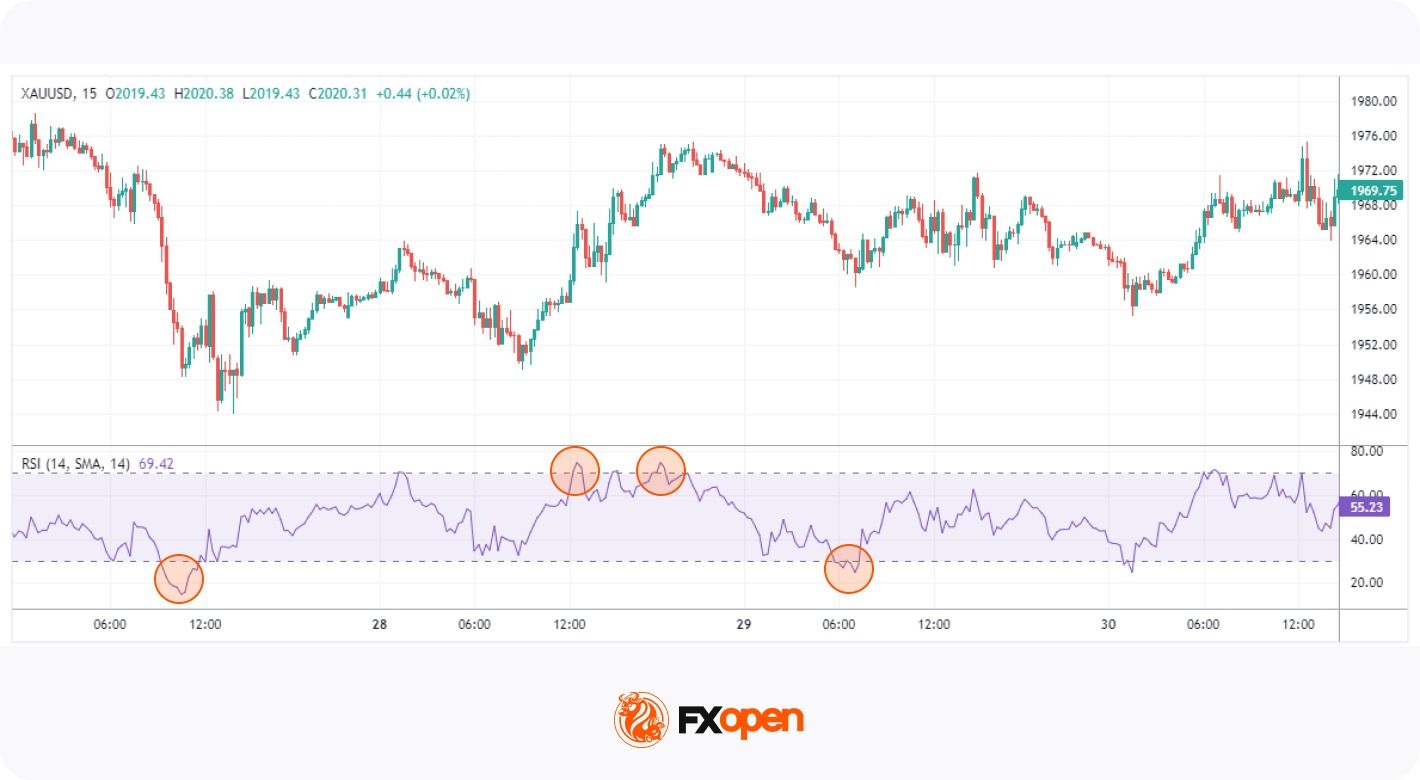
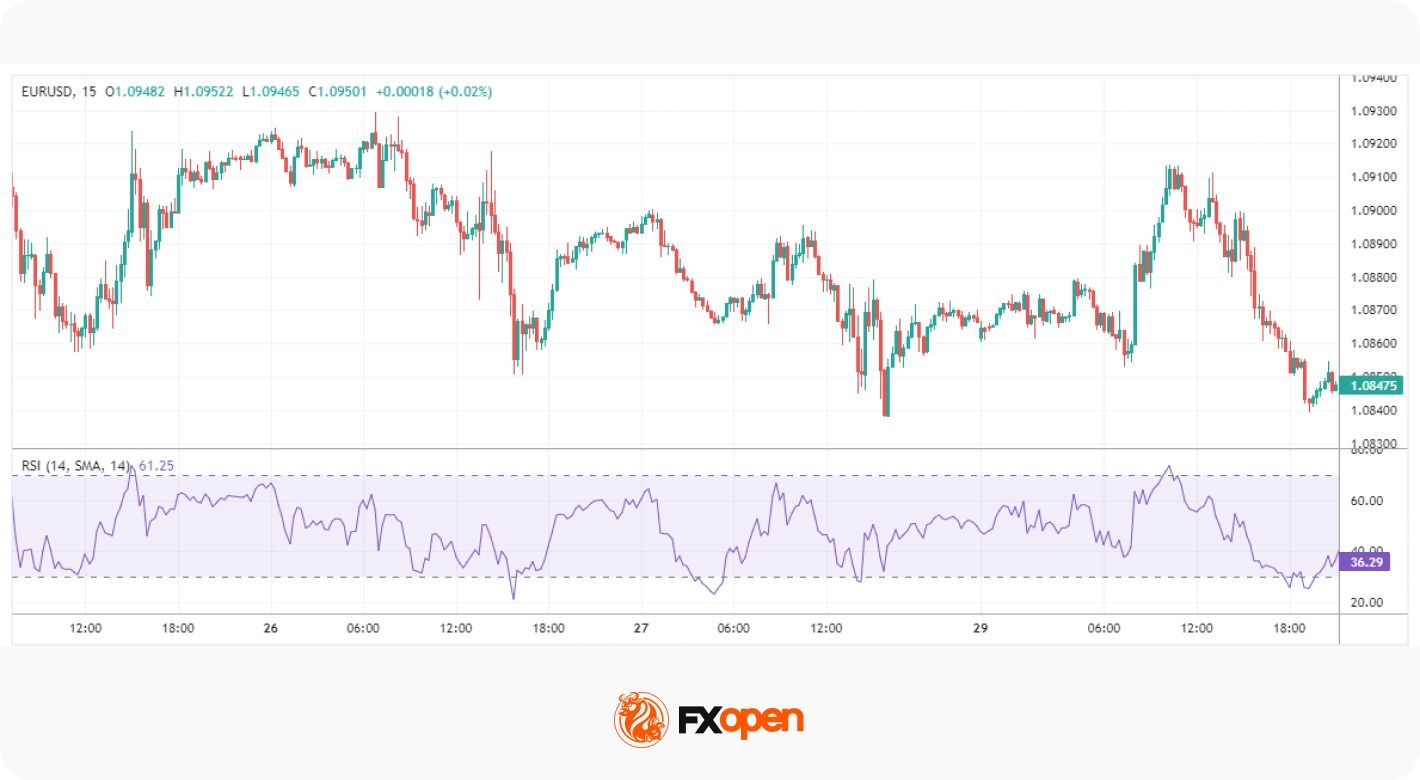
Overbought and oversold signals indicate when an asset's price has moved too far in one direction without sufficient support from fundamental or technical factors and is likely to reverse. For example, RSI generates overbought signals when the reading rises above 70 and signals oversold conditions when the reading falls below 30.
Divergence
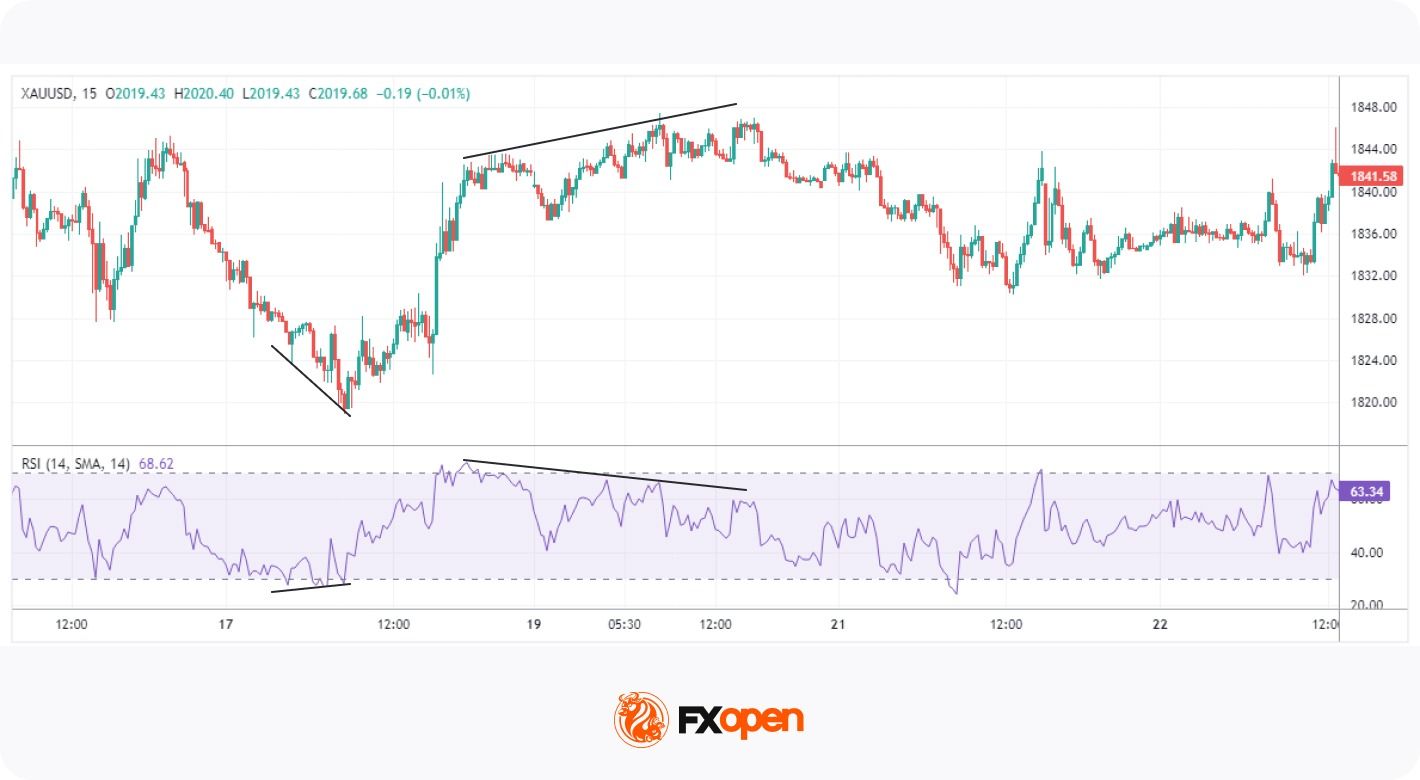
Divergence occurs when the price of an asset moves in the opposite direction of the indicator, suggesting an upcoming reversal. For instance, when the price is making higher highs, but RSI is making lower highs, this indicates a bearish divergence that increases the likelihood of a downward move.
Crossover
These signals are generated when the indicator's lines cross each other or a certain threshold. A common example is the MACD, where traders look for crossovers between the fast MACD line and the slower signal line to spot potential entry and exit points.
List of Five Momentum Indicators for Technical Analysis
Now that we understand the types of signals that momentum tools produce, let’s break down five of the most popular with a momentum indicators list. If you’d like to experiment with them yourself, you’ll find each tool in the TickTrader trading platform.
1. Relative Strength Index (RSI)
The RSI is one of the most popular and well-documented momentum trading indicators. It measures the speed and change of price movements by comparing the average gain to the average loss over a specified period, usually 14.
RSI is an oscillator, moving between 0 and 100. Values above 70 reflect overbought conditions, while values below 30 indicate oversold conditions. When the RSI moves out of overbought or oversold territory, many traders interpret this as a reversal confirmation. Sustained movements above or below the midpoint (50) can also be used to confirm a bullish or bearish trend, respectively. Moreover, traders look for divergence between the RSI and price to identify weakening trends and possible reversals.
2. Average Directional Index (ADX)
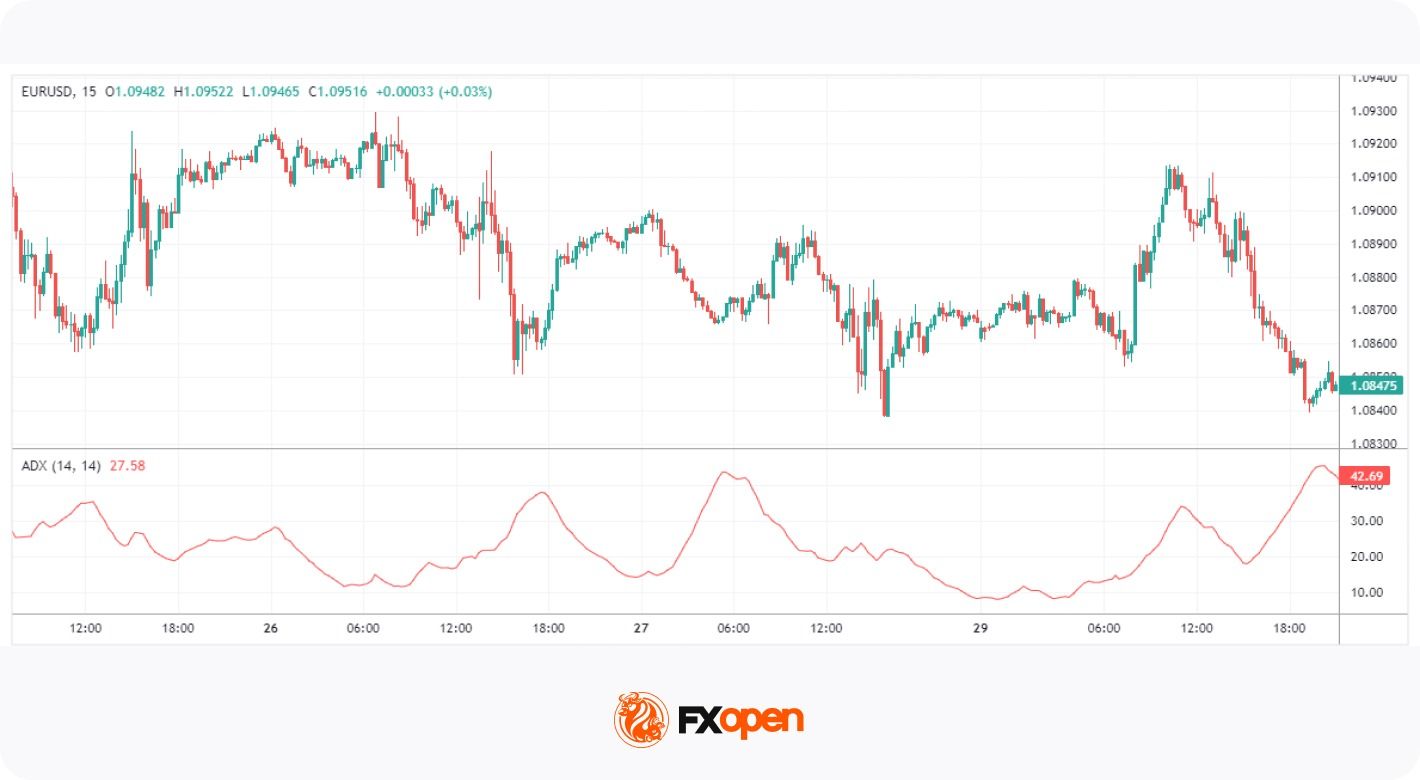
The ADX is a momentum oscillator used to determine a trend’s strength. Unlike most other tools, its reading doesn’t move according to the direction of price action, i.e. it doesn’t move up if bullish or down when bearish. Instead, it ranges from 0 to 100, with values above 25 indicating a strong trend and below 25 suggesting a weak or non-trending market.
ADX is commonly used in combination with other tools, as it simply confirms the trendiness of a market. For example, traders might use a leading indicator like RSI to anticipate bullishness and confirm the trend when ADX crosses over 25.
3. Commodity Channel Index (CCI)
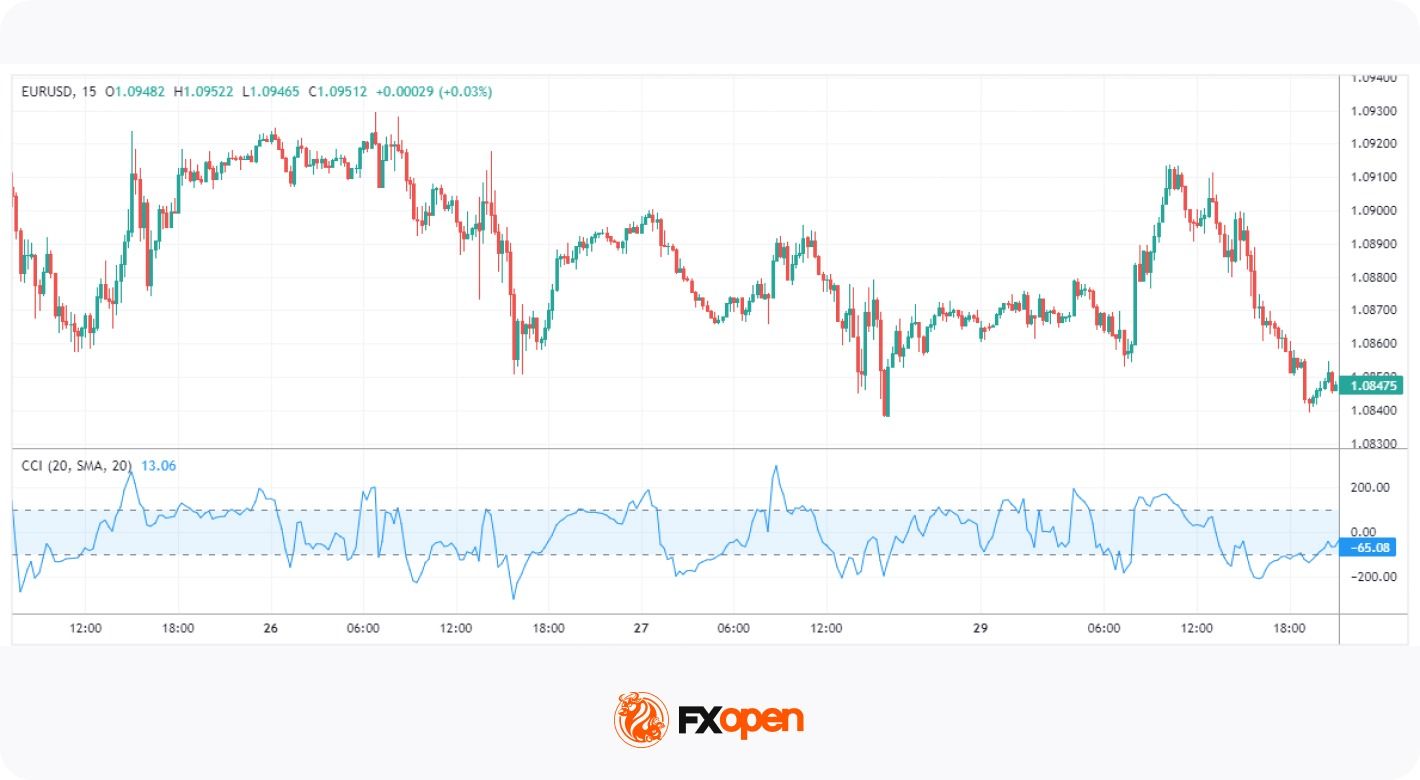
The CCI is a versatile technical momentum indicator. It uses a constant in its calculation to ensure that 75% of values fall between +/- 100, with moves outside of the range generally indicating a trend breakout or continuation. It can also show extreme overbought or oversold conditions when its value exceeds +/- 200.
The CCI requires a more nuanced approach than other tools and is typically used to confirm a trader’s directional bias. For instance, a visually identifiable bullish trend can be confirmed by looking at the CCI. If its value is skewed toward 100+, traders may gain additional confidence in their observation. When the market cools off, CCI will fall below 100. Traders can then confirm a pullback entry with a move back into the +/- 100 range.
4. Moving Average Convergence Divergence (MACD)
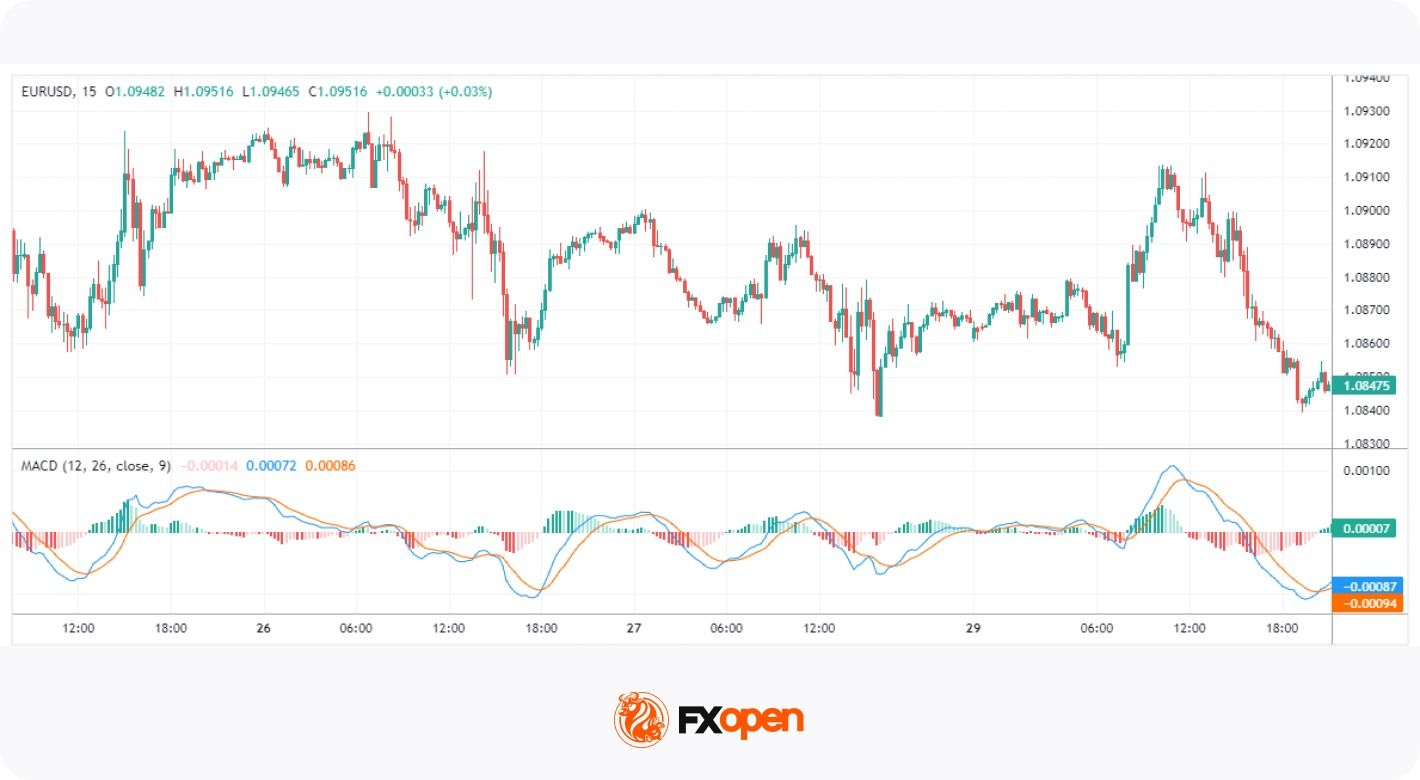
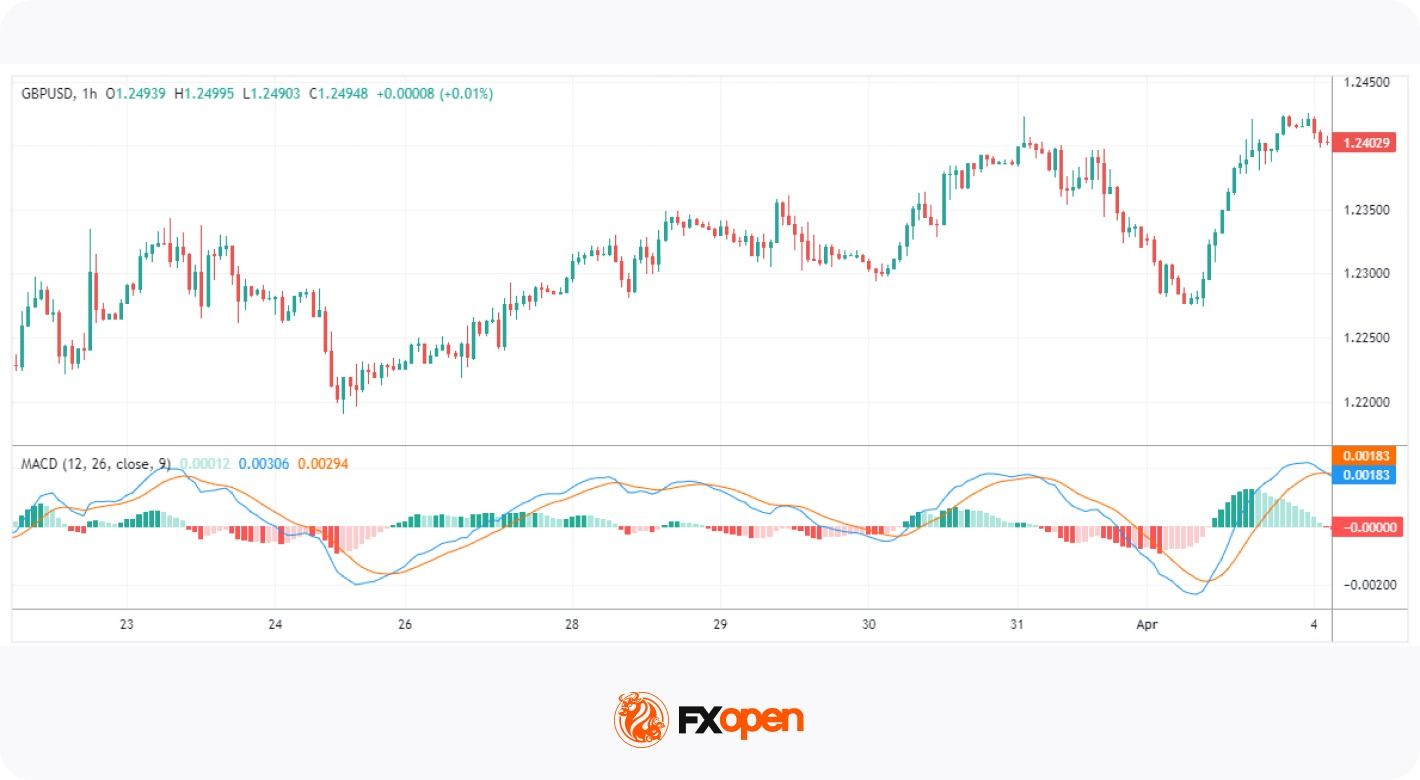
The MACD is a widely used trend-following technical momentum indicator that shows the relationship between two moving averages of an asset's price. The MACD reflects the trend’s strength, direction, and duration, as well as possible reversal points.
Traders use crossovers between the MACD and signal lines as potential entry and exit signals. Additionally, when the MACD histogram crosses above or below the zero line, it can indicate bullish or bearish momentum in the market. Lastly, it’s also possible to spot divergences between price and the indicator’s peaks and troughs, similar to how divergences are identified with RSI.
5. Momentum (Mom)
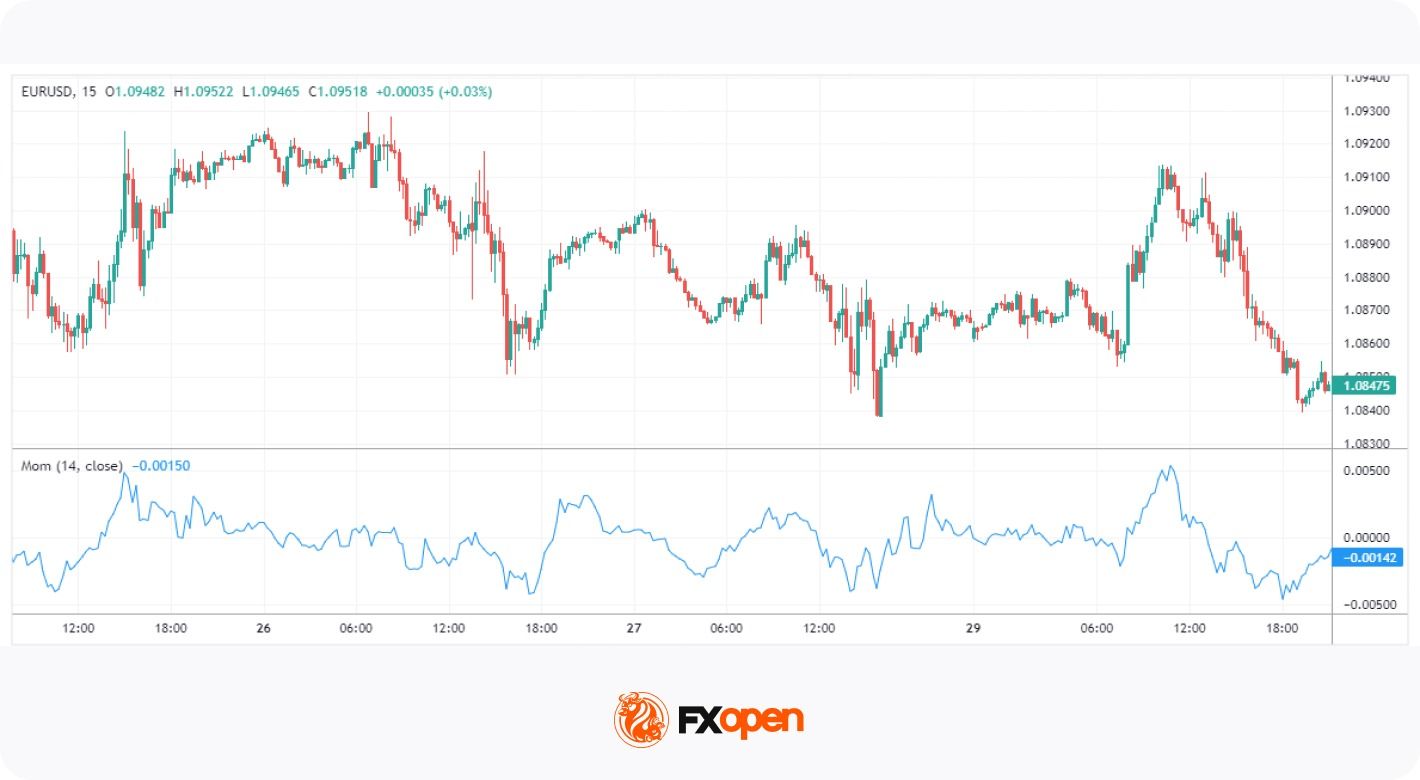
The Momentum indicator measures the rate of change in an asset's price over a specific period. The value of the Momentum depends on the market it’s applied to. For example, using the Momentum indicator in stocks will result in a fluctuating value typically between +/- 20, depending on the stock’s price. For forex pairs, its range may look more like +/- 0.02.
The common feature across all markets, however, is the zero line. Generally speaking, positive Momentum values indicate upward price movement, while negative values suggest downward movement. It can also show overbought and oversold conditions, but its lack of defined boundaries means this can be tricky. However, Momentum is especially useful for identifying divergences.
How Traders Use Momentum Indicators in Technical Analysis
Momentum technical indicators are often analysed alongside other technical tools rather than used in isolation. By evaluating changes in the speed and strength of price movements, traders may gain additional insight into whether a trend is strengthening or weakening.
Several common approaches include:
Trend confirmation. Indicators such as the Average Directional Index are frequently used to assess trend strength. When ADX rises above certain levels, traders may interpret this as confirmation that the market is trending.
Overbought and oversold analysis. Oscillators such as the Relative Strength Index may highlight conditions where prices have moved significantly relative to recent history, which can indicate that momentum is weakening.
Momentum shifts. Crossovers in the Moving Average Convergence Divergence may signal changes in market momentum and are sometimes interpreted as early indications of trend continuation or reversal. The Mom indicator may highlight shifts in market momentum through zero-line movements or divergences with price.
Breakout confirmation. Indicators such as the Commodity Channel Index are sometimes analysed during breakout conditions to evaluate whether price movements are supported by strong momentum.
Because each indicator measures market dynamics differently, many traders analyse several indicators together alongside price action, trendlines, or support and resistance levels to gain broader context when assessing market conditions.
Advantages of Momentum Oscillators
Momentum indicators are valuable tools in technical analysis, reflecting the strength and speed of price movements. They offer several advantages that may improve trading strategies:
- Identify Trends Early: Technical momentum indicators can reveal potential shifts in trend direction, providing traders with additional context for evaluating entry and exit points.
- Objective Analysis: They provide quantifiable data, reducing reliance on subjective analysis and emotional decision-making.
- Spot Overbought and Oversold Conditions: Momentum tools show when an asset is overbought or oversold, signalling potential reversals and exit points.
- Confirm Trade Signals: Combining momentum indicators with other technical tools may improve trade signals, providing stronger confirmation for trading decisions.
- Adaptable Across Markets: They can be applied to various assets, including stocks, forex, and commodities, making them versatile tools for traders.
Things to Consider When Trading Momentum Indicators
While momentum indicators may be a useful addition to a trader’s analytical toolkit, there are a few things to be aware of:
- Trade with the Trend: Trends often last longer than you may think, and constantly looking for trend reversals will only end in frustration. Look for bullish signals during an uptrend and bearish signals in a downtrend.
- Use Multiple Indicators: Relying on a single tool can lead to false signals. Many traders combine a lagging indicator, like MACD, with a leading indicator, like RSI. Combining two or three tools may help confirm signals and improve trade accuracy.
- Beware of False Signals: Momentum indicators can sometimes generate false signals, especially in sideways or choppy markets. Being patient and waiting for confirmation before entering a trade is vital.
- Don’t Rely Too Heavily on Indicators: While momentum indicators may be helpful, relying solely on them without considering price action, market structure, or fundamental aspects can lead to poor trading decisions. Use these indicators alongside other tools for a momentum indicator strategy.
Final Thoughts
Momentum indicators play an important role in technical analysis by allowing traders to assess the strength and speed of price movements. Tools such as RSI, MACD, CCI, ADX, and the Momentum indicator are widely used to analyse market momentum and identify signals such as divergences, crossovers, or overbought and oversold conditions.
Since each indicator captures different aspects of market behaviour, many traders analyse several indicators together alongside price action and broader market context.
If you want to test your strategy with the above-mentioned indicators, you may consider opening an FXOpen account, where you can trade over 700 instruments with tight spreads from 0.0 pips* and low commissions from $1.50* (*additional fees may apply). Good luck!
FAQ
What Are Momentum Indicators Used for in Trading?
Momentum indicators are used in technical analysis to evaluate the speed and strength of price movements in financial markets. By analysing how quickly prices change, these indicators may signal whether market momentum is strengthening, weakening, or potentially shifting.
Traders often analyse momentum indicators to identify conditions such as overbought or oversold levels, divergences between price and indicators, and crossover signals that may suggest changes in market dynamics.
What Period Is Commonly Used for the Momentum Indicator?
Short-term traders often analyse periods such as 7 or 10, while longer-term analysis may use 14 or 21 periods. The chosen period often depends on the trader’s time horizon and the volatility of the analysed asset.
What Is the Most Popular Momentum Indicator for Scalping?
There is no single most popular momentum indicator for scalping but the Relative Strength Index (RSI) is often favoured by scalpers due to its ability to quickly identify overbought or oversold conditions. Its responsiveness is used by scalpers to make rapid decisions in fast-moving markets.
What Is the Difference Between Momentum and Trend Indicators?
Momentum trading indicators measure the speed of price changes, while trend indicators assess the direction and persistence of price movements. To put it simply, momentum focuses on strength, while trend indicators focus on the overall direction.
Is MACD a Momentum Indicator?
Yes, the Moving Average Convergence Divergence (MACD) is one of the most popular momentum indicators, especially in forex and stock trading. It may reveal changes in momentum and help identify potential trend reversals.
Are Momentum Indicators Leading or Lagging?
Momentum indicators are generally considered leading indicators because they analyse the speed of price movements and may signal potential shifts in momentum before a trend changes. However, some indicators such as MACD also incorporate moving averages, which introduces a lagging element.
This article represents the opinion of the Companies operating under the FXOpen brand only. It is not to be construed as an offer, solicitation, or recommendation with respect to products and services provided by the Companies operating under the FXOpen brand, nor is it to be considered financial advice.
Stay ahead of the market!
Subscribe now to our mailing list and receive the latest market news and insights delivered directly to your inbox.


Latest articles

GBP/USD and EUR/GBP Await Key Bank of England Decision
The pound strengthened following the outcome of the US Federal Reserve meeting, where the central bank, as expected, kept interest rates unchanged. However, the Fed did not provide the market with clear signals of an imminent shift towards rate cuts,

Microsoft Analysis: Earnings Beat Expectations
On 29 July 2026, Microsoft reported its results for the fourth quarter of fiscal year 2026. Revenue reached $90 billion, up 18% year-on-year, while adjusted earnings per share came in at $4.74, comfortably ahead of analysts' expectations of $4.

EUR/USD: All Eyes on the Fed as the Range Reaches Its Breaking Point
The dollar's next move hinges on tonight's Fed decision, and this time markets genuinely don't know what to expect. While economists still lean toward a hold—with CME FedWatch odds sitting near 68.5% for no change—Kevin Warsh's hawkish