


How Do Traders Spot and Use the Dragonfly Doji Candlestick Pattern?
FXOpen
The dragonfly doji candlestick pattern holds intrigue and fascination for traders in financial markets. Its distinct shape and positioning on price charts make it a keen subject for observation and analysis. In this article, we will explore this setup, its significance, and how traders use it in their trading strategies.
What Does a Dragonfly Doji Mean?
The red or green dragonfly doji is a candlestick pattern that forms when the opening, closing, and high prices of an asset are equal or almost equal. This formation resembles the shape of a dragonfly because it has an extended lower shadow. It provides bullish signals and is considered a neutral pattern as it provides continuation and reversal signals, depending on its context within a trend. The meaning of a dragonfly doji is that there is uncertainty in the market, and traders are prompted to carefully analyse other factors before making trading decisions.

Traders may find the dragonfly doji pattern on charts of different financial instruments, such as currencies, stocks, cryptocurrencies*, ETFs, and indices, regardless of the timeframe. Test this pattern on various assets with FXOpen’s TickTrader platform.
The Psychology Behind the Dragonfly Doji
The dragonfly doji candle pattern reflects a tug-of-war between buyers and sellers, where neither side gains a decisive advantage. Its formation indicates that sellers initially push prices lower, but buyers step in to push prices back up to the opening level. This results in the distinct long lower shadow and minimal upper shadow.
The psychological meaning of the dragonfly candlestick pattern is significant; it shows that despite bearish pressure, buyers are strong enough to regain control by the close. It signals indecision, highlighting the need for traders to carefully evaluate other indicators and the broader trend before making trading decisions.
How Can You Trade the Dragonfly Doji?
The bullish dragonfly doji provides valuable information about market sentiment. Here are two scenarios where this formation can be significant:
The Dragonfly Doji in an Uptrend
In a bullish trend, the dragonfly doji is generally seen as a continuation signal. This is because, despite sellers attempting to push the price lower, buyers remain active and prevent a significant decline. However, it is worth noting that the inability of buyers to push the price above its open level may indicate a potential weakening of bullish momentum. Traders may consider entering the trade above the open/close of the doji’s candle or if the proceeding bar closes above the doji’s open/close. The stop-loss level may be placed below the candlesticks, while the take-profit target may be set at the nearest resistance level.
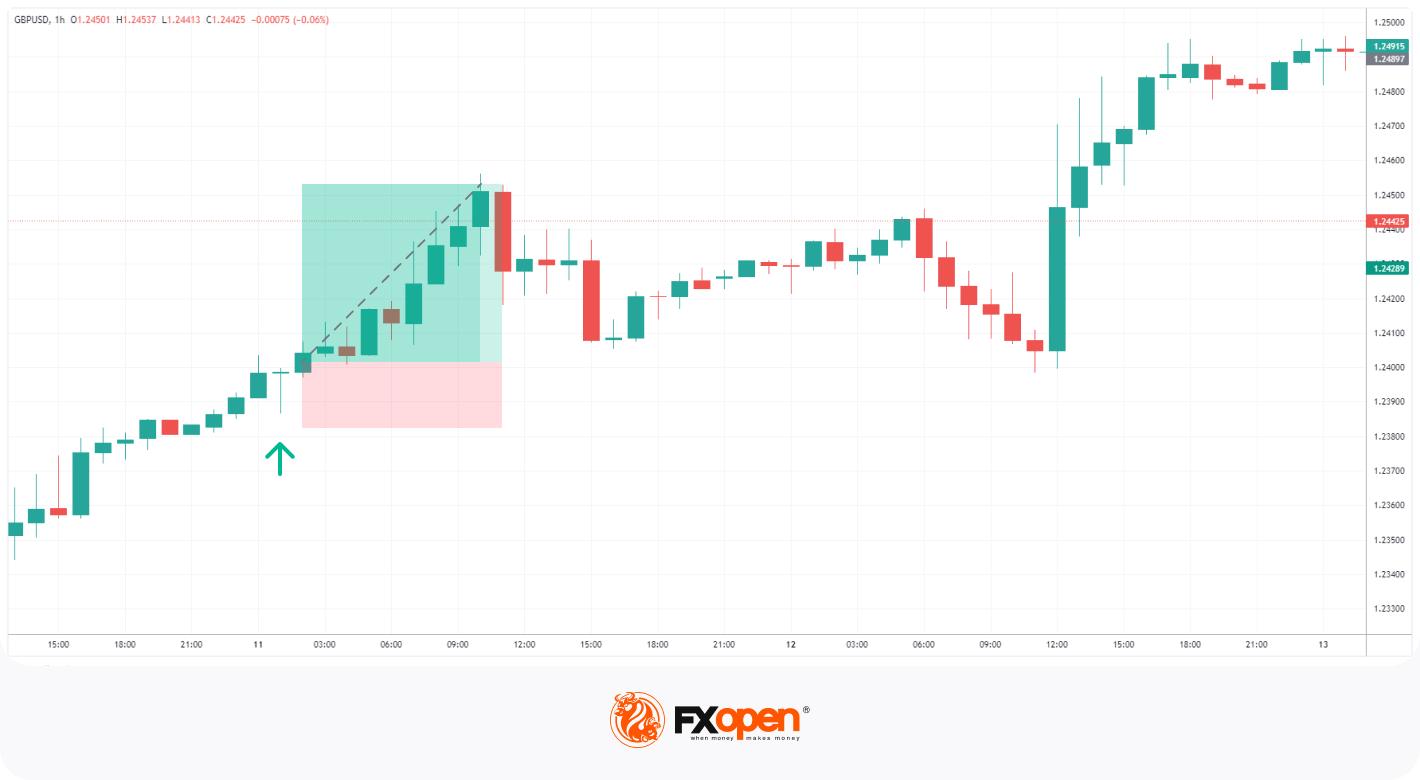
In the chart above, the pattern formed in an uptrend, and the trader placed a long trade on the next bar. The stop loss was set below the candle, with the take profit at the closest resistance level.
Dragonfly Doji in a Downtrend
The dragonfly doji in bearish trends may suggest a possible upward reversal. The long lower shadow indicates that buyers entered the market, pushing the price up from its lows. This could be seen as a signal to consider going long or watching for a further bullish confirmation before taking action. Traders may place a stop loss below the candle with a take profit at the closest resistance level or may consider the appropriate risk/reward ratio.
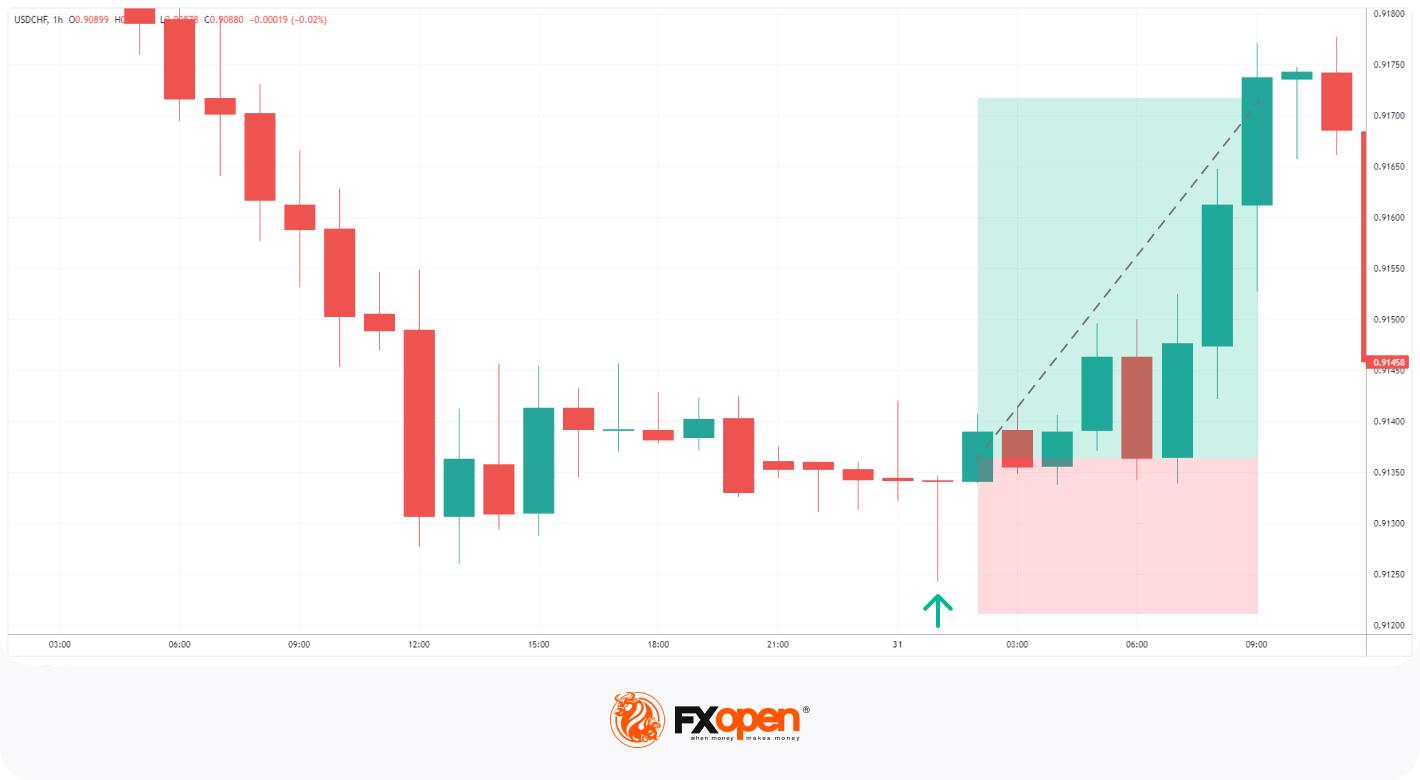
The candle at the end of a downtrend signals a price reversal. The trader placed a buy order at the high of the doji with a stop-loss level below it. The take profit is calculated based on the risk/reward ratio.
Traders can enhance their trading strategies by utilising the free TickTrader trading platform.
How Can You Confirm the Dragonfly Doji?
Confirming the dragonfly doji may increase the reliability of trading decisions. Here are key factors to consider:
- Volume Analysis: High trading volume during the formation of a dragonfly candle may indicate stronger market sentiment and increase the likelihood of a significant move.
- Subsequent Candlesticks: Traders look for a bullish candlestick following the dragonfly candlestick. This reinforces the potential for a trend reversal or continuation.
- Support and Resistance Levels: A formation occurring near significant support levels can strengthen its validity as a potential reversal signal.
- Technical Indicators: To gauge momentum and confirm signals, traders often complement the analysis with indicators like the Relative Strength Index (RSI), moving averages, and Bollinger Bands.
- Market Context: It’s best to evaluate the broader market trend and news that may impact market sentiment to provide a clearer picture of its implications.
Dragonfly and Other Patterns
Dragonfly doji, gravestone doji, spinning top, and long-legged doji are all types of candlestick patterns commonly used in technical analysis to indicate potential reversals or indecision in the market. Traders often pay close attention to them when making trading decisions.
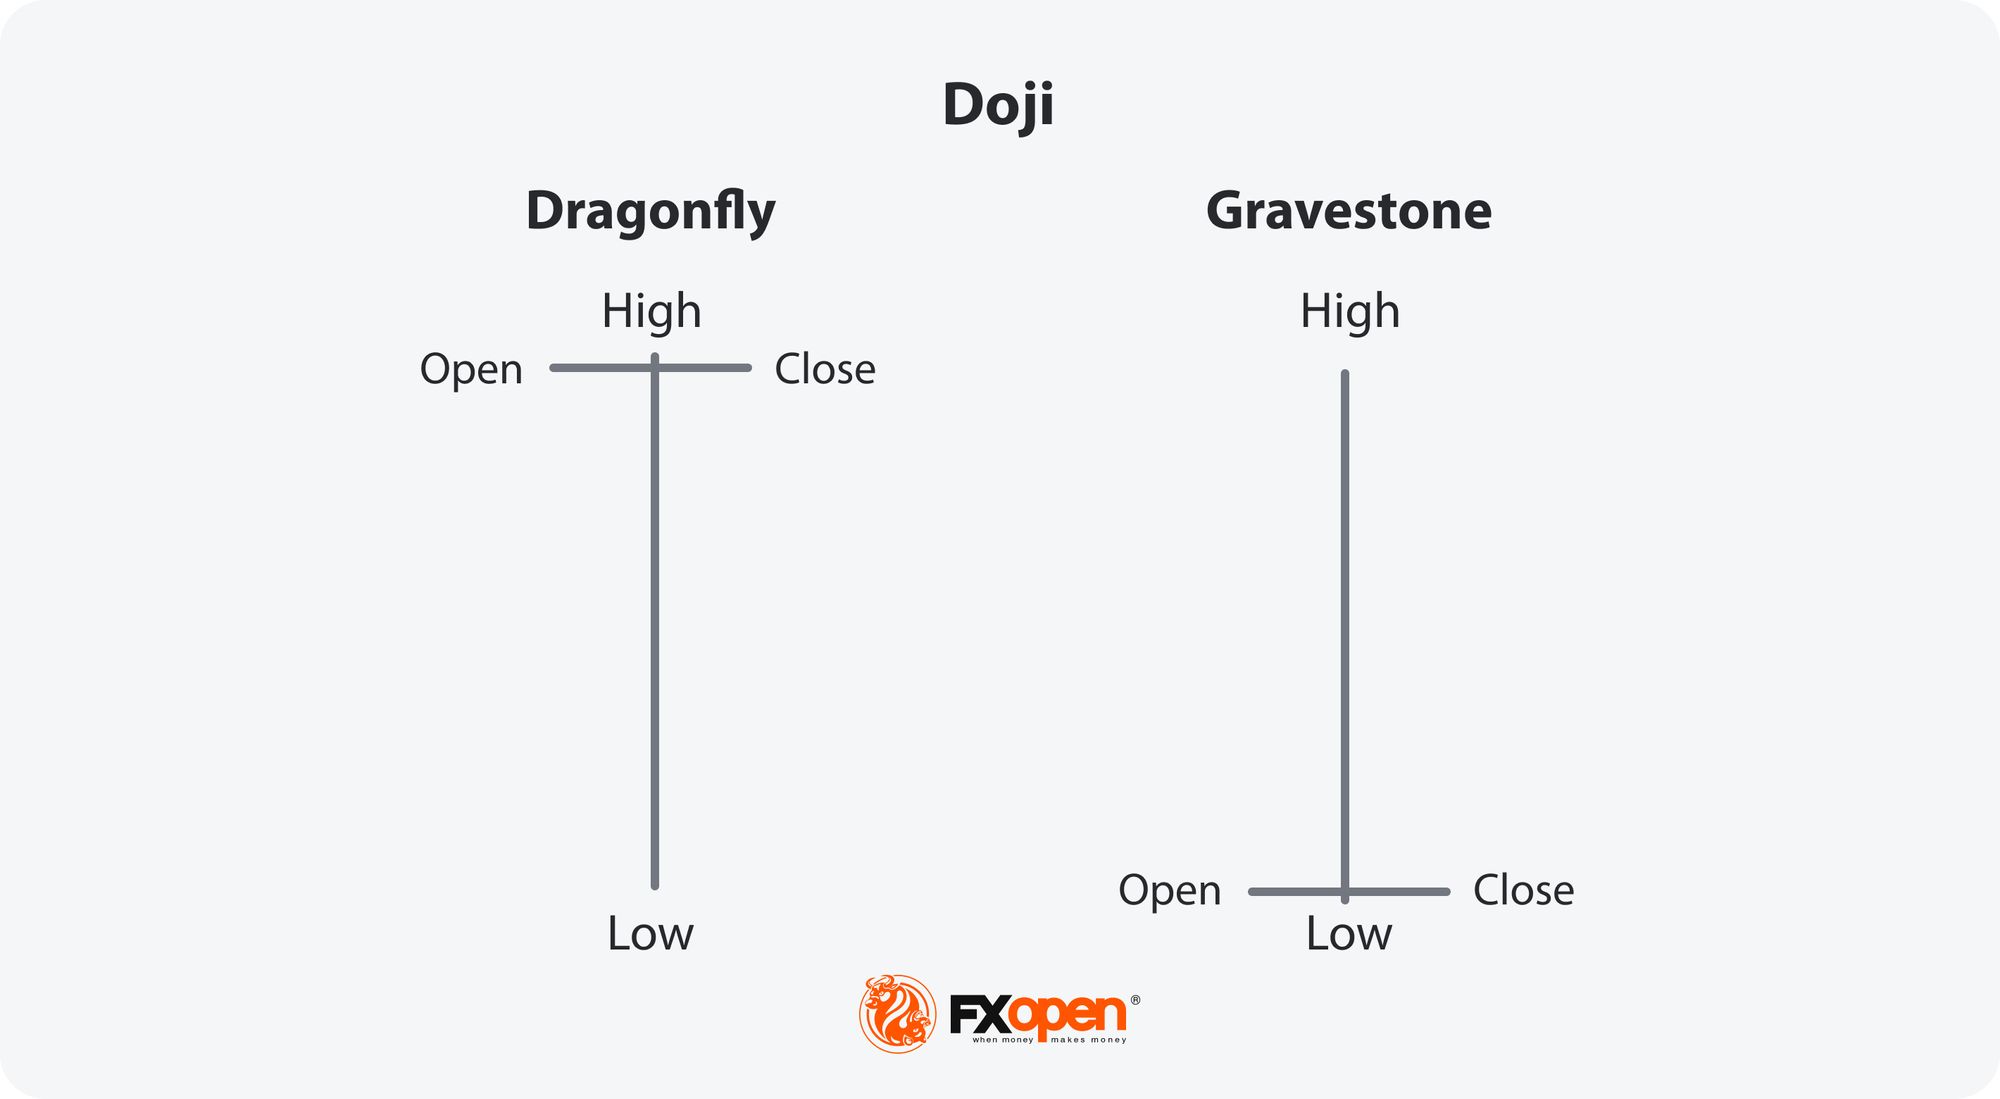
Dragonfly Doji vs Gravestone Doji
While the dragonfly doji has a long lower shadow and little or non-existent upper one, the gravestone or inverted dragonfly doji has a long upper wick and little or non-existent lower one. Both patterns indicate indecision, but the dragonfly provides bullish signals, whereas the gravestone indicates potential bearish reversals.
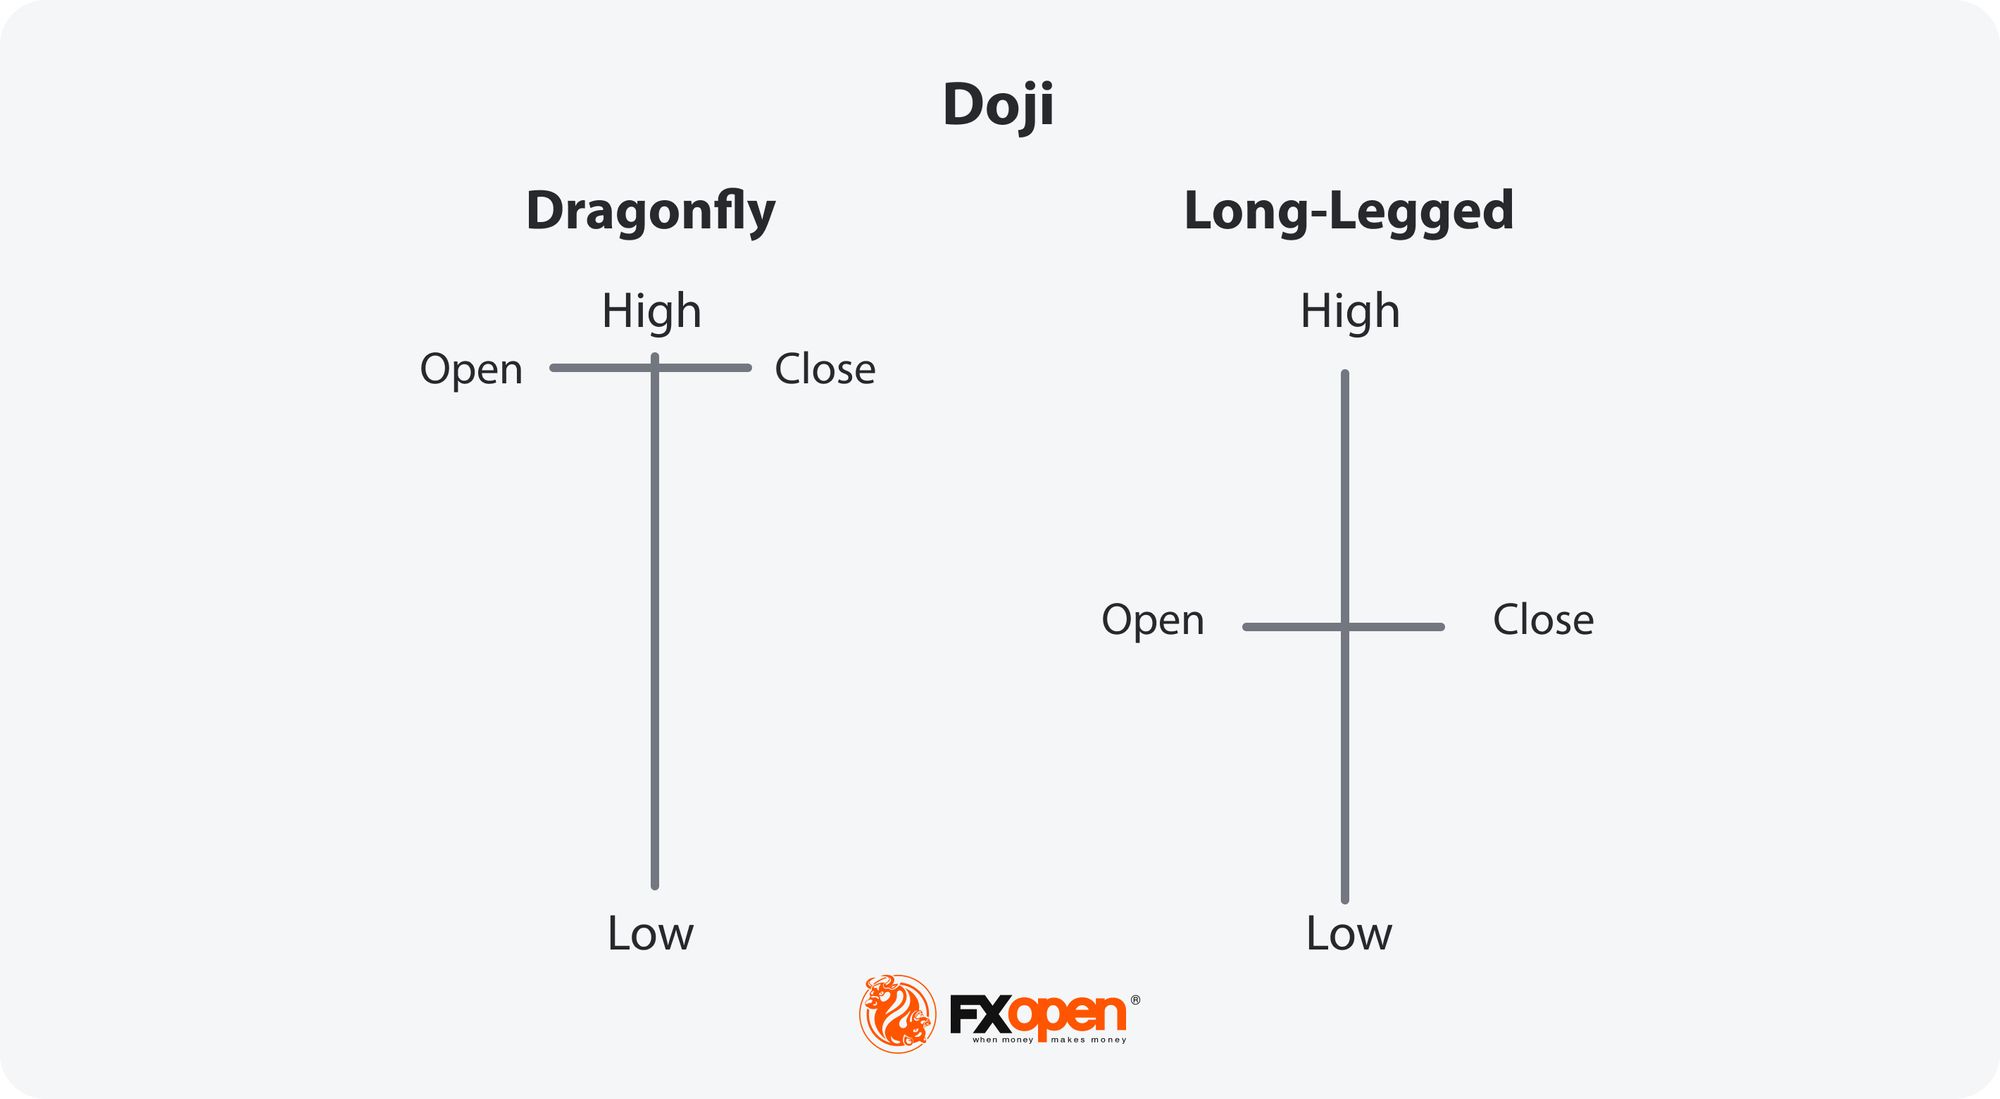
Dragonfly Doji vs Long-Legged Doji
The dragonfly has a long lower shadow with little to no upper shadow, indicating a potential bullish reversal. In contrast, the long-legged version has long upper and lower shadows, reflecting significant indecision and equal pressure from buyers and sellers without a clear directional bias.
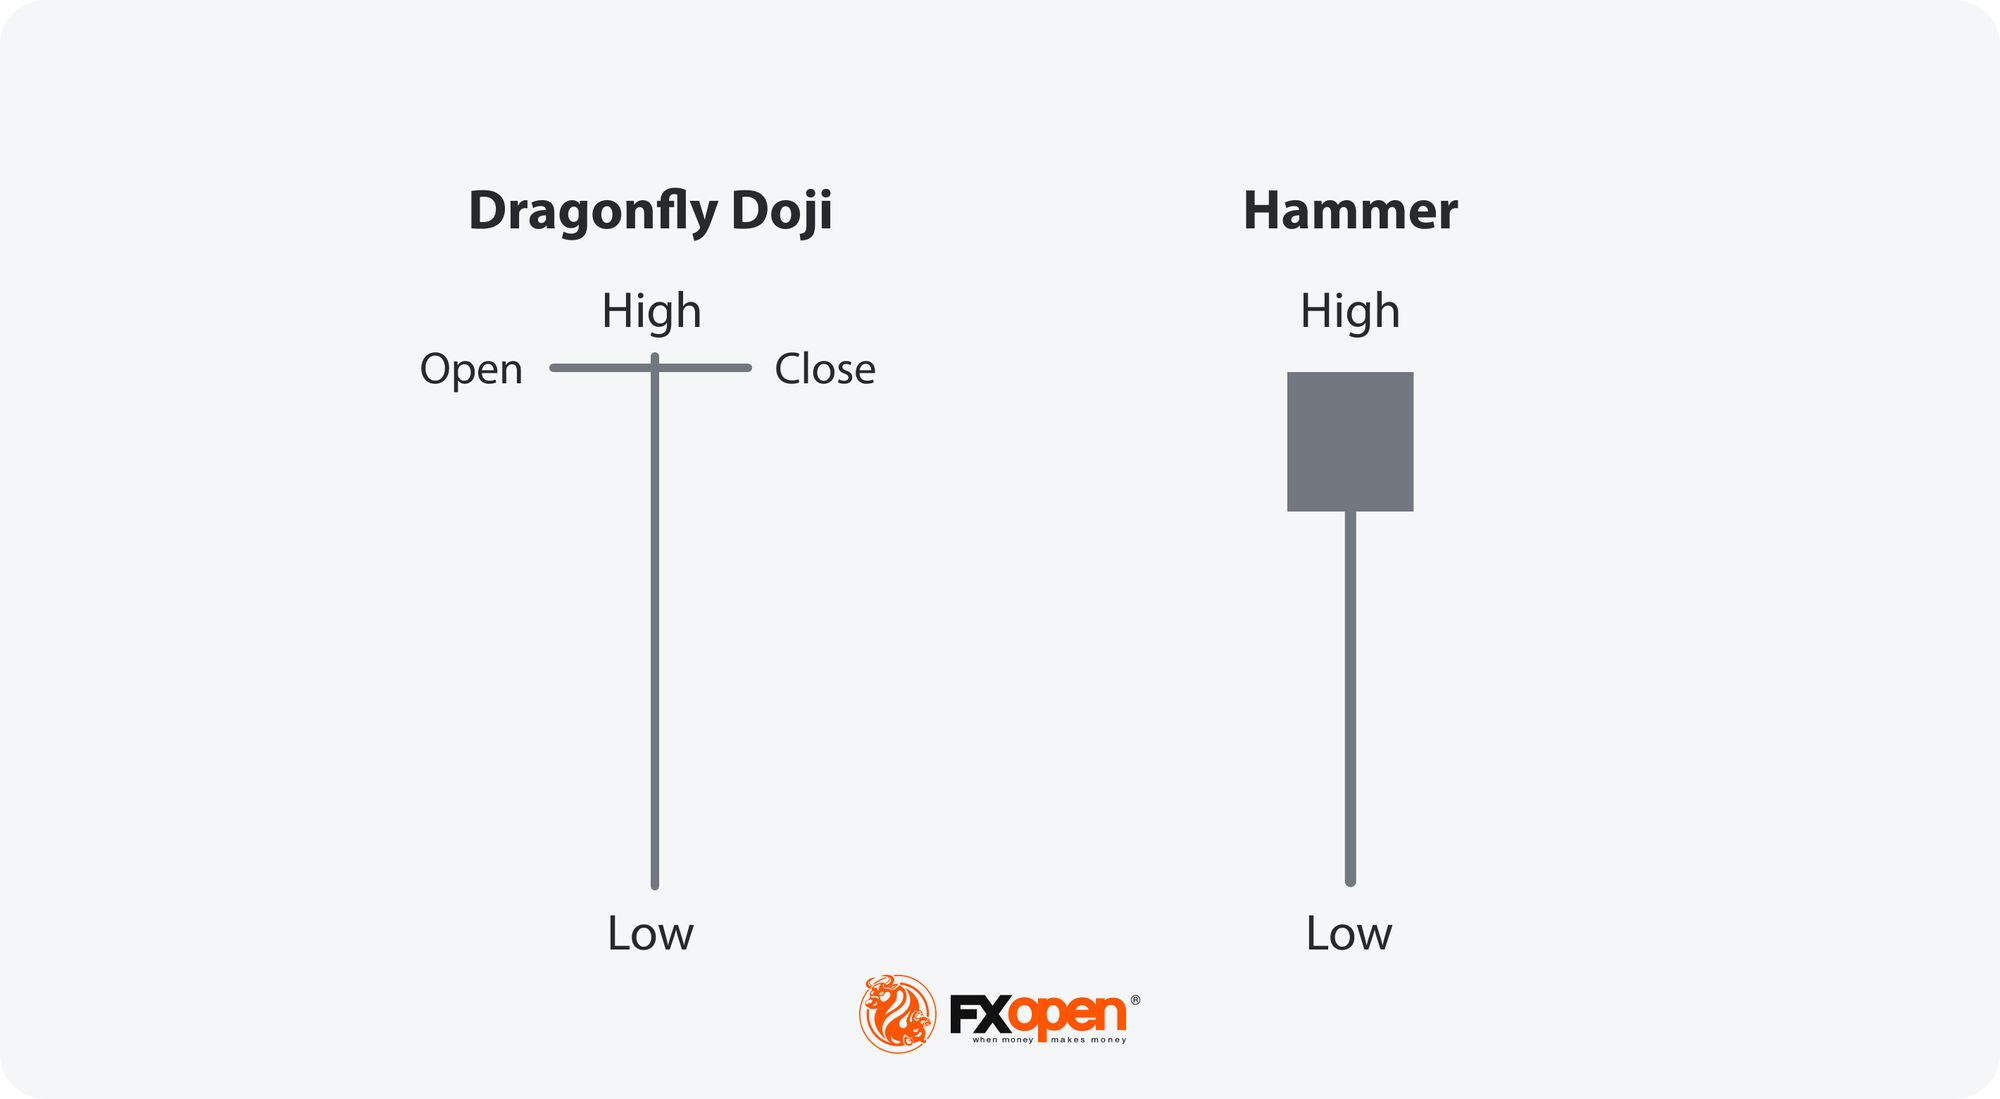
Dragonfly Doji vs Hammer
The dragonfly and the hammer both signal potential bullish reversals, but they differ in appearance and context. The dragonfly has no upper shadow, but it has a very small body and an extended lower shadow, while the hammer has a body at the top of the candlestick and a long lower shadow. The hammer typically appears after a downtrend, signalling a reversal, while the dragonfly doji appears in uptrends and downtrends.
Limitations of the Dragonfly Doji
While the dragonfly doji is a valuable candlestick formation for traders, it is not without its limitations. Recognising these constraints can help them understand how to use it most effectively.
- False Signals: The dragonfly sometimes produces false signals, leading traders to anticipate reversals that do not materialise.
- Market Context: Its effectiveness is heavily influenced by the broader market context. It may not be reliable in all situations, particularly in choppy or sideways assets.
- Confirmation Needed: Additional indicators or subsequent price action are usually required to confirm the pattern, as relying solely on its appearance can be risky.
- Limited Power: It does not provide information on the magnitude of the subsequent price movement, making it challenging to set precise profit targets.
Closing Thoughts
Candlestick patterns should not be relied upon as the sole factor in trading decisions. It is essential to perform a comprehensive analysis and implement robust risk management strategies before making any trades. Once you are confident in your analysis, consider opening an FXOpen account to take advantage of spreads as tight as 0.0 pips and commissions starting at just $1.50.
FAQ
What Does Doji Candle Mean?
A doji candle represents a session where the opening and closing prices are almost equal, indicating market indecision. It suggests neither buyers nor sellers are in control, resulting in a standoff. Doji candles can take various forms, including dragonfly, gravestone, and long-legged, each with unique implications.
What Does a Dragonfly Doji Indicate?
A dragonfly doji indicates indecision and potential trend reversal. It forms when the open, high, and close prices are near the same level but it has a long lower shadow. This formation suggests buyers counteracted initial selling pressure, signalling a possible bullish shift.
Is the Dragonfly Doji Bullish or Bearish?
The dragonfly is generally considered bullish, especially after a downtrend. Its formation indicates buyers pushed prices back to the opening level, potentially leading to a price increase.
What Is the Opposite of the Dragonfly Doji?
The opposite of the dragonfly doji is the gravestone doji. The dragonfly has a long lower shadow and little to no upper shadow, while the gravestone features a long upper shadow and minimal lower shadow, indicating a potential bearish reversal.
*At FXOpen UK and FXOpen AU, Cryptocurrency CFDs are only available for trading by those clients categorised as Professional clients under FCA Rules and Professional clients under ASIC Rules, respectively. They are not available for trading by Retail clients.
This article represents the opinion of the Companies operating under the FXOpen brand only. It is not to be construed as an offer, solicitation, or recommendation with respect to products and services provided by the Companies operating under the FXOpen brand, nor is it to be considered financial advice.
Stay ahead of the market!
Subscribe now to our mailing list and receive the latest market news and insights delivered directly to your inbox.


Latest articles

US Dollar Index: A Defining Week for the King of the Markets
The dollar heads into a pivotal week trading near 101.80, just off a 15-month high, with the Fed's July 29 meeting standing as the clear focal point. Markets currently price roughly a 65% chance of a hold, though renewed

NZD/USD: Inflation Surge Meets Strong US Dollar Pressure
On 21 July, Stats NZ reported an acceleration in inflation: the Consumer Price Index rose 1.5% in the second quarter, while the annual inflation rate climbed to 4.1%, its highest level in more than two years and slightly

Weekly Market Insights with Gary Thomson: The Week of Central Banks and Earnings
In this video, we’ll explore the key economic events and market trends, shaping the financial landscape. Get ready for insights into financial markets to help you navigate the week ahead. Let’s dive in!
In this episode of Market