


Adam and Eve Double Bottom Chart Pattern
FXOpen
Chart patterns play a vital role in predicting future market trends. Among numerous chart formations used by traders, the Adam and Eve chart pattern holds a unique position, particularly for short-term bullish reversals. This article will dissect the nuances of this setup and provide a blueprint on how to capitalise on its signals effectively.
How to Identify the Adam and Eve Trading Setup
Recognising an Adam and Eve double bottom setup accurately is the first stepping stone towards profitable trading. Essentially, this comprises two distinctive lows: a sharply pointed 'Adam' and a broader, more rounded 'Eve'.

The Adam Bottom
Identifying an Adam bottom involves looking for a sharp downward spike within a bearish trend. That sudden dip pushes prices towards previous lows or forms new ones, creating a V-shaped low. The low may occur even in an uptrend; however, considering that we are studying double lows, such instances are generally disregarded.
Notably, a consecutive pair of spikes can also form an Adam low, given that the second spike's height is less than half of the first.
The Eve Bottom
The Eve bottom distinguishes itself from its predecessor with a rounded trough, indicating price congestion over a wider range. An Eve low typically follows an Adam low and is identified by its broader and smoother shape. The combination of the two troughs forms the unique Adam and Eve trading pattern.
Once we have correctly identified both lows, we will proceed to examine the overall characteristics of the formation using the following key points:
- Prior Price Trend: The direction and duration of the bearish trend leading to the two lows are not crucial, but a strong downtrend can enhance the potential returns.
- Price Rise: If there is a price rise of more than 10% between the two identified bottoms, the probability of a successful pattern increases, and tall setups tend to perform well.
- Volume: A tall volume bar at the Adam bottom is an indication of a valid Adam and Eve setup. Additionally, the volume should decrease from the Adam low to the Eve low.
- Confirmation of Breakout: The most crucial rule for identifying a valid Adam and Eve pattern on a candle chart is to wait for the confirmation of a breakout above its highest high; only after this confirmation is the formation considered valid.
You can try our free TickTrader platform to spot the formation on real charts.
What Drives the Adam and Eve Chart Pattern?
The success of any trading formula lies within the psychology of market participants. The Adam and Eve setup is no different.
As prices decline in a bearish market, a sharp fall to new lows — the Adam bottom — signals a bearish market sentiment. That low point becomes a crucial immediate support level. If prices halt near this support level on subsequent attempts, it signifies a potential shift in market sentiment. If the bears fail to push prices lower, the Adam and Eve pattern bullish reversal signal forms.
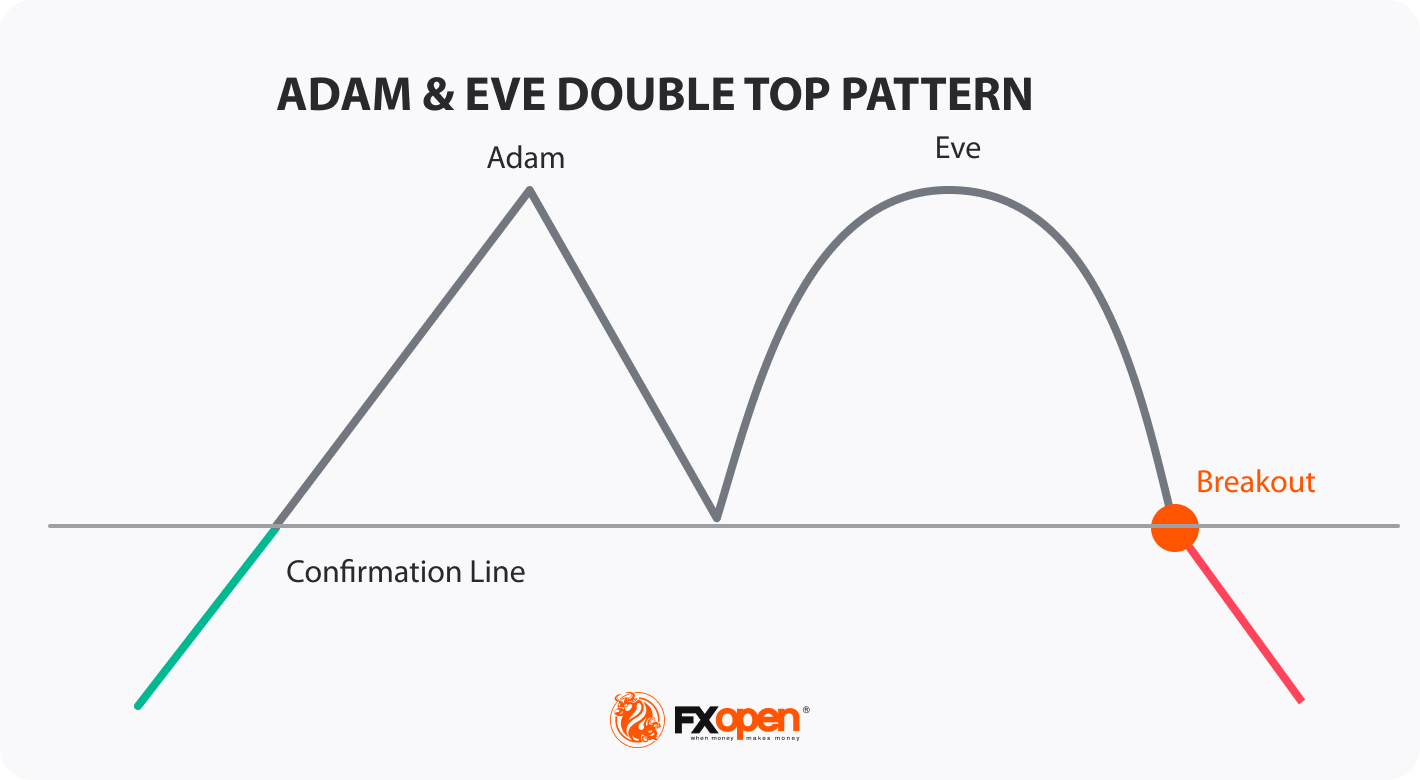
Inverted Adam and Eve Pattern
The formation can also take an inverted form. In an inverted or reverse Adam and Eve pattern, the market sentiment transitions from bullish to bearish.
It comprises two clear price phases:
- Adam Top: In the context of a bullish trend, an initial decline in price forms the Adam top. This decline precedes the subsequent stage of the pattern.
- Eve Top: Following the Adam top, there is a consolidation phase or a slowing of momentum, creating the Eve top.
When the market fails to recover from the Adam top and starts declining further, the reverse Adam and Eve setup is confirmed.
Trading Strategies with the Adam and Eve Double Bottom Pattern
Once you have identified a valid Adam and Eve formation, it's time to lay down a strategic trading plan. Traders may apply the following rules:
- Connect the highest highs of both lows with a confirmation line.
- Once the formation is confirmed, traders often enter a buy position when the price breaks above the line. This is seen as a signal that the downtrend may be reversing, and a potential uptrend is beginning.
- A stop-loss order can be placed below the lowest point of the setup.
- You can identify the Adam and Eve pattern target based on its height, so it equals the distance between the bottoms and the confirmation line.

The chart above shows the Adam and Eve setup on the M5 chart of USDJPY. The trader waits for the price to break above the confirmation line before taking a long position. Their stop loss is below the formation, with the take profit equal to the distance between the trough and the confirmation line.
Remember, a gap opening above the confirmation line should be interpreted as a bullish signal. It's also worth mentioning that savvy traders can even benefit from a failed Adam and Eve by adjusting their positions accordingly. Instead of sticking with the long position that was expected to benefit from a bullish reversal, they may reverse their position and take a short one to profit from the bearish continuation.
How to Improve Trading with the Adam and Eve Pattern
Trading using this setup may provide a lucrative opportunity, but it requires patience and understanding. Don't rush into a trade before it’s fully formed.
A failed formation – when prices break below the Eve bottom – can provide an excellent opportunity to trade with the trend. In such a case, consider shorting the market to profit from the continued bearish trend.
Remember, the bigger the setup, the greater the potential profit. A larger formation often indicates a better risk-reward ratio.
Two crucial indicators can increase your chances of a profitable trade: volume and RSI. A decrease in volume from the Adam bottom to the Eve bottom signals a valid formation. If there's a bullish divergence on the RSI, it strengthens the credibility of the pattern.
You can check this indicator on the FXOpen platform.
Despite its potential, trading the Adam and Eve can be challenging due to the psychological and performance errors that traders can make. It's important to remain disciplined and patient and to follow the trading plan you've established.
Conclusion
Adam and Eve pattern bearish and bullish scenarios provide numerous trading opportunities. Trading with the Adam and Eve formation can be effective, provided you exercise patience, strategic planning, and psychological discipline. Always remember, practice makes perfect — consider paper trading until you're comfortable with the pattern and trading strategy.
Ultimately, successful trading isn't merely about recognising patterns; it’s also about understanding the market psychology that underlies them. By comprehending this, traders can unlock the true potential of the setup. You can open an FXOpen account now and use your recently obtained knowledge for live market trading.
FAQs
What is the Adam and Eve pattern?
It is a unique double bottom chart pattern used in technical analysis to predict a potential bullish reversal in the short term.
How can I identify the formation?
The setup consists of two distinct troughs: the sharp and narrow 'Adam' and the wide and rounded 'Eve'. Together, they form a 'double bottom' in price action.
Can the setup be used in bearish markets?
Yes, the bearish variation is called the inverted or reverse Adam and Eve. In this situation, 'Adam' is a sharp rally, followed by a broad, rounded 'Eve' top, signalling a possible bearish reversal.
How do I trade Adam & Eve?
Trading the Adam and Eve pattern involves connecting the highest points of two consecutive lows using a confirmation line. When the formation is confirmed, traders typically initiate a buy position after the price surpasses this line, indicating a possible reversal from a downtrend to an uptrend. Placing a stop-loss order beneath the formation's lowest point is crucial for risk management. The target can be determined by measuring its height, which corresponds to the distance between the lows and the confirmation line.
This article represents the opinion of the Companies operating under the FXOpen brand only. It is not to be construed as an offer, solicitation, or recommendation with respect to products and services provided by the Companies operating under the FXOpen brand, nor is it to be considered financial advice.
Stay ahead of the market!
Subscribe now to our mailing list and receive the latest market news and insights delivered directly to your inbox.


Latest articles

NVDA Shares Approach Strong Resistance
Production of NVIDIA processors is concentrated in Taiwan via TSMC, making the company sensitive to US trade policy. In the first quarter of fiscal 2026, NVIDIA recorded a $4.5bn write-down due to restrictions on H20 chip exports to China.

Euro and Sterling Weaken as the Dollar Strengthens Ahead of Key US Data
The US dollar continues to hold firm against its major counterparts, supported by strong US macroeconomic data and expectations surrounding the release of further labour market indicators. Additional support for the greenback comes from persistent inflationary risks and the Federal

Gold: Attempt to Break Out of the Short-Term Trend
Fundamental backdrop
In April, US inflation stood at 3.8% year-on-year — the highest level since May 2023. A significant contribution came from rising fuel prices amid escalating tensions in the Middle East. Market reaction was somewhat paradoxical: instead of inflows