


AUD/USD Consolidates Gains While NZD/USD Dips
FXOpen

AUD/USD is consolidating gains near the 0.6420 zone. NZD/USD is trimming gains and struggling to stay above the 0.5945 pivot zone.
Important Takeaways for AUD/USD and NZD/USD Analysis Today
· The Aussie Dollar started a downside correction from 0.6450 against the US Dollar.
· There was a break above a key bearish trend line with resistance near 0.6400 on the hourly chart of AUD/USD at FXOpen.
· NZD/USD is declining from the 0.6030 resistance zone.
· There is a major bearish trend line forming with resistance near 0.5970 on the hourly chart of NZD/USD at FXOpen.
AUD/USD Technical Analysis
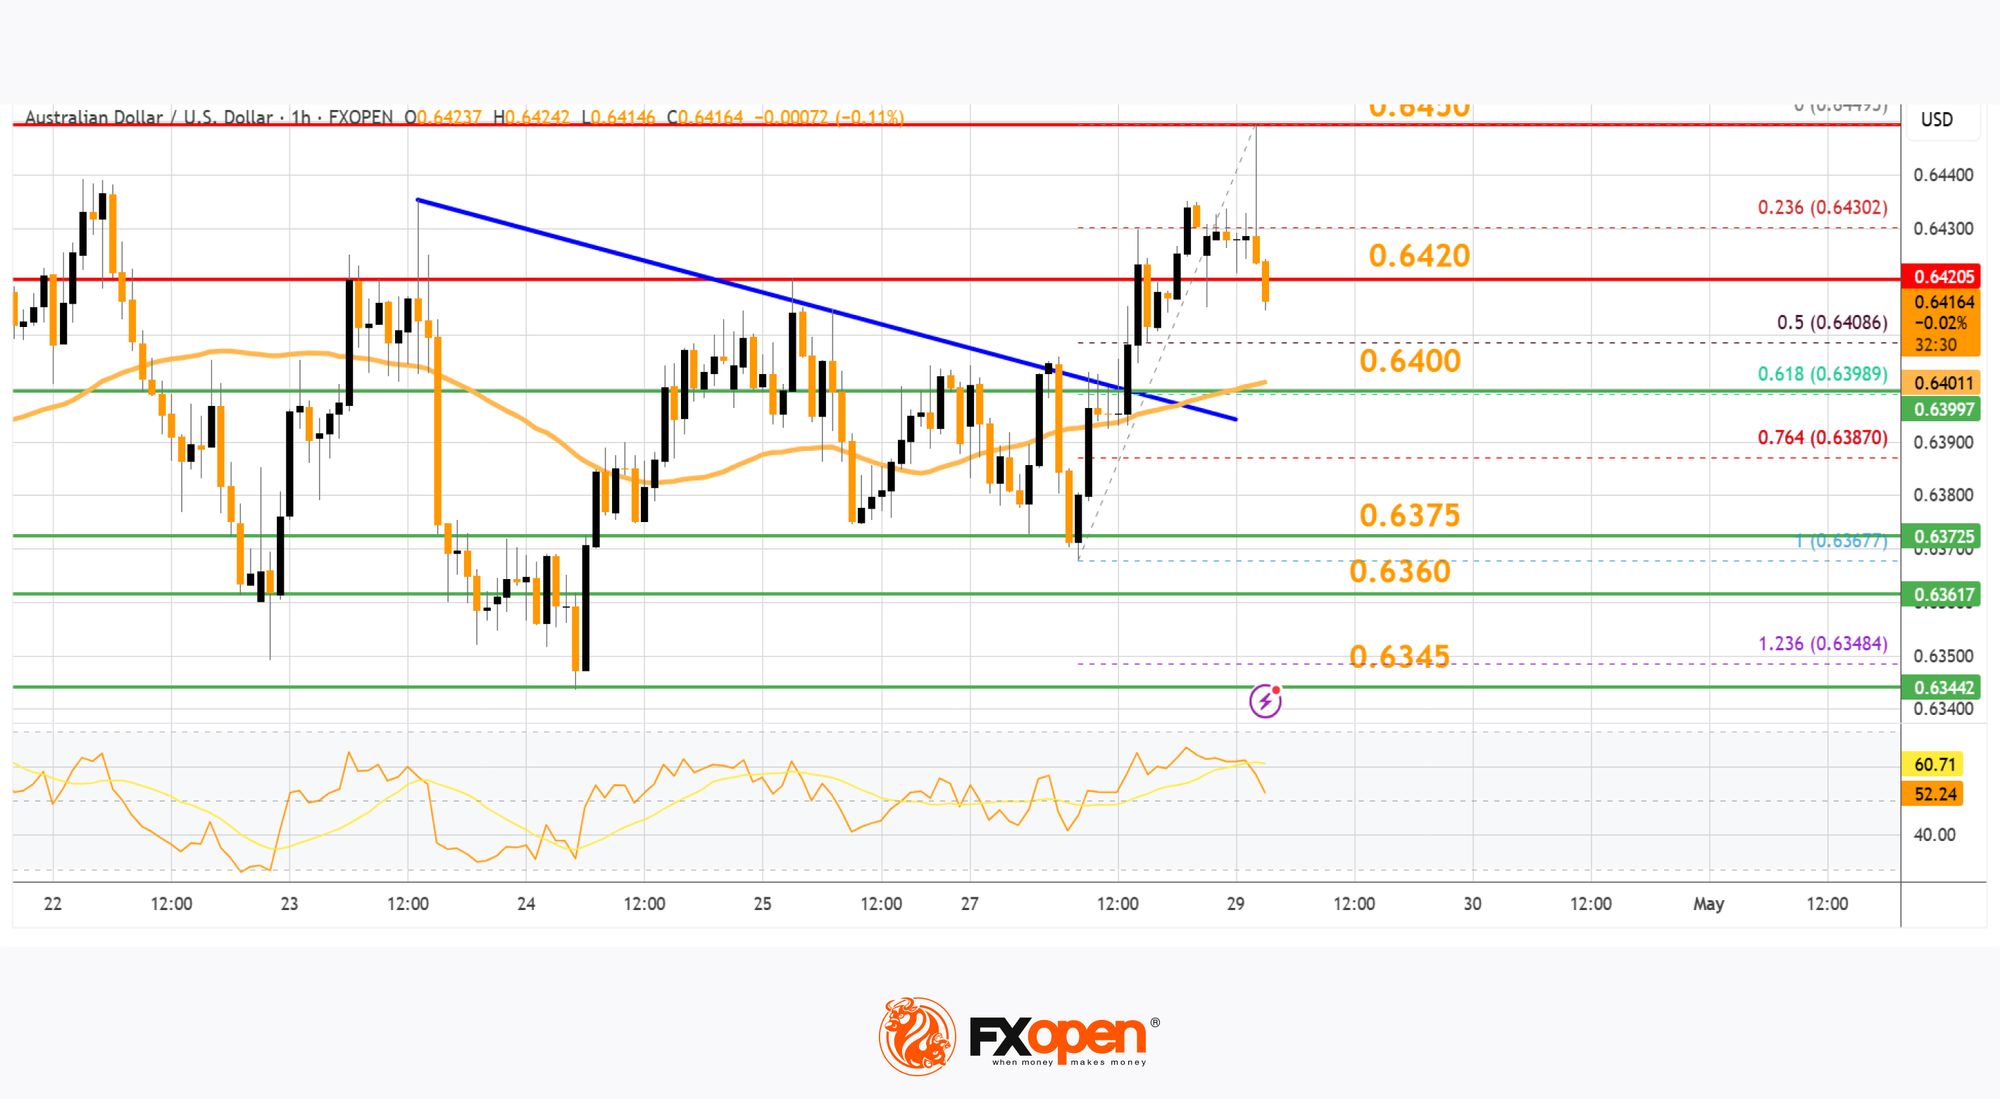
On the hourly chart of AUD/USD at FXOpen, the pair started a fresh increase from the 0.6345 support. The Aussie Dollar was able to clear the 0.6375 resistance to move into a positive zone against the US Dollar.
There was also a move above the 0.6400 resistance and the 50-hour simple moving average. There was also a break above a key bearish trend line with resistance near 0.6400. Finally, the pair tested the 0.6450 zone. A high was formed near 0.6450 and the pair is now correcting gains.
There was a move below the 0.6420 level. The pair declined below the 23.6% Fib retracement level of the upward move from the 0.6367 swing low to the 0.6449 high.
On the downside, initial support is near the 0.6400 level. It is close to the 61.8% Fib retracement level of the upward move from the 0.6367 swing low to the 0.6449 high. The next major support is near the 0.6360 level.
If there is a downside break below the 0.6360 support, the pair could extend its decline toward the 0.6345 level. Any more losses might signal a move toward 0.6300.
On the upside, the AUD/USD chart indicates that the pair is now facing resistance near 0.6420. The first major resistance might be 0.6450. An upside break above the 0.6450 resistance might send the pair further higher.
The next major resistance is near the 0.6485 level. Any more gains could clear the path for a move toward the 0.6550 resistance zone.
NZD/USD Technical Analysis
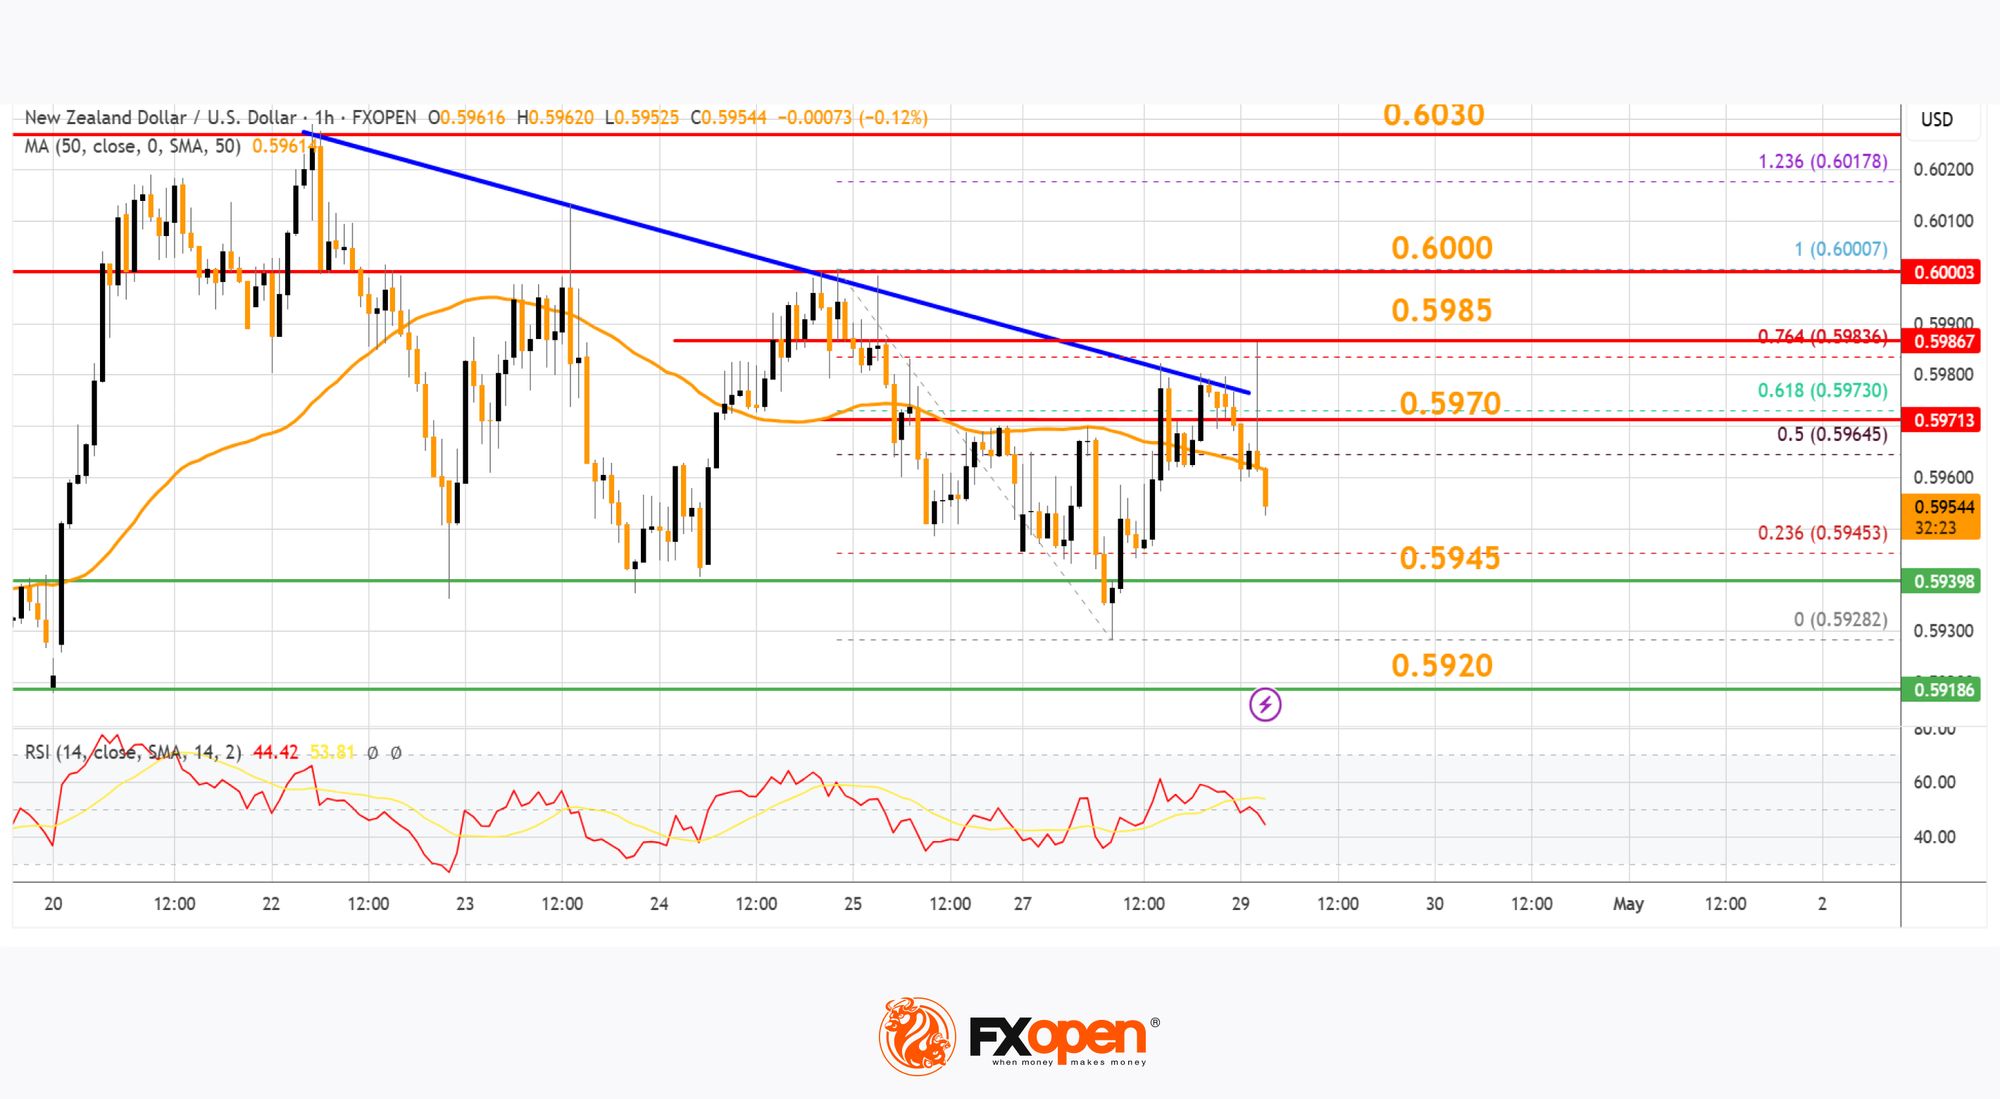
On the hourly chart of NZD/USD on FXOpen, the pair attempted another wave above the 0.6000 zone but failed. The New Zealand Dollar started another downward move from 0.6000 and dipped below 0.5980 against the US Dollar.
The pair settled below the 0.5970 level and the 50-hour simple moving average. It tested the 0.5930 zone and is currently consolidating losses near the 50% Fib retracement level of the downward move from the 0.6000 swing high to the 0.5928 low.
The NZD/USD chart suggests that the RSI is now well below 50 and signaling more downsides. On the downside, there is major support forming near 0.5945.
The next major support is near the 0.5920 level. If there is a downside break below the 0.5920 support, the pair might slide toward the 0.5880 support. Any more losses could lead NZD/USD in a bearish zone to 0.5840.
On the upside, the pair might struggle near 0.5970 and the 61.8% Fib retracement level of the downward move from the 0.6000 swing high to the 0.5928 low.
There is also a major bearish trend line forming with resistance near 0.5970. The next major resistance is near the 0.5985 level. A clear move above the 0.5985 level might even push the pair toward the 0.6000 level. Any more gains might clear the path for a move toward the 0.6030 resistance zone in the coming days.
Trade over 50 forex markets 24 hours a day with FXOpen. Take advantage of low commissions, deep liquidity, and spreads from 0.0 pips (additional fees may apply). Open your FXOpen account now or learn more about trading forex with FXOpen.
This article represents the opinion of the Companies operating under the FXOpen brand only. It is not to be construed as an offer, solicitation, or recommendation with respect to products and services provided by the Companies operating under the FXOpen brand, nor is it to be considered financial advice.
Stay ahead of the market!
Subscribe now to our mailing list and receive the latest market news and insights delivered directly to your inbox.


Latest articles

Nasdaq 100: 48 Hours of Chaos, One Trendline Standing in the Way
Wall Street just lived through one of its wildest 48 hours of the year. On Wednesday, the Fed held rates steady at 3.50%-3.75%, but three FOMC members broke ranks to demand a hike—an unusually hawkish dissent

Amazon Analysis: Strong Earnings Coincide with a Breakout from the Correction
On 30 July, Amazon.com reported its financial results for the second quarter of 2026, significantly exceeding market expectations. Revenue rose 20% year-on-year to $200.6 billion, compared with the consensus forecast of around $196.5 billion. The main growth

GBP/USD and EUR/GBP Await Key Bank of England Decision
The pound strengthened following the outcome of the US Federal Reserve meeting, where the central bank, as expected, kept interest rates unchanged. However, the Fed did not provide the market with clear signals of an imminent shift towards rate cuts,