


EUR/CHF and USD/CHF Weekly Chart Outlook
FXOpen
EUR/CHF is struggling to clear the 0.9960 resistance zone. USD/CHF could gain pace if it clears the 0.9290 resistance zone.
Important Takeaways for EUR/CHF and USD/CHF Analysis
· The Euro is facing strong resistance near 0.9960 against the Swiss Franc.
· There is a key bearish trend line forming with resistance near 0.9850 on the weekly chart of EUR/CHF at FXOpen.
· USD/CHF found support near 0.8820 and recently started an upside correction.
· There is a crucial bearish trend line forming with resistance near 0.9200 on the weekly chart at FXOpen.
EUR/CHF Technical Analysis
On the weekly chart of EUR/CHF at FXOpen, the pair started a decent recovery wave from the 0.9400 support zone. The Euro was able to climb above 0.9670 against the Swiss Franc.
During the increase, it traded above the 50% Fib retracement level of the last major decline from the 1.0515 swing high to the 0.9406 low. There was also a spike above the 0.9960 resistance and the 50-week simple moving average.
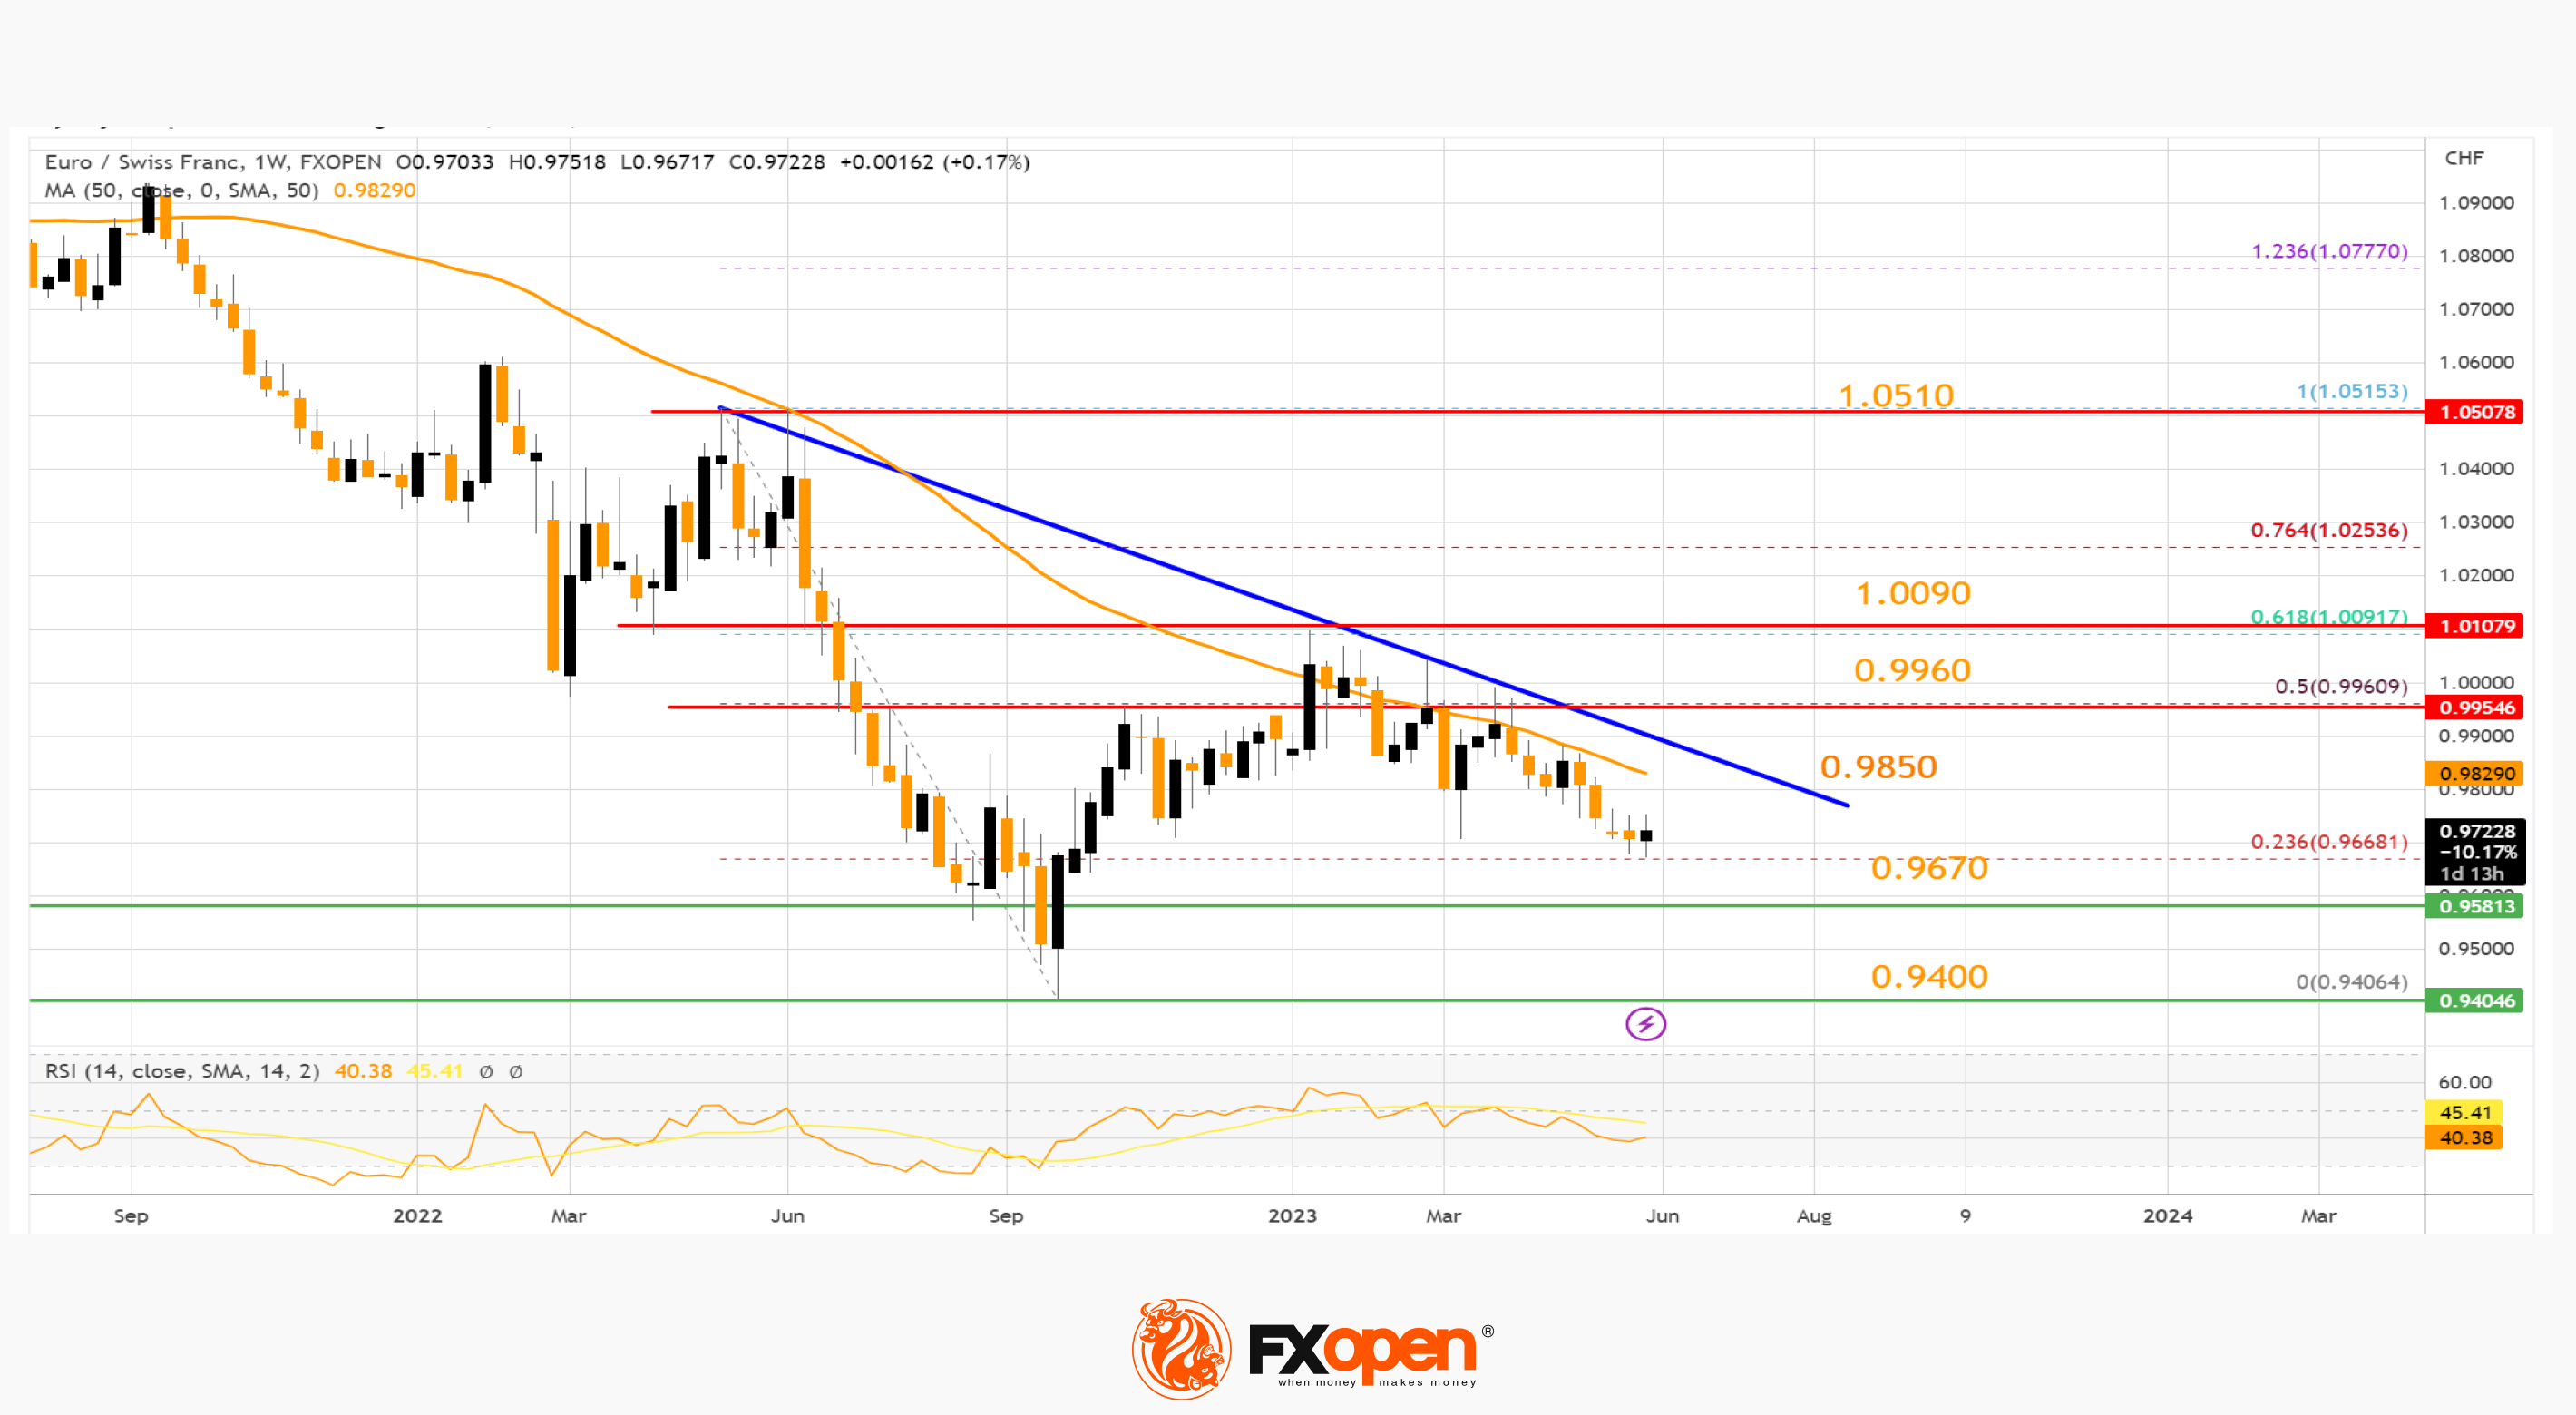
However, the pair struggled to clear the 1.0090 resistance zone. It failed near the 61.8% Fib retracement level of the last major decline from the 1.0515 swing high to the 0.9406 low.
On the EUR/CHF chart, the pair is moving lower and trading below the 50-week simple moving average. Immediate support is near the 0.9670 level. The first major support is near the 0.9400 level, below which the pair could decline toward 0.9200.
On the upside, the first major resistance is forming near a key bearish trend line at 0.9850. The next major resistance is near the 0.9960 level, above which the pair might revisit the 1.0090 resistance zone if the weekly RSI moves above 50. Any more gains might the pair toward 1.0500.
USD/CHF Technical Analysis
On the weekly chart of USD/CHF, the pair faced strong rejection near the 1.0100 level. The US Dollar started a major decline below the 0.9500 support against the Swiss Franc.
The pair tested the 0.8820 support. A low was formed near 0.8820 and the pair is now rising. It broke the 23.6% Fib retracement level of the downward move from the 0.9440 swing high to the 0.8820 low.
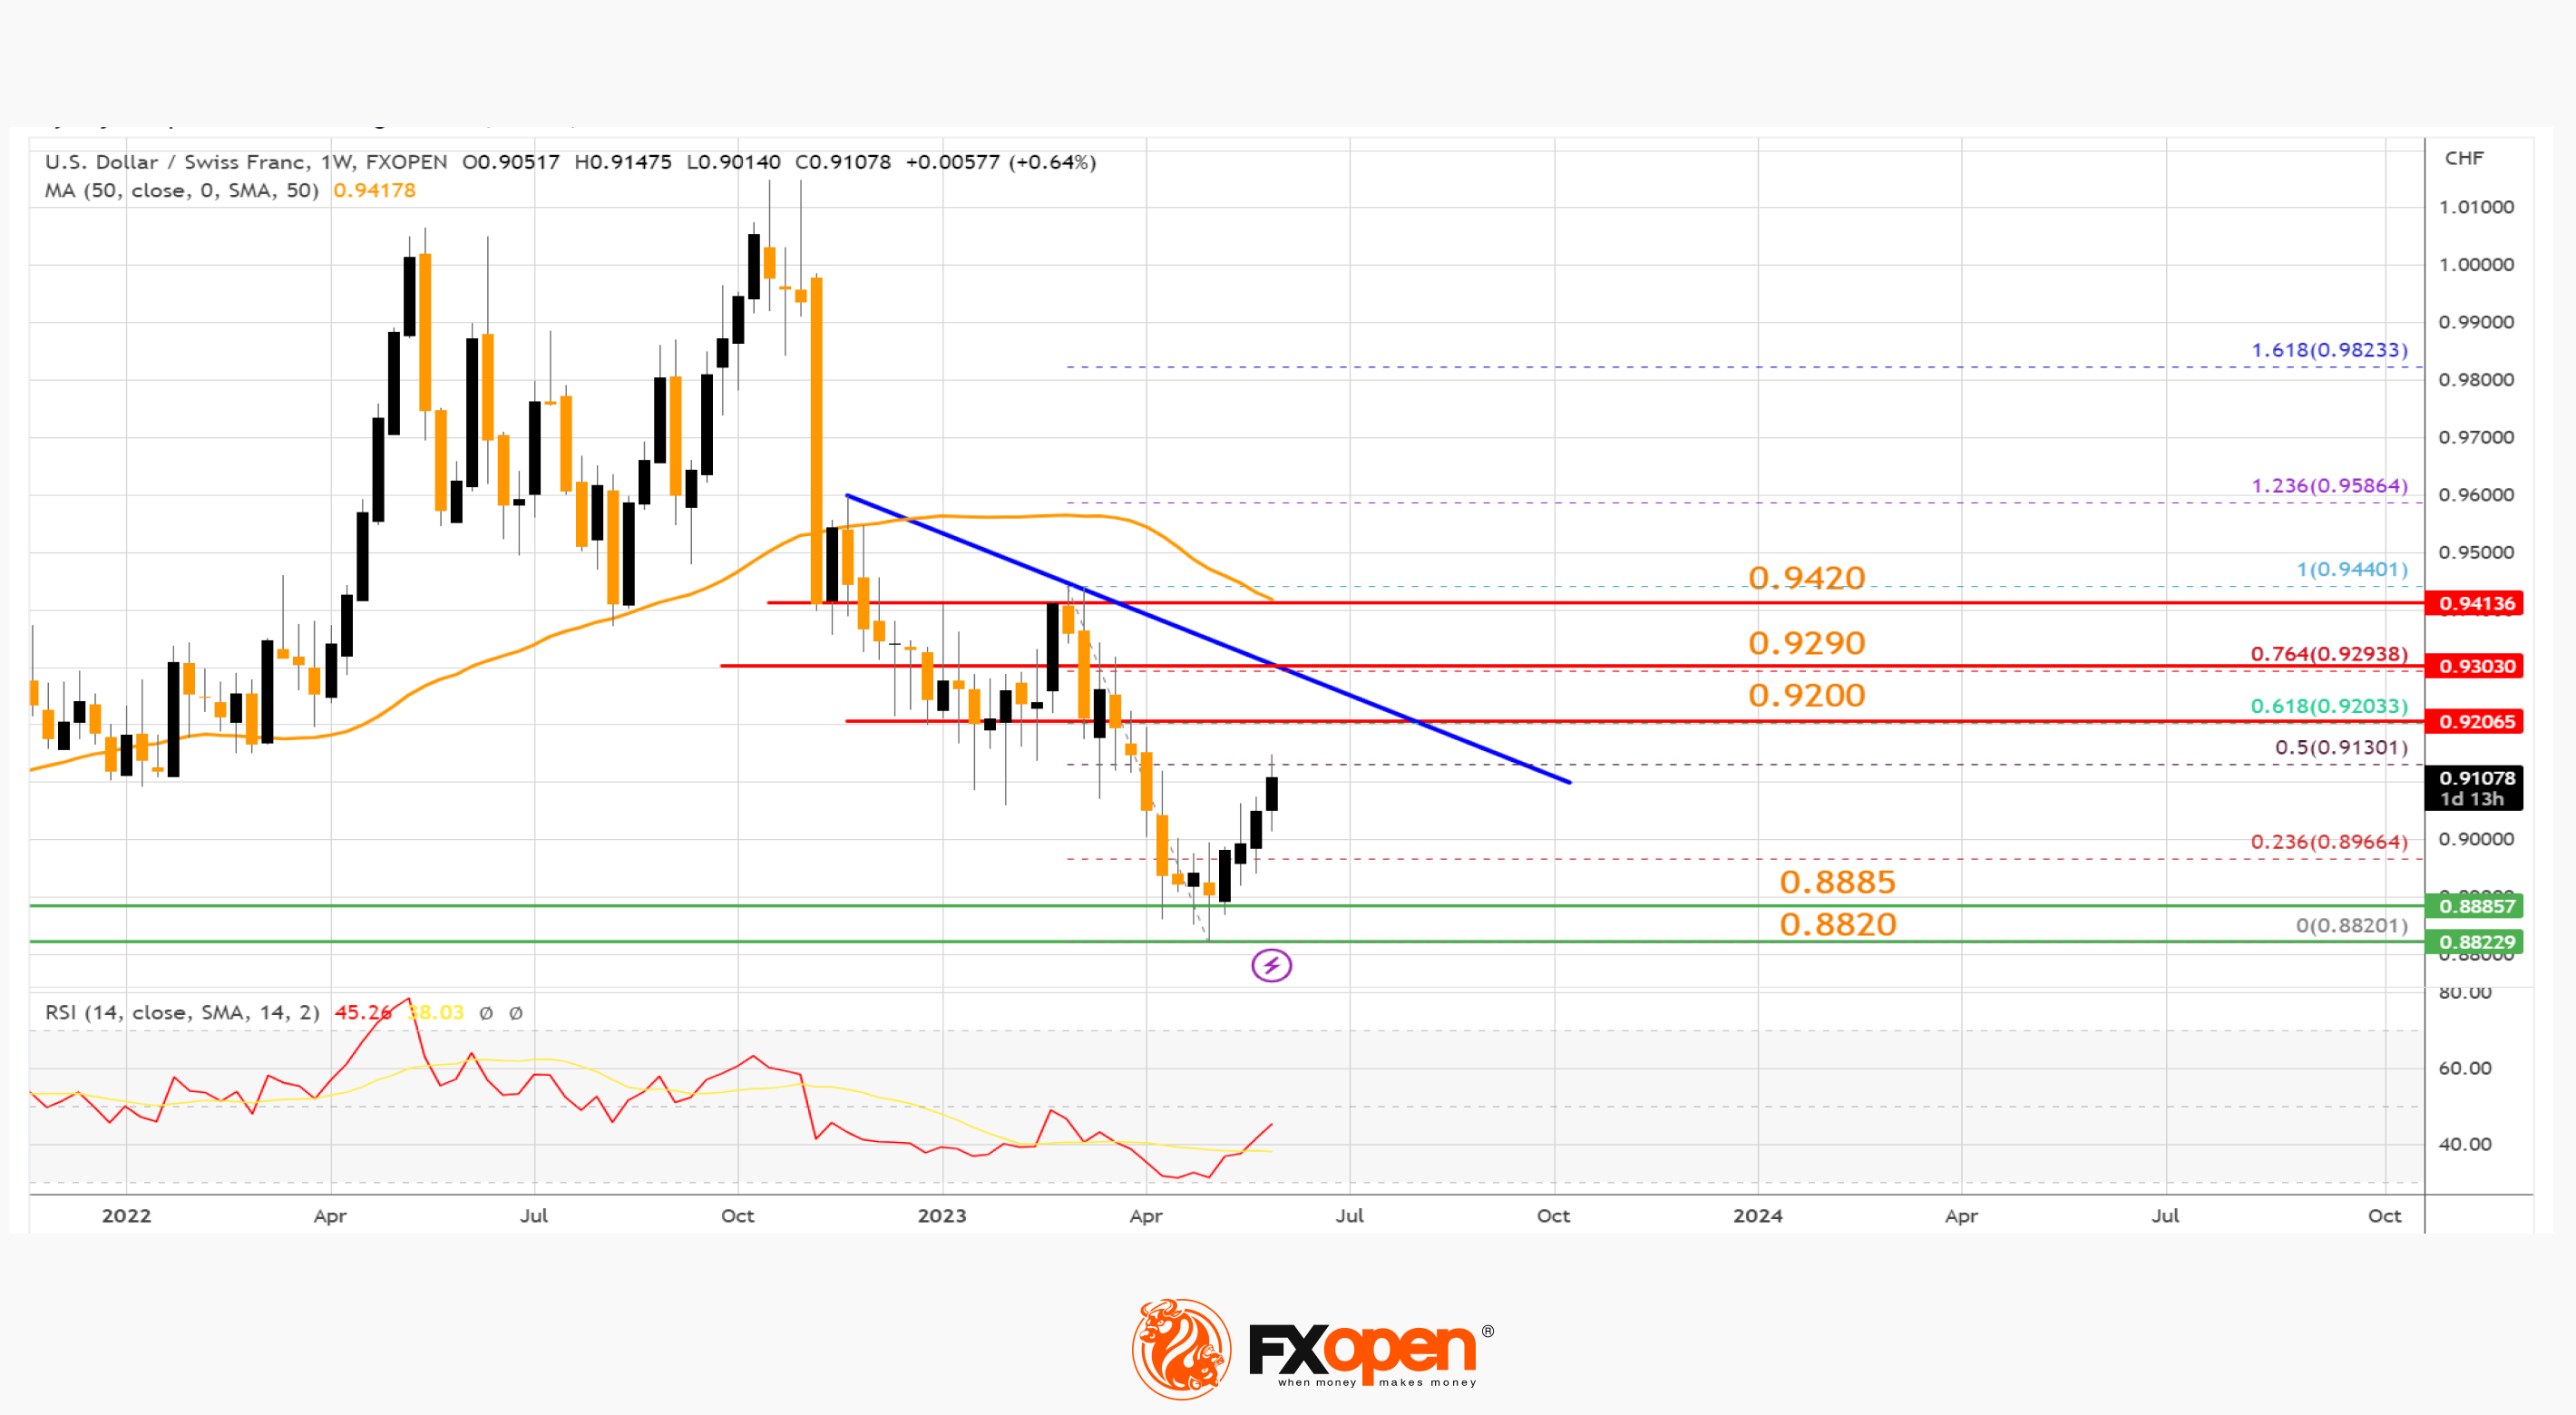
On the upside, the pair is facing resistance near a key bearish trend line at 0.9200. It is close to the 61.8% Fib retracement level of the downward move from the 0.9440 swing high to the 0.8820 low. The next major resistance is near the 0.9290 level.
The main resistance on the USD/CHF chart is near the 50-week simple moving average at 0.9420. A successful close above 0.9420 is likely to start a strong upward move toward 0.9800 in the coming weeks.
Conversely, if USD/CHF fails to break 0.9200, it could retreat lower and revisit the 0.8885 support area. The next major support is near the 0.8820 level. A downside break below the 0.8820 support might send the pair toward 0.8650.
Any more losses might push the pair further into a bearish zone. In the stated case, there is a risk of a drop toward the 0.8200 support zone in the medium term.
Trade over 50 forex markets 24 hours a day with FXOpen. Take advantage of low commissions, deep liquidity, and spreads from 0.0 pips (additional fees may apply). Open your FXOpen account now or learn more about trading forex with FXOpen.
This article represents the opinion of the Companies operating under the FXOpen brand only. It is not to be construed as an offer, solicitation, or recommendation with respect to products and services provided by the Companies operating under the FXOpen brand, nor is it to be considered financial advice.
Stay ahead of the market!
Subscribe now to our mailing list and receive the latest market news and insights delivered directly to your inbox.


Latest articles

Weekly Market Insights with Gary Thomson: The Week of Central Banks and Earnings
In this video, we’ll explore the key economic events and market trends, shaping the financial landscape. Get ready for insights into financial markets to help you navigate the week ahead. Let’s dive in!
In this episode of Market

Intel at a Crossroads: Earnings Beat Meets Technical Resistance
Intel has just delivered its strongest quarter in over fifteen years, and the market reaction says it all. Q2 2026 revenue surged 25% year-over-year to $16.1 billion, crushing the consensus estimate of $14.42 billion, while adjusted EPS of

Tesla: Complex Range Structure Breaks Down Following Quarterly Earnings
Tesla released its Q2 2026 results after the market closed on 22 July. Revenue increased 26% year-on-year to $28.24 billion, while vehicle deliveries reached a record 480,126 units. However, operating margin fell sharply to 1.4%, down from