


Gold and WTI Crude Oil Regain Bullish Momentum
FXOpen

Gold price started a fresh surge above the $3,375 resistance level. WTI Crude oil prices climbed higher above $70.00 and might extend gains.
Important Takeaways for Gold and WTI Crude Oil Prices Analysis Today
· Gold price started a fresh surge and traded above $3,420 against the US Dollar.
· A key bullish trend line is forming with support at $3,415 on the hourly chart of gold at FXOpen.
· WTI Crude oil prices started a decent increase above the $65.00 and $68.50 resistance levels.
· There is a major bullish trend line forming with support at $71.50 on the hourly chart of XTI/USD at FXOpen.
Gold Price Technical Analysis
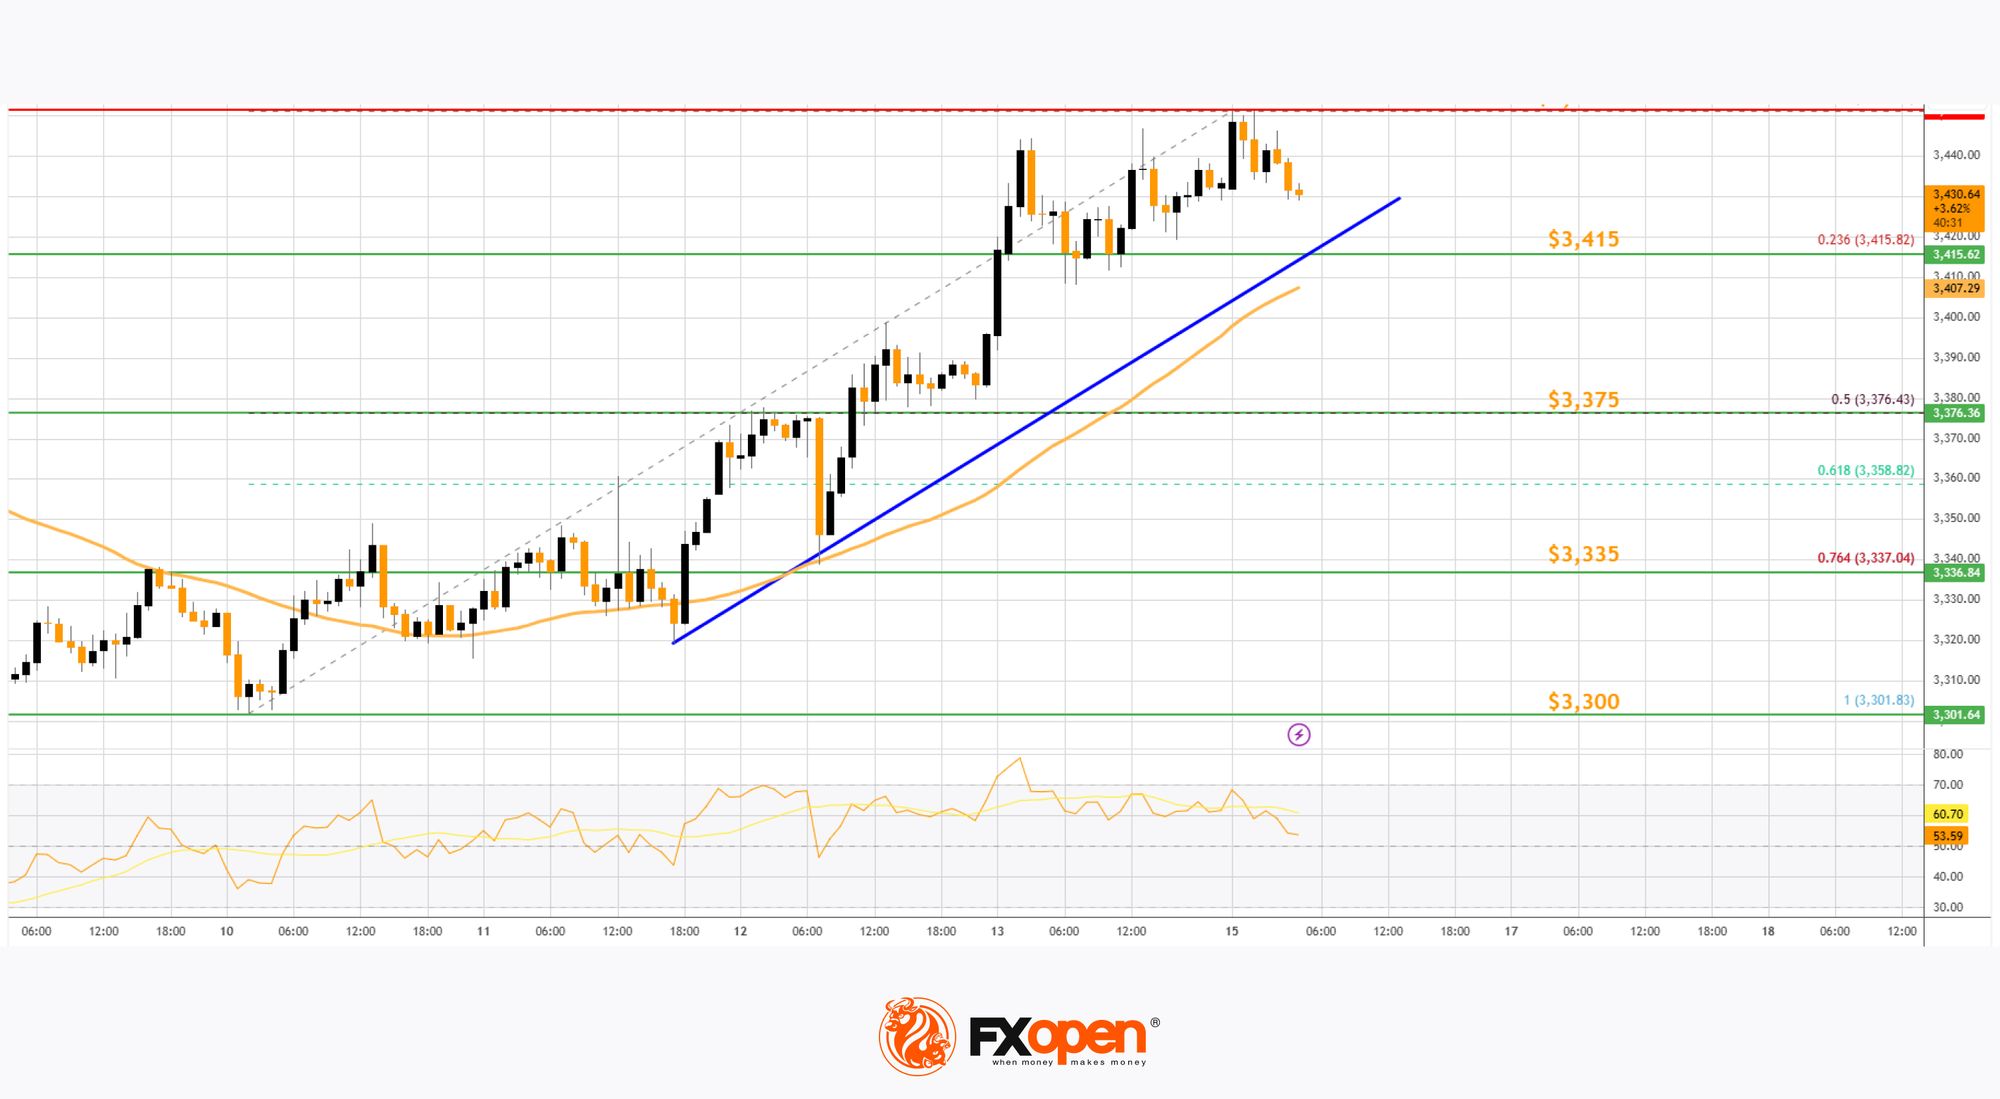
On the hourly chart of Gold at FXOpen, the price formed a base near the $3,300 zone. The price started a steady increase above the $3,350 and $3,375 resistance levels.
There was a decent move above the 50-hour simple moving average and $3,400. The bulls pushed the price above the $3,420 resistance zone. A high was formed near $3,450 and the price is now consolidating gains.
On the downside, immediate support is near the $3,415 level and the 23.6% Fib retracement level of the upward move from the $3,301 swing low to the $3,451 high.
Besides, there is a key bullish trend line forming with support at $3,415. The next major support sits at $3,375 and the 50% Fib retracement level of the upward move from the $3,301 swing low to the $3,451 high.
A downside break below the $3,375 support might send the price toward the $3,335 support. Any more losses might send the price toward the $3,300 support zone.
Immediate resistance is near the $3,450 level. The next major resistance is near the $3,460 level. An upside break above the $3,460 resistance could send Gold price toward $3,480. Any more gains may perhaps set the pace for an increase toward the $3,500 level.
Oil Price Technical Analysis
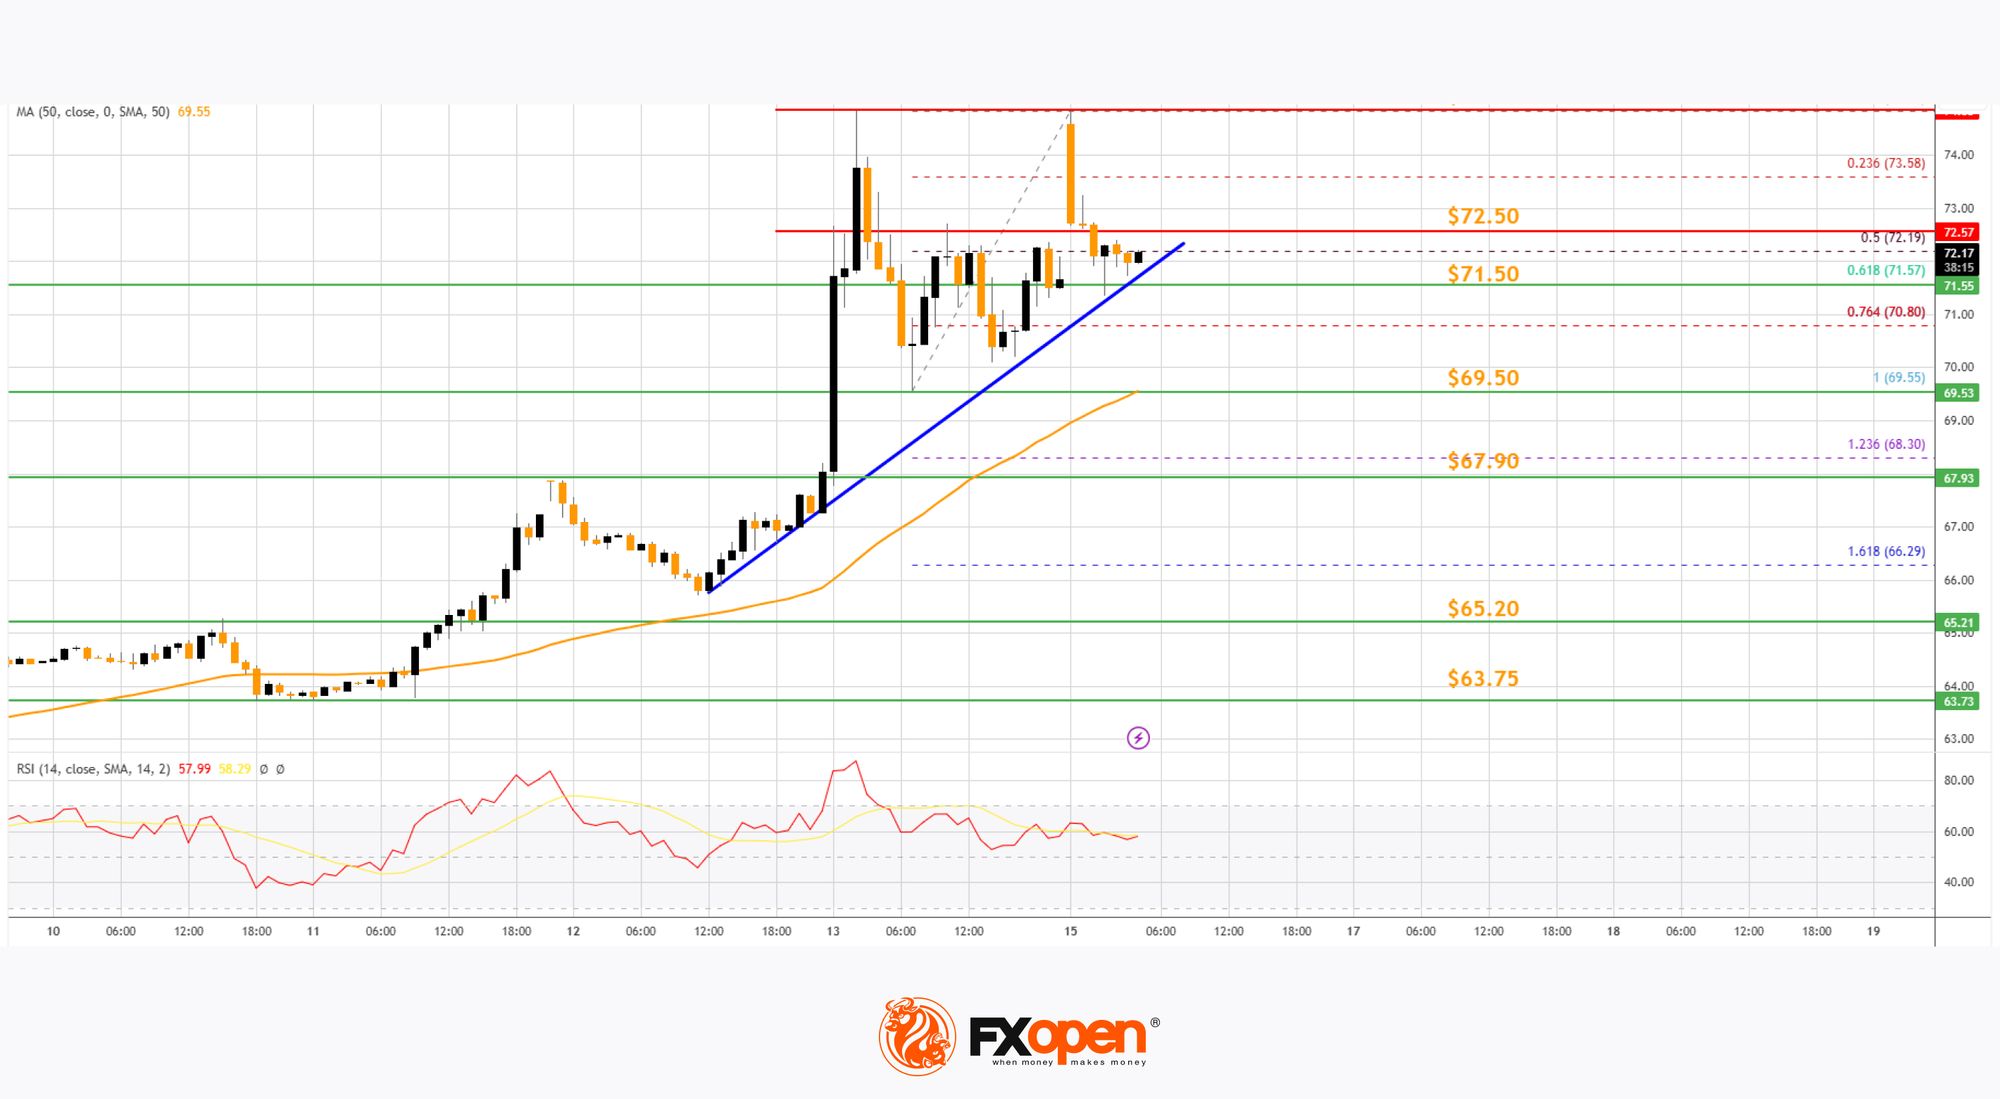
On the hourly chart of WTI Crude Oil at FXOpen, the price started a decent upward move from $65.00 against the US Dollar. The price gained bullish momentum after it broke the $68.50 resistance and the 50-hour simple moving average.
The bulls pushed the price above the $69.50 and $71.50 resistance levels. The recent high was formed at $74.80 and the price started a downside correction. There was a minor move below the 50% Fib retracement level of the upward move from the $69.55 swing low to the $74.83 high.
The RSI is now below the 60 level. Immediate support on the downside is near the $71.50 zone. There is also a major bullish trend line forming with support at $71.50 and the 61.8% Fib retracement level of the upward move from the $69.55 swing low to the $74.83 high.
The next major support on the WTI crude oil chart is near the $69.50 zone, below which the price could test the $67.90 level. If there is a downside break, the price might decline toward $65.20. Any more losses may perhaps open the doors for a move toward the $63.75 support zone.
If the price climbs higher again, it could face resistance near $72.50. The next major resistance is near the $74.80 level. Any more gains might send the price toward the $78.50 level.
Start trading commodity CFDs with tight spreads (additional fees may apply). Open your trading account now or learn more about trading commodity CFDs with FXOpen.
This article represents the opinion of the Companies operating under the FXOpen brand only. It is not to be construed as an offer, solicitation, or recommendation with respect to products and services provided by the Companies operating under the FXOpen brand, nor is it to be considered financial advice.
Stay ahead of the market!
Subscribe now to our mailing list and receive the latest market news and insights delivered directly to your inbox.


Latest articles

Intel at a Crossroads: Earnings Beat Meets Technical Resistance
Intel has just delivered its strongest quarter in over fifteen years, and the market reaction says it all. Q2 2026 revenue surged 25% year-over-year to $16.1 billion, crushing the consensus estimate of $14.42 billion, while adjusted EPS of

Tesla: Complex Range Structure Breaks Down Following Quarterly Earnings
Tesla released its Q2 2026 results after the market closed on 22 July. Revenue increased 26% year-on-year to $28.24 billion, while vehicle deliveries reached a record 480,126 units. However, operating margin fell sharply to 1.4%, down from

Pound Weakens After Soft UK Inflation Data as Euro Awaits Fresh Market Signals
The pound remains under pressure following the release of weaker-than-expected UK inflation data. The slowdown in inflation has strengthened expectations that the Bank of England could adopt a more accommodative policy stance in the coming months, weighing on sterling. Meanwhile,