


FXOpen

Gold price started a fresh surge above $3,750 and traded to a new all-time high. Crude oil is recovering and might rise toward the $64.30 resistance zone.
Important Takeaways for Gold and WTI Crude Oil Prices Analysis Today
· Gold price rallied to a new all-time high and traded close to $3,800 against the US Dollar.
· A short-term bullish flag pattern is forming with resistance at $3,770 on the hourly chart of gold at FXOpen.
· WTI Crude oil is recovering losses and trading above $62.60.
· There is a major bearish trend line in place with resistance near $63.65 on the hourly chart of XTI/USD at FXOpen.
Gold Price Technical Analysis
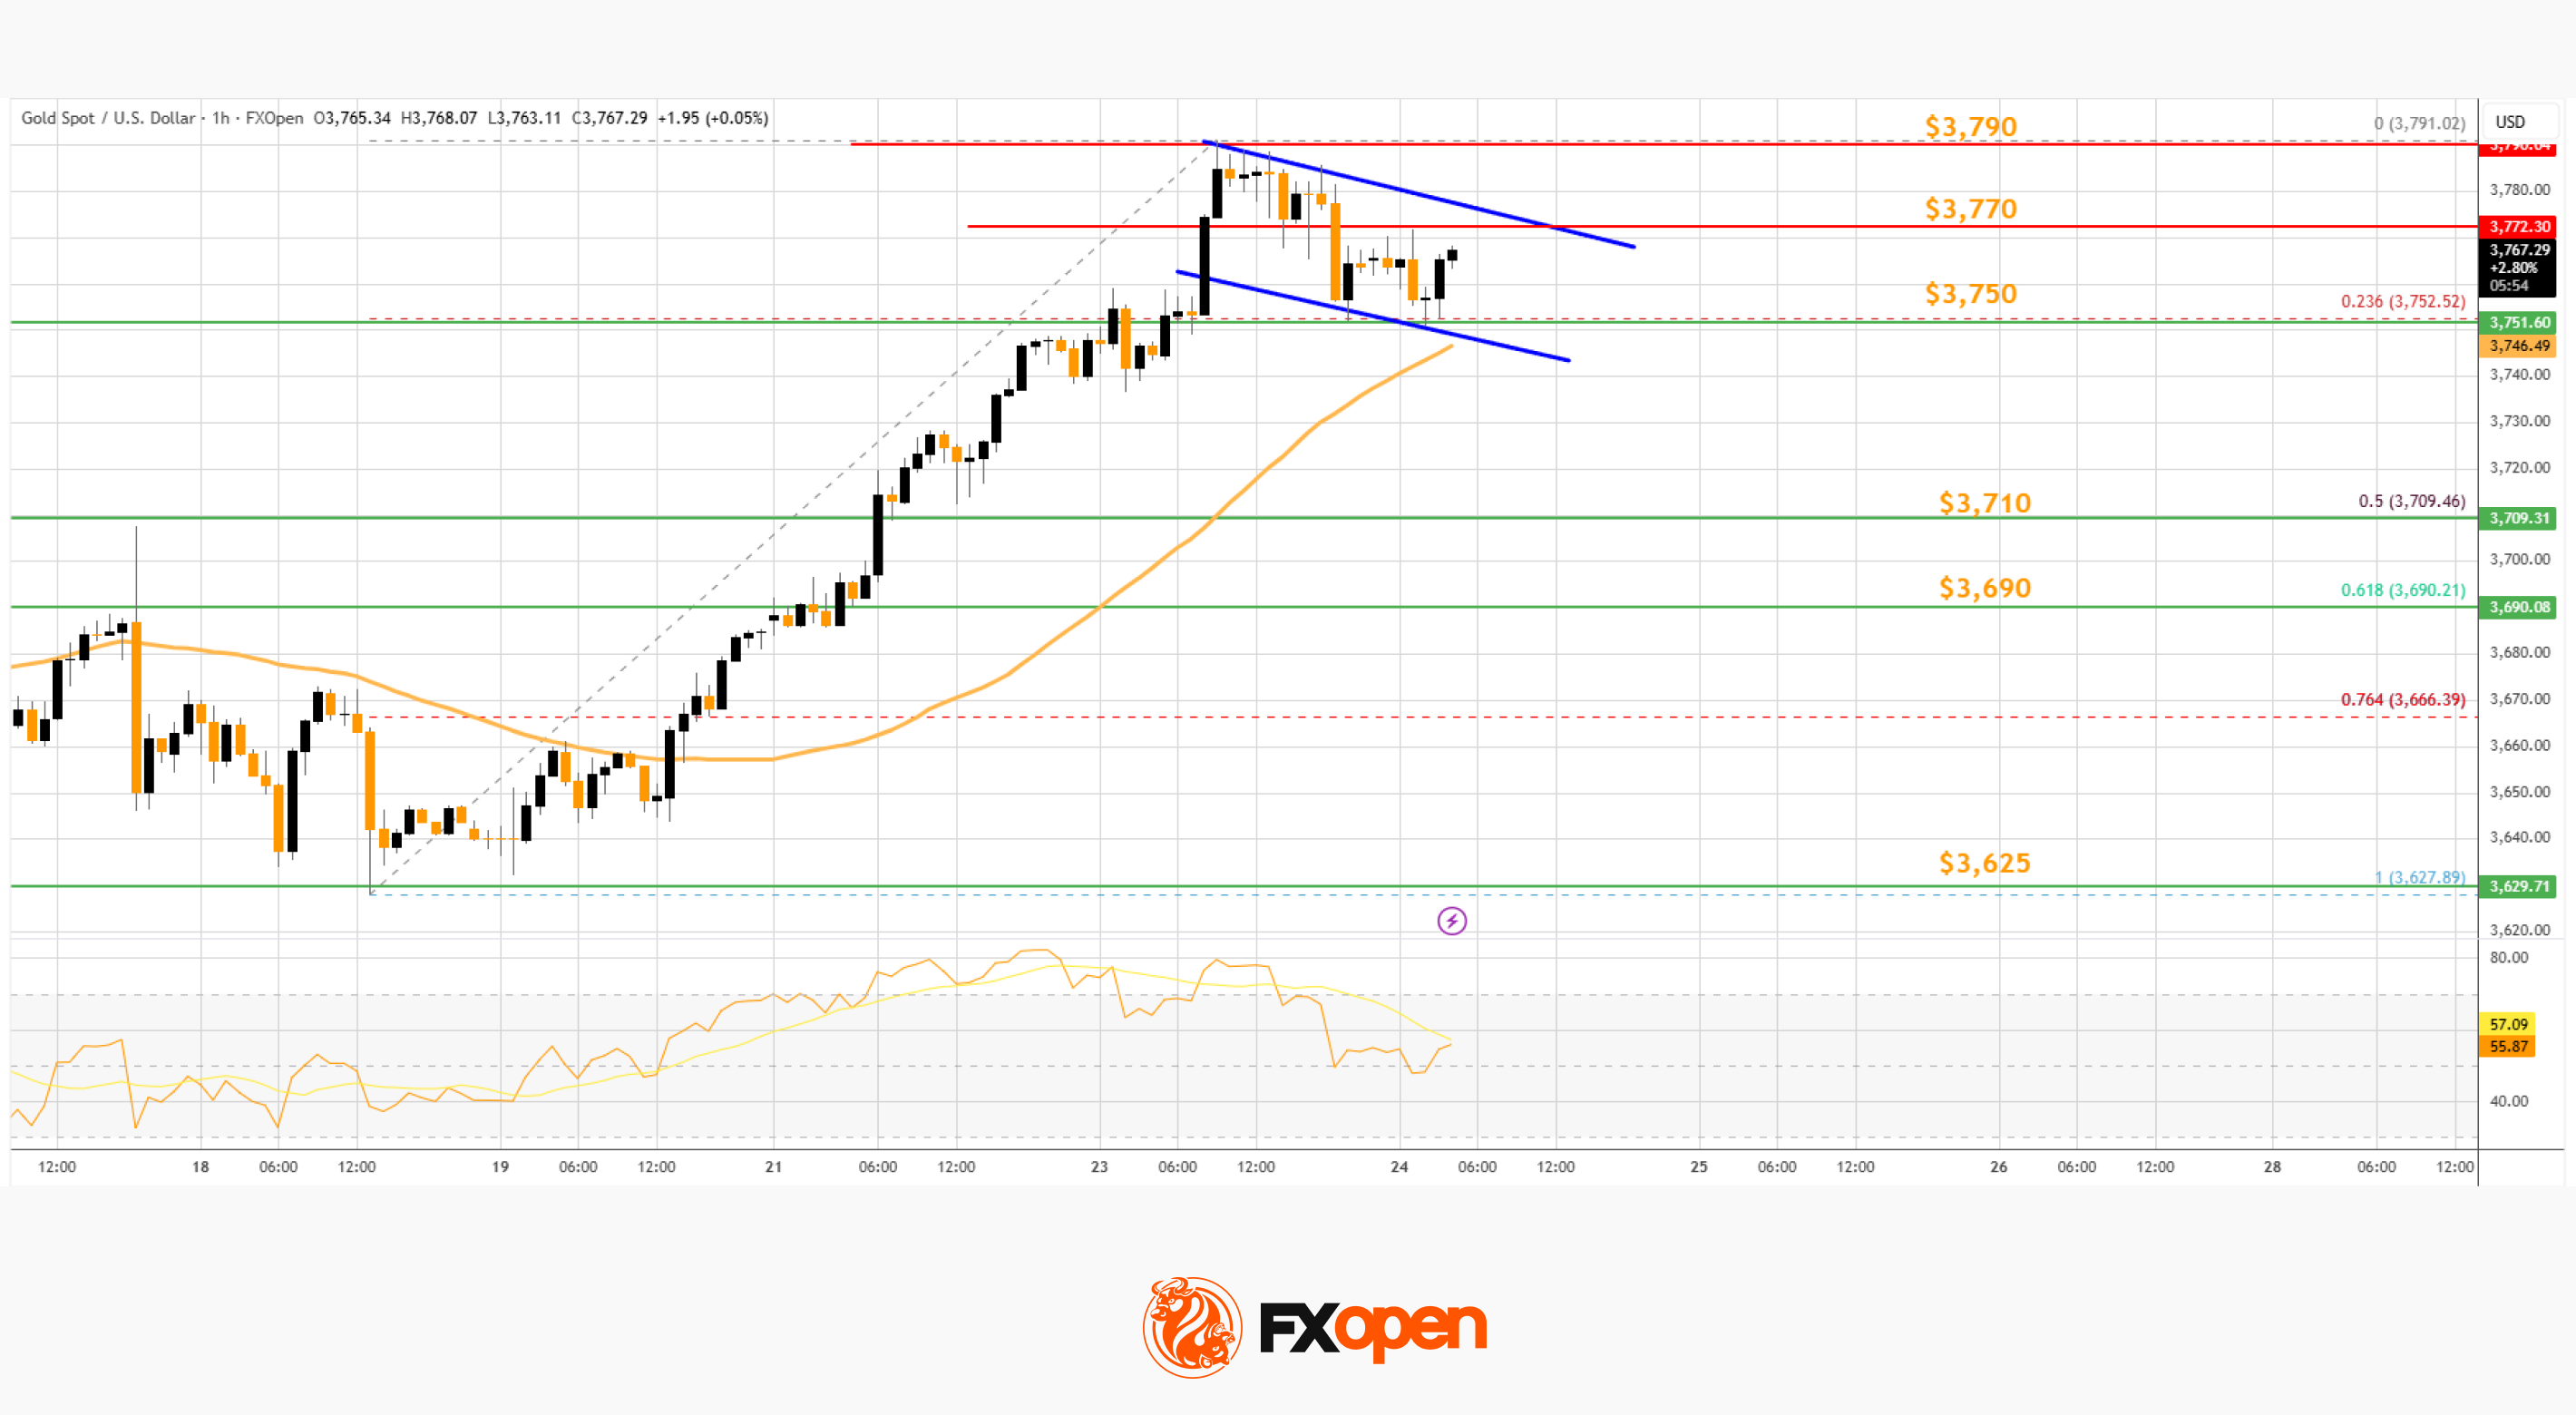
On the hourly chart of Gold at FXOpen, the price formed support near $3,625. The price remained in a bullish zone and started a fresh increase above $3,660, as mentioned in the previous analysis.
The bulls pushed the price above $3,750 level and the 50-hour simple moving average. Finally, it traded to a new all-time high at $3,791. The price is now consolidating gains below $3,770 and the RSI is above 50.
Initial support on the downside is near the 23.6% Fib retracement level of the upward move from the $3,627 swing low to the $3,791 high at $3,750 and the 50-hour simple moving average.
A downside break below $3,750 could start a larger downside correction. In the stated case, Gold could drop toward the 50% Fib retracement at $3,710. The next area of interest for the bulls might be $3,690. A daily close below $3,690 could spark bearish moves and send the price to $3,625.
If there is a fresh increase, the price could face resistance at $3,770 and a short-term bullish flag pattern. The next sell zone might be $3,790. An upside break above the $3,790 resistance could send Gold price toward $3,820. Any more gains may perhaps set the pace for an increase to $3,850.
WTI Crude Oil Price Technical Analysis
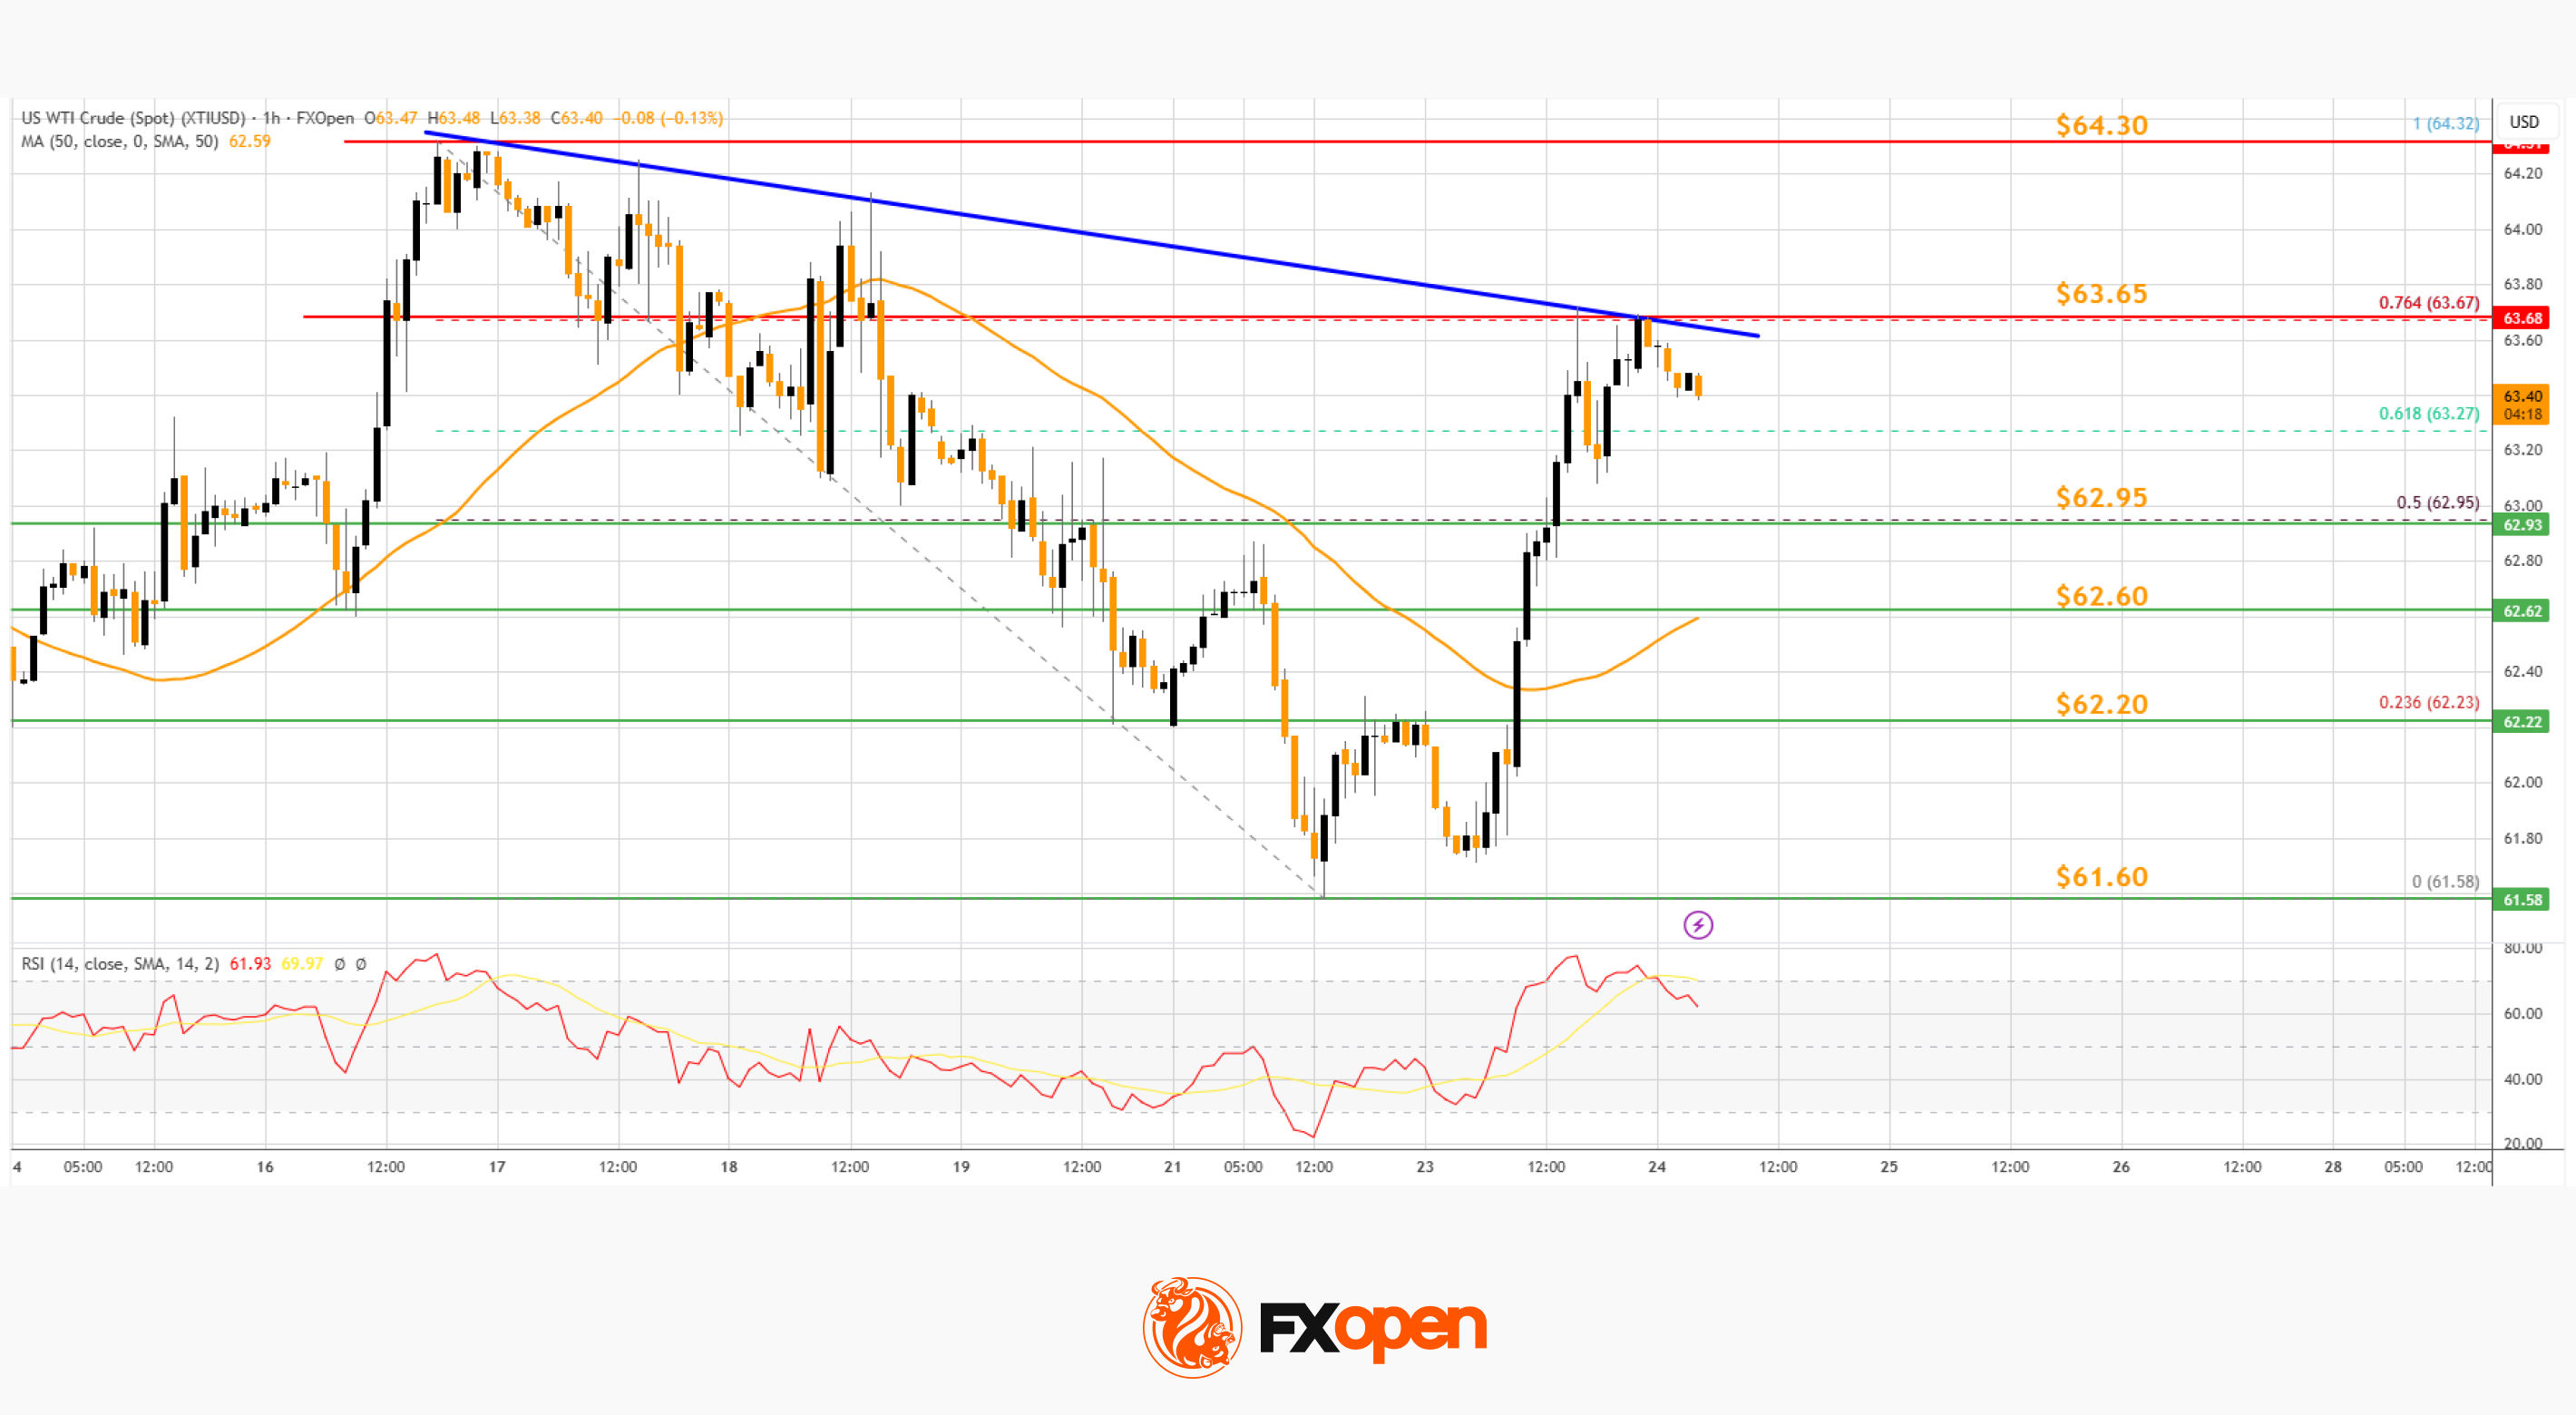
On the hourly chart of WTI Crude Oil at FXOpen, the price found support near $61.60 against the US Dollar. The price formed a base and started a recovery wave above $62.60 and the 50-hour simple moving average.
The bulls were able to push the price above the 50% Fib retracement level of the downward move from the $64.32 swing high to the $61.58 swing low. The hourly RSI is above the 60 level, but the price is struggling near $63.65.
Besides, there is a major bearish trend line in place with resistance near $63.65. It coincides with the 76.4% Fib retracement. A close above the trend line resistance might send the price toward the $64.32 high.
The next hurdle could be $65.00. A clear move above $65.00 could send the price toward $66.25. Any more gains might open the doors for a test of $68.00.
Conversely, the price might start a fresh decline from $63.65. Immediate support sits near $62.95. The key breakdown zone on the WTI crude oil chartmight be $62.60 and the 50-hour simple moving average.
If there is a downside break, the price might decline toward $62.60. Any more losses might encourage the bears for a push toward the $61.58 low.
Start trading commodity CFDs with tight spreads (additional fees may apply). Open your trading account now or learn more about trading commodity CFDs with FXOpen.
This article represents the opinion of the Companies operating under the FXOpen brand only. It is not to be construed as an offer, solicitation, or recommendation with respect to products and services provided by the Companies operating under the FXOpen brand, nor is it to be considered financial advice.
Stay ahead of the market!
Subscribe now to our mailing list and receive the latest market news and insights delivered directly to your inbox.


Latest articles

Tesla (TSLA) Shares Surge Following Musk’s Announcements
According to the chart, Tesla (TSLA) shares had been under significant pressure since the start of 2026: from their December high, they had lost around 25% of their value. The main bearish drivers included:
→ Intense competition from Chinese automakers, particularly

XTI/USD Analysis: WTI Oil Prices Under Pressure from Trump’s Statements
Yesterday, following a false bullish breakout above the psychological $100 level, WTI crude prices fell sharply towards the $85 area. The primary driver of this rapid decline was comments made by the US President.
According to Donald Trump:
→ the United
