


FXOpen

Gold price corrected gains, traded below $4,000, and started a consolidation. Crude oil is showing bearish signs and might decline below $58.80.
Important Takeaways for Gold and WTI Crude Oil Prices Analysis Today
· Gold price started a downside correction below $4,100 and $4,000 against the US Dollar.
· A key bullish trend line is forming with support at $3,985 on the hourly chart of gold at FXOpen.
· Crude oil prices failed to clear the $61.20 region and started a fresh decline.
· There is a bearish trend line forming with resistance at $60.00 on the hourly chart of XTI/USD at FXOpen.
Gold Price Technical Analysis
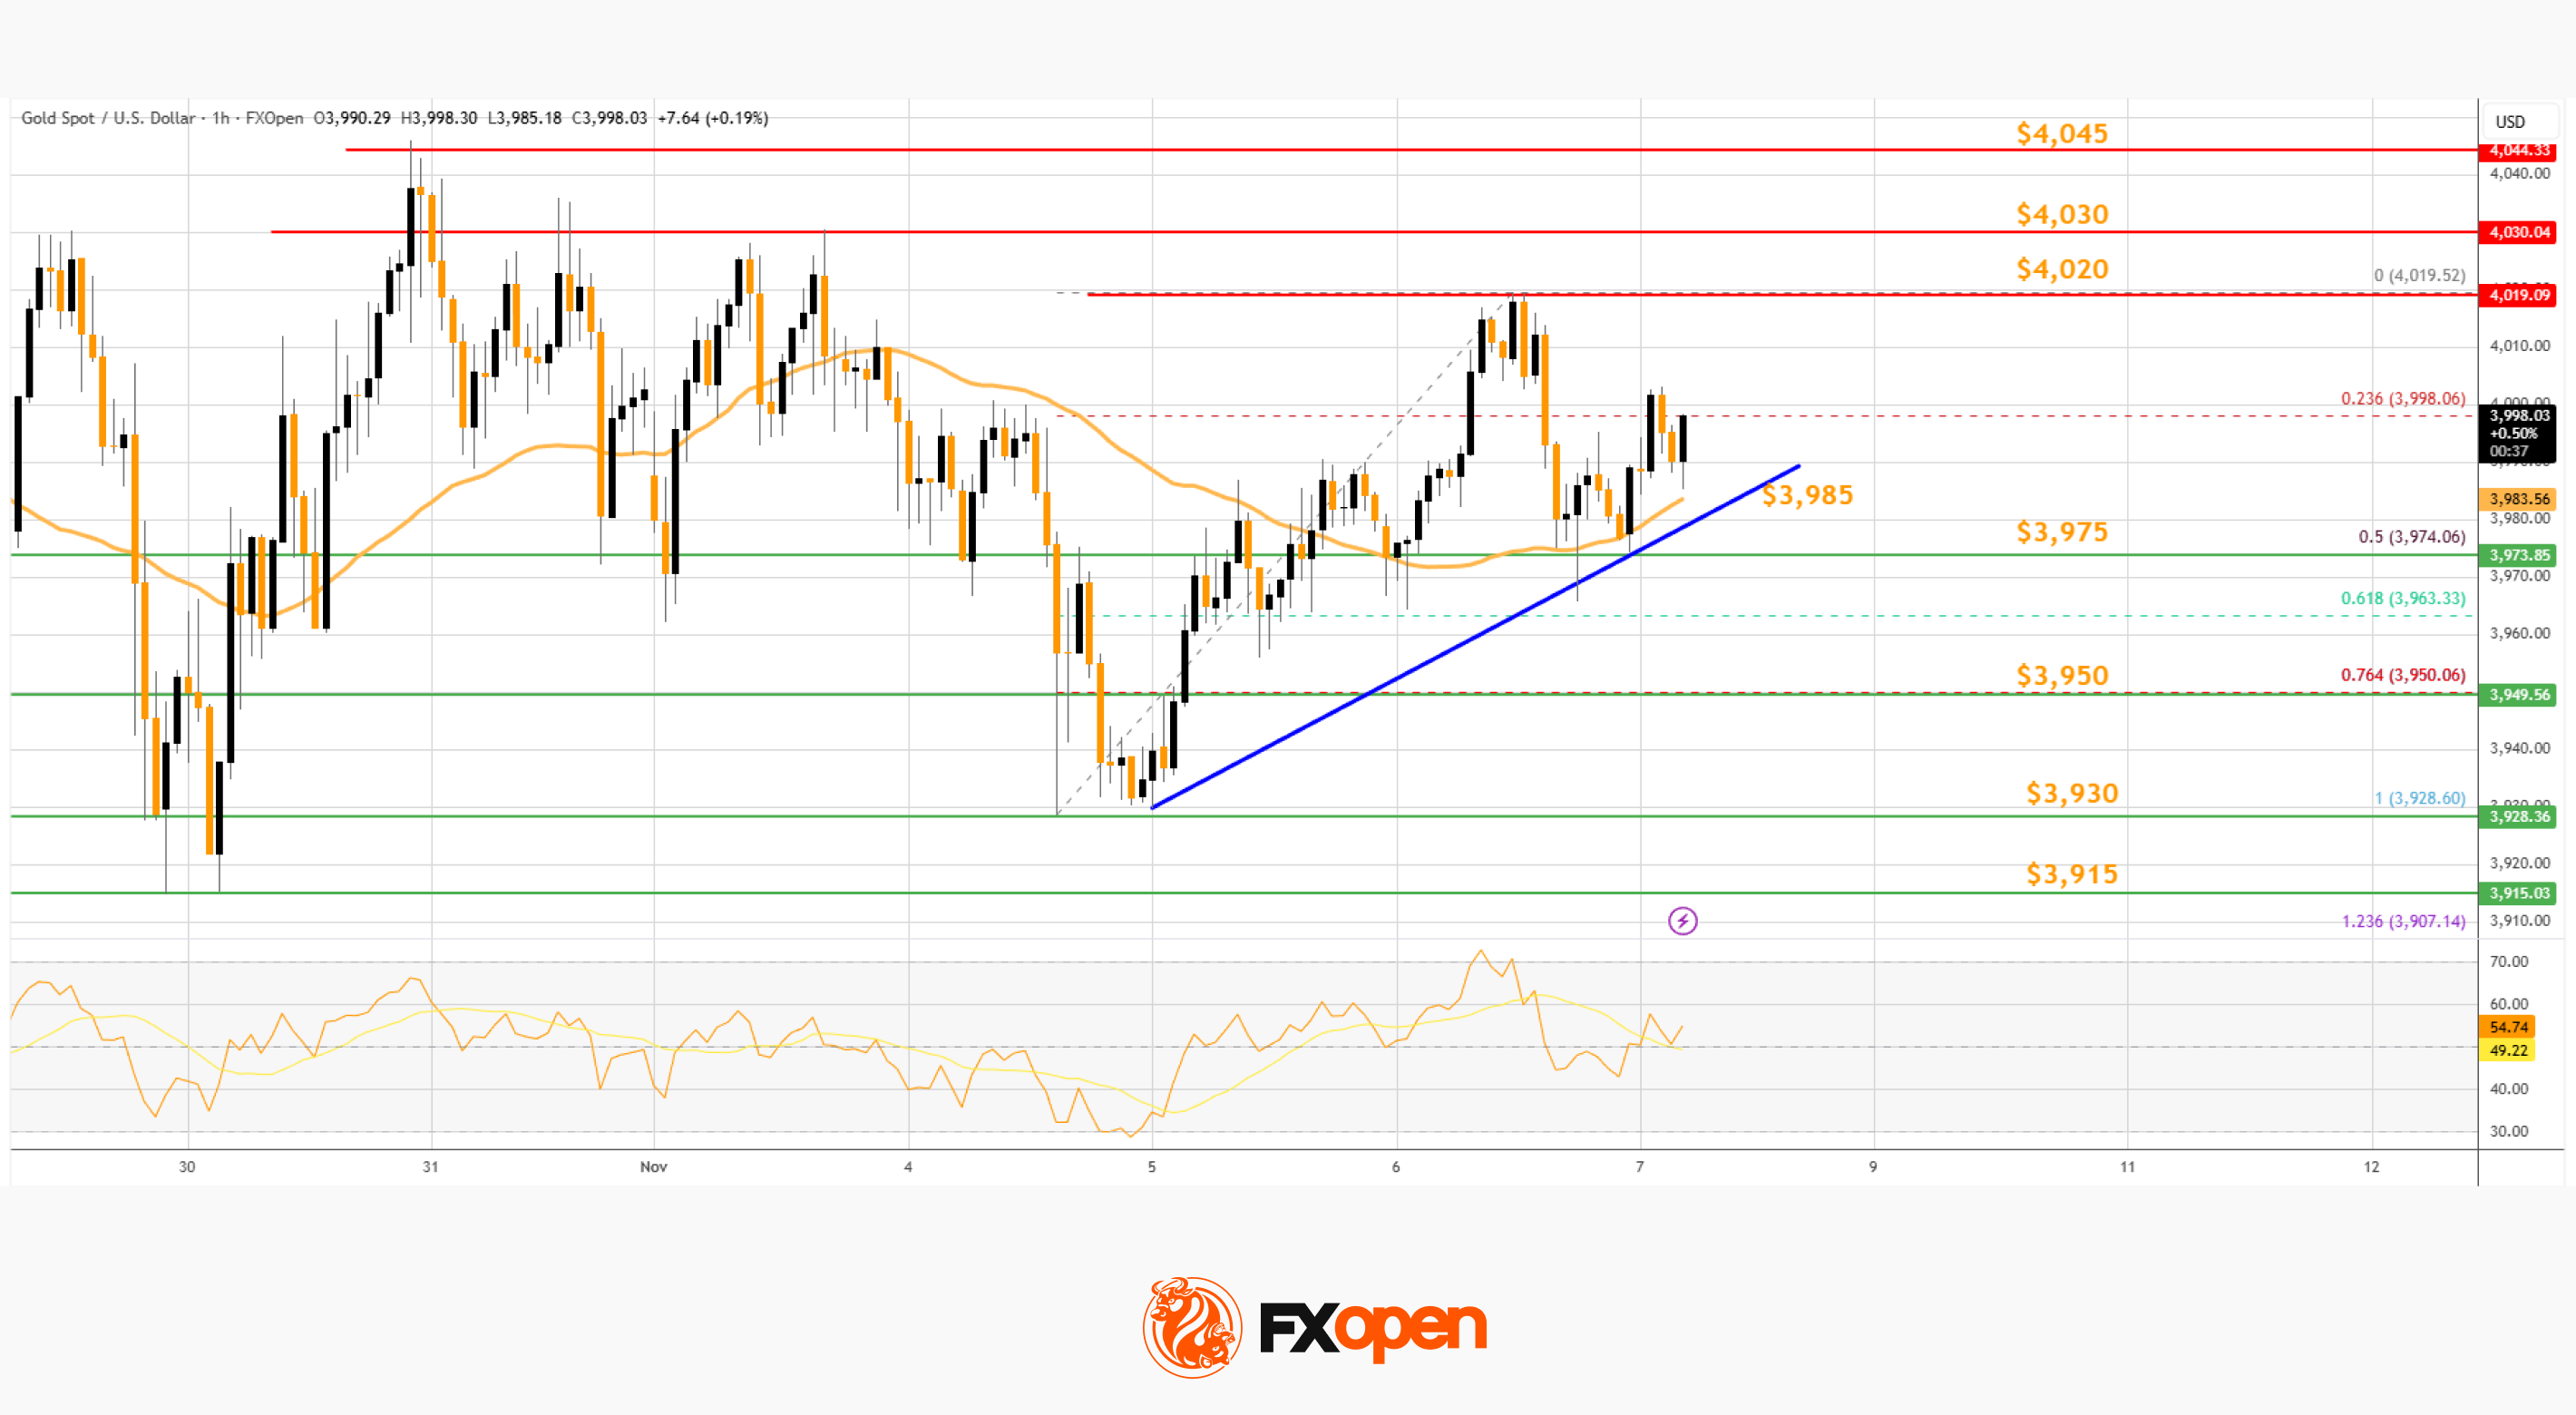
On the hourly chart of Gold at FXOpen, the price formed a base above $3,915. The price remained in a bullish zone and started an upward move within a range above $3,930.
There was a decent move above the 50-hour simple moving average and $3,975. The bulls pushed the price above the $4,000 and $4,010 resistance levels. A high was formed at $4,019 before the price saw a pullback.
The price dipped below the 23.6% Fib retracement level of the upward move from the $3,928 swing low to the $4,019 high, and the RSI declined below 50. Initial support on the downside is near $3,985, a bullish trend line, and the 50-hour simple moving average.
The first major area of interest for the bulls is near the 50% Fib retracement at $3,975. If there is a downside break below $3,975, the price might decline further. In the stated case, the price might drop toward $3,950. Any more losses might push the price toward $3,930.
Immediate resistance is near $4,020. The next major hurdle for the bulls is $4,030. An upside break above $4,030 could send Gold price toward $4,045. Any more gains may perhaps set the pace for an increase toward $4,090.
WTI Crude Oil Price Technical Analysis
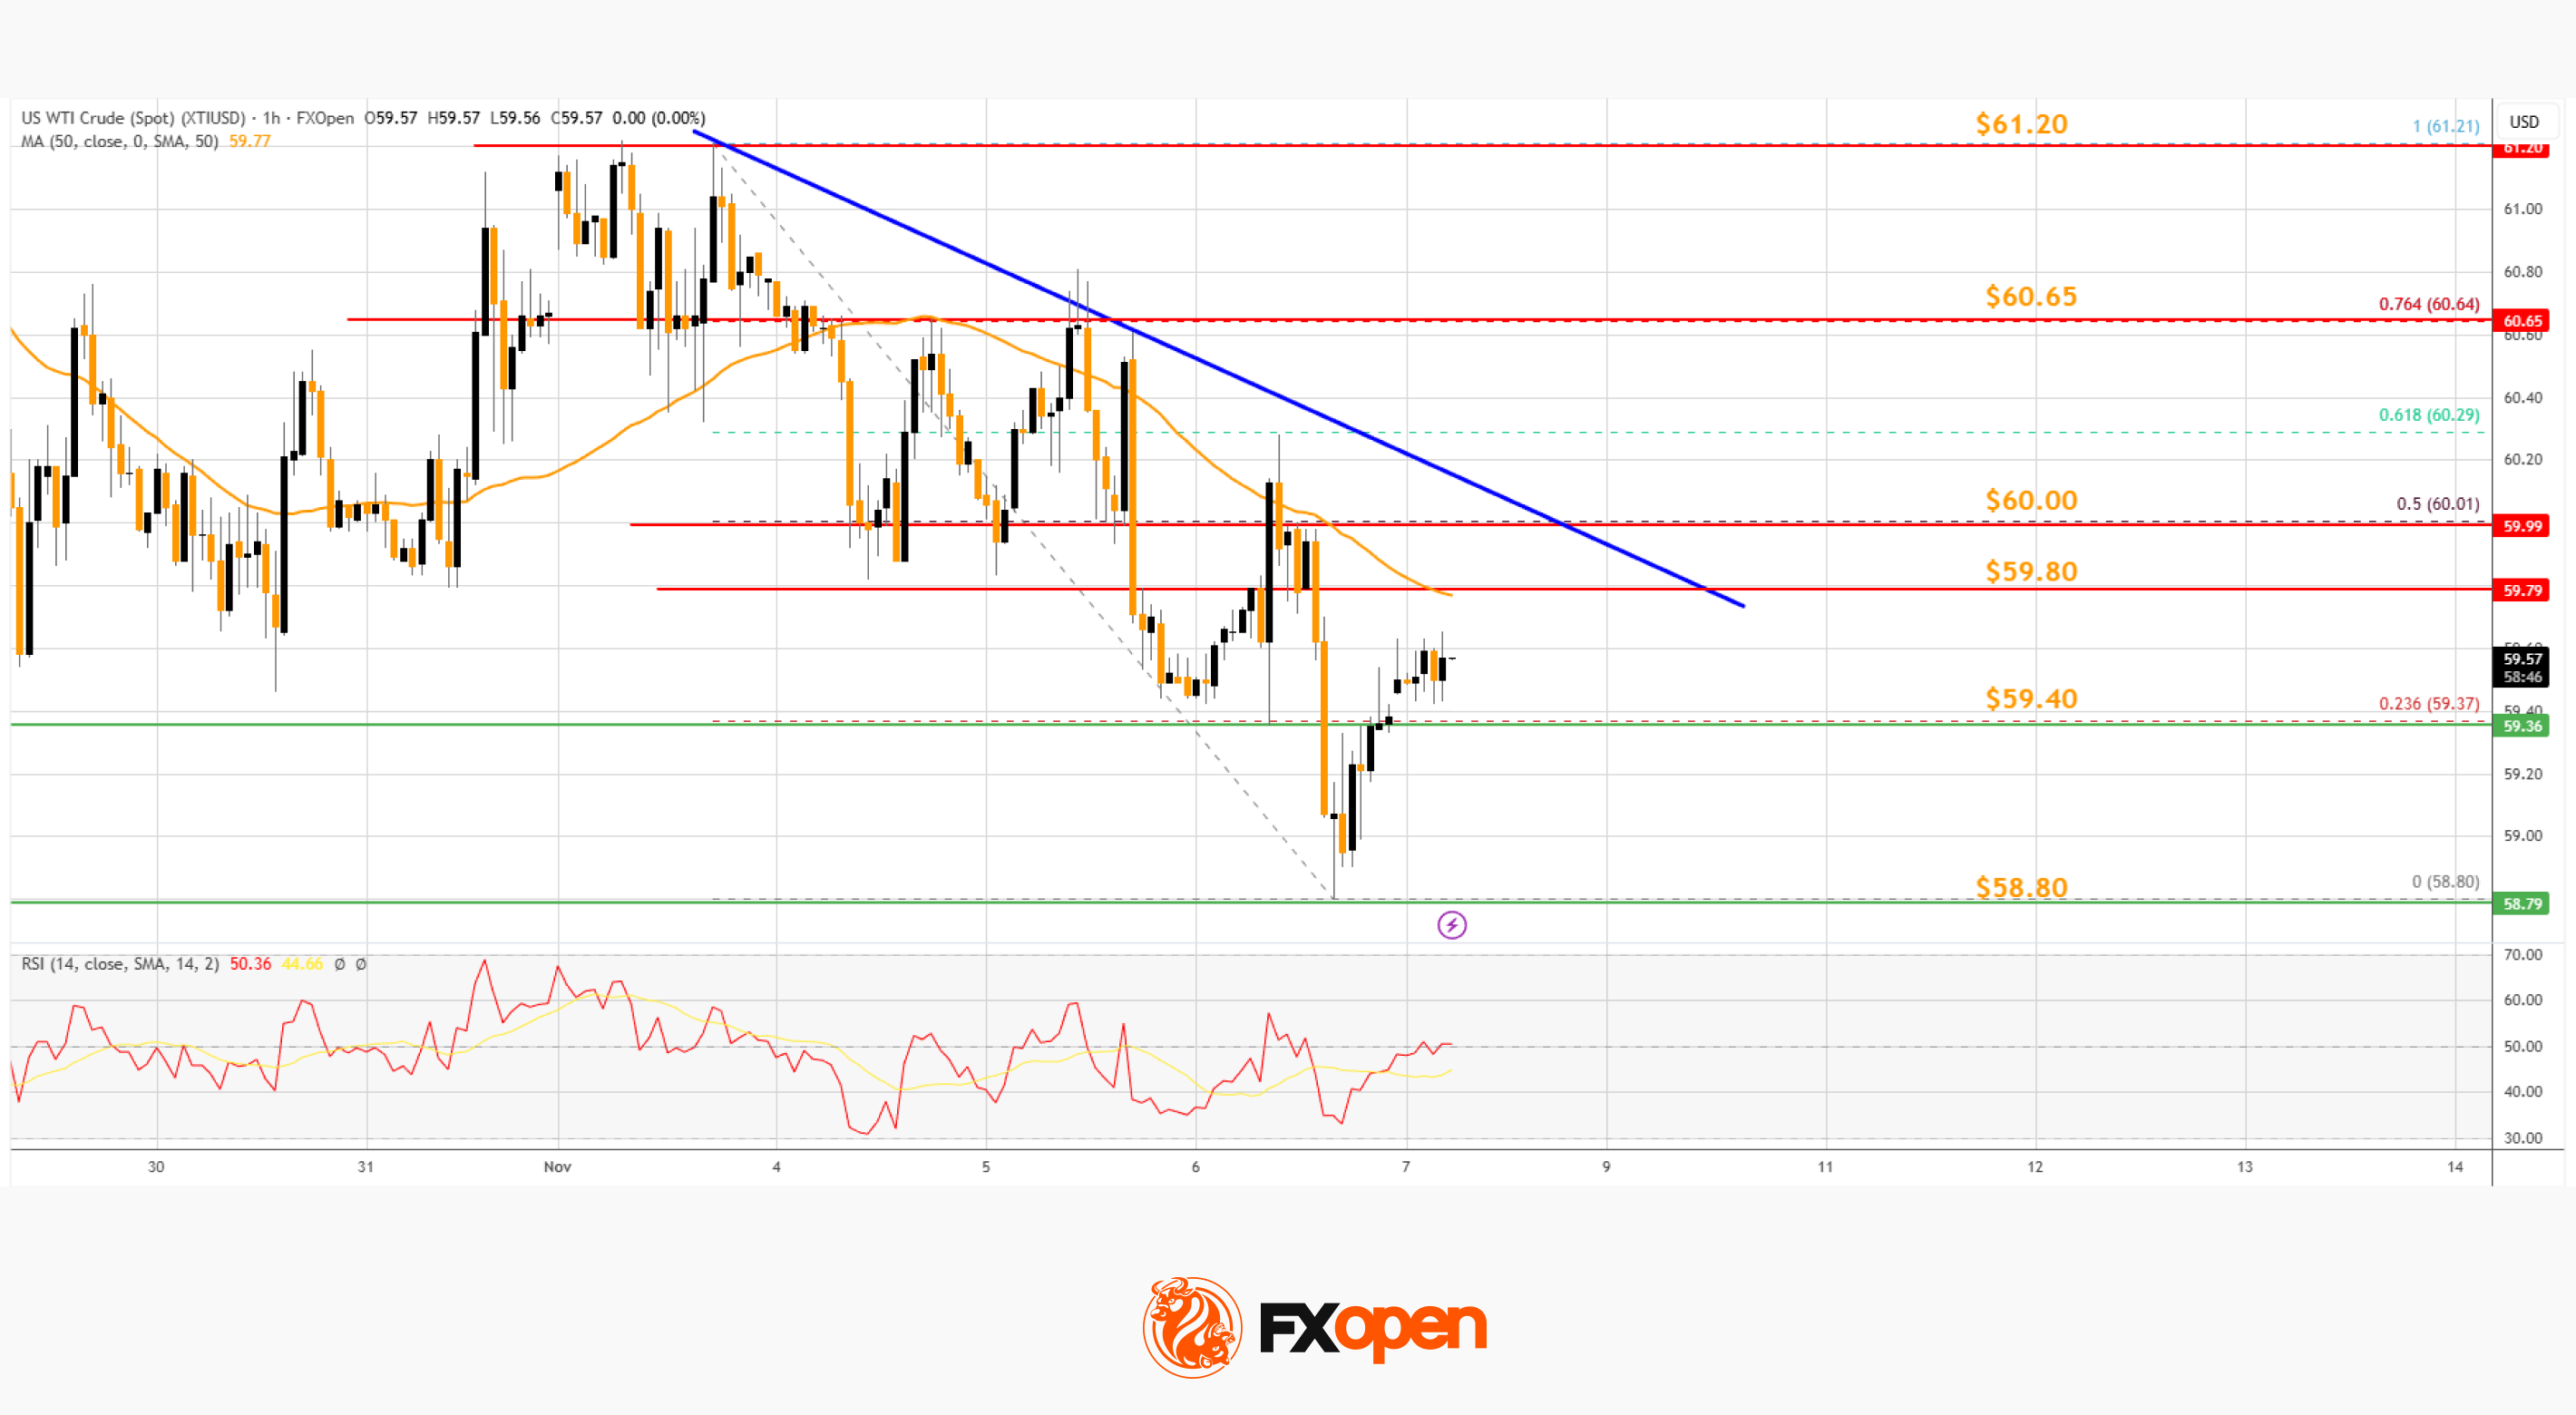
On the hourly chart of WTI Crude Oil at FXOpen, the price struggled to clear $61.20 against the US Dollar. The price started a fresh decline below $60.00.
The bears gained strength and pushed the price below $59.50 and the 50-hour simple moving average. Finally, the price tested $58.80 and recently started a recovery wave. There was a move above $59.40, and the 23.6% Fib retracement level of the downward move from the $61.21 swing high to the $58.80 low.
The bears are now active below $59.80. If there is a fresh increase, the price could face a barrier near $60.00. There is also a bearish trend line forming with resistance at $60.00.
The first major resistance is near the 76.4% Fib retracement at $60.65. The next stop for the bulls could be near $61.20. Any more gains might send the price toward $62.00. Conversely, the price might start another decline and test $59.40.
The next major area of interest for the bulls on the WTI crude oil chart is $58.80. If there is a downside break, the price might decline toward $57.50. Any more losses may perhaps open the doors for a move toward $55.00.
Start trading commodity CFDs with tight spreads (additional fees may apply). Open your trading account now or learn more about trading commodity CFDs with FXOpen.
This article represents the opinion of the Companies operating under the FXOpen brand only. It is not to be construed as an offer, solicitation, or recommendation with respect to products and services provided by the Companies operating under the FXOpen brand, nor is it to be considered financial advice.
Stay ahead of the market!
Subscribe now to our mailing list and receive the latest market news and insights delivered directly to your inbox.


Latest articles

Tesla (TSLA) Shares Surge Following Musk’s Announcements
According to the chart, Tesla (TSLA) shares had been under significant pressure since the start of 2026: from their December high, they had lost around 25% of their value. The main bearish drivers included:
→ Intense competition from Chinese automakers, particularly

XTI/USD Analysis: WTI Oil Prices Under Pressure from Trump’s Statements
Yesterday, following a false bullish breakout above the psychological $100 level, WTI crude prices fell sharply towards the $85 area. The primary driver of this rapid decline was comments made by the US President.
According to Donald Trump:
→ the United
