


The US Dollar Index (DXY) Climbs to a One-and-a-Half-Month High
FXOpen
Today, the US Dollar Index rose above the 98.70 level for the first time since the third week of January. Monday’s trading opened with a bullish gap, and upward momentum continues to build as news emerges of a major escalation in the Middle East:
→ Demand for safe-haven assets: Historically, the US dollar and US Treasury bonds have served as primary refuges for capital during periods of heightened uncertainty.
→ Military activity around the Strait of Hormuz is pushing oil prices higher (WTI jumped by approximately 10% yesterday) along with gas prices. This creates a direct pathway to another wave of global inflation.
Technical Analysis of the DXY Chart
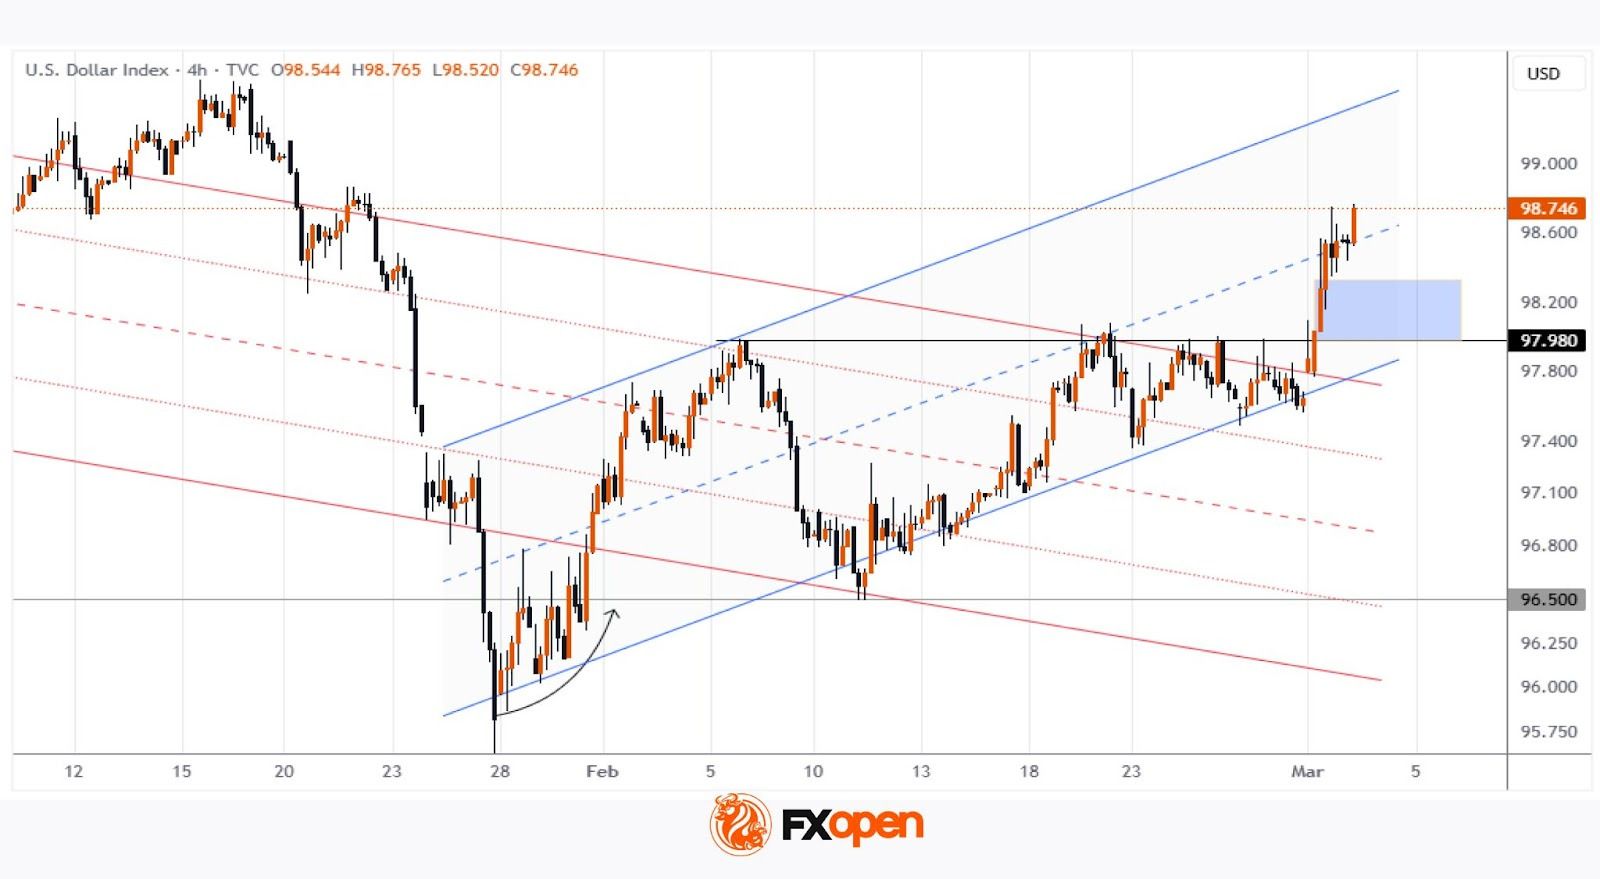
Six days ago, when analysing the US Dollar Index (DXY) chart, we:
→ Reaffirmed the validity of the descending channel (marked in red), which originated in November 2025.
→ Once again highlighted the strength of demand, reflected in the confident upward trajectory (shown by the arrow) following the false break below the multi-month low of 96.50 at the end of January.
→ Suggested that bulls could regain momentum and break the prevailing downtrend.
Indeed, price action in early March confirms this view: the descending channel is losing relevance, being replaced by an upward trajectory marked in blue. In this context, developments in the Middle East are of critical importance:
→ If tensions begin to ease, the DXY may stabilise around the median line of the blue ascending channel.
→ A renewed escalation and the collapse of potential negotiations could trigger a further advance towards the upper boundary of the blue channel.
It is also worth noting that the area around the 98 level may now serve as support:
→ This zone previously saw rapid price appreciation, signalling strong buying pressure.
→ It was also the point of a bullish breakout from the red channel and above the 97.98 resistance level.
Trade global index CFDs with zero commission and tight spreads (additional fees may apply). Open your FXOpen account now or learn more about trading index CFDs with FXOpen.
This article represents the opinion of the Companies operating under the FXOpen brand only. It is not to be construed as an offer, solicitation, or recommendation with respect to products and services provided by the Companies operating under the FXOpen brand, nor is it to be considered financial advice.
Stay ahead of the market!
Subscribe now to our mailing list and receive the latest market news and insights delivered directly to your inbox.


Latest articles

CAD/JPY: The Yen's Most Historic Move in 30 Years Meets a Fragile Support
Two central banks are heading in genuinely opposite directions this week, and the tension is unmistakable. The Bank of Canada held rates steady at 2.25% on September 2, with a mildly hawkish tilt as policymakers acknowledged a broadening economic

USD/JPY and USD/CAD Await Key Fed Decision
The US dollar is consolidating against the yen and Canadian dollar ahead of the key event of the week — the Federal Reserve meeting. The Fed is widely expected to raise its policy rate by 25 basis points to a range

UnitedHealth: Fundamentals Are Healing, Now the Chart Must Agree
UnitedHealth finds itself in a genuinely split narrative right now, trading near $388, down about 15.9% from its 52-week high, even as the fundamental picture keeps improving. Q2 earnings beat expectations, with revenue of $112.03 billion, and the