


FXOpen

AUD/USD is attempting a recovery wave from 0.6285. NZD/USD is also rising and facing a major hurdle near the 0.5980 level.
Important Takeaways for AUD/USD and NZD/USD Analysis Today
· The Aussie Dollar found support near 0.5870 and is now recovering against the US Dollar.
· There is a key rising channel forming with resistance near 0.6385 on the hourly chart of AUD/USD at FXOpen.
· NZD/USD is attempting a recovery wave above the 0.5930 resistance.
· There is a major bullish trend line forming with support near 0.5950 on the hourly chart of NZD/USD at FXOpen.
AUD/USD Technical Analysis
On the hourly chart of AUD/USD at FXOpen, the pair recovered above 0.6450. However, the Aussie Dollar failed to clear 0.6500 and started a fresh decline against the US Dollar.
The pair declined below the 0.6385 support. Finally, the bulls appeared near the 0.6285 zone. A low was formed near 0.6285 and the pair is now correcting losses. There was a move above the 23.6% Fib retracement level of the downward move from the 0.6500 swing high to the 0.6285 low.
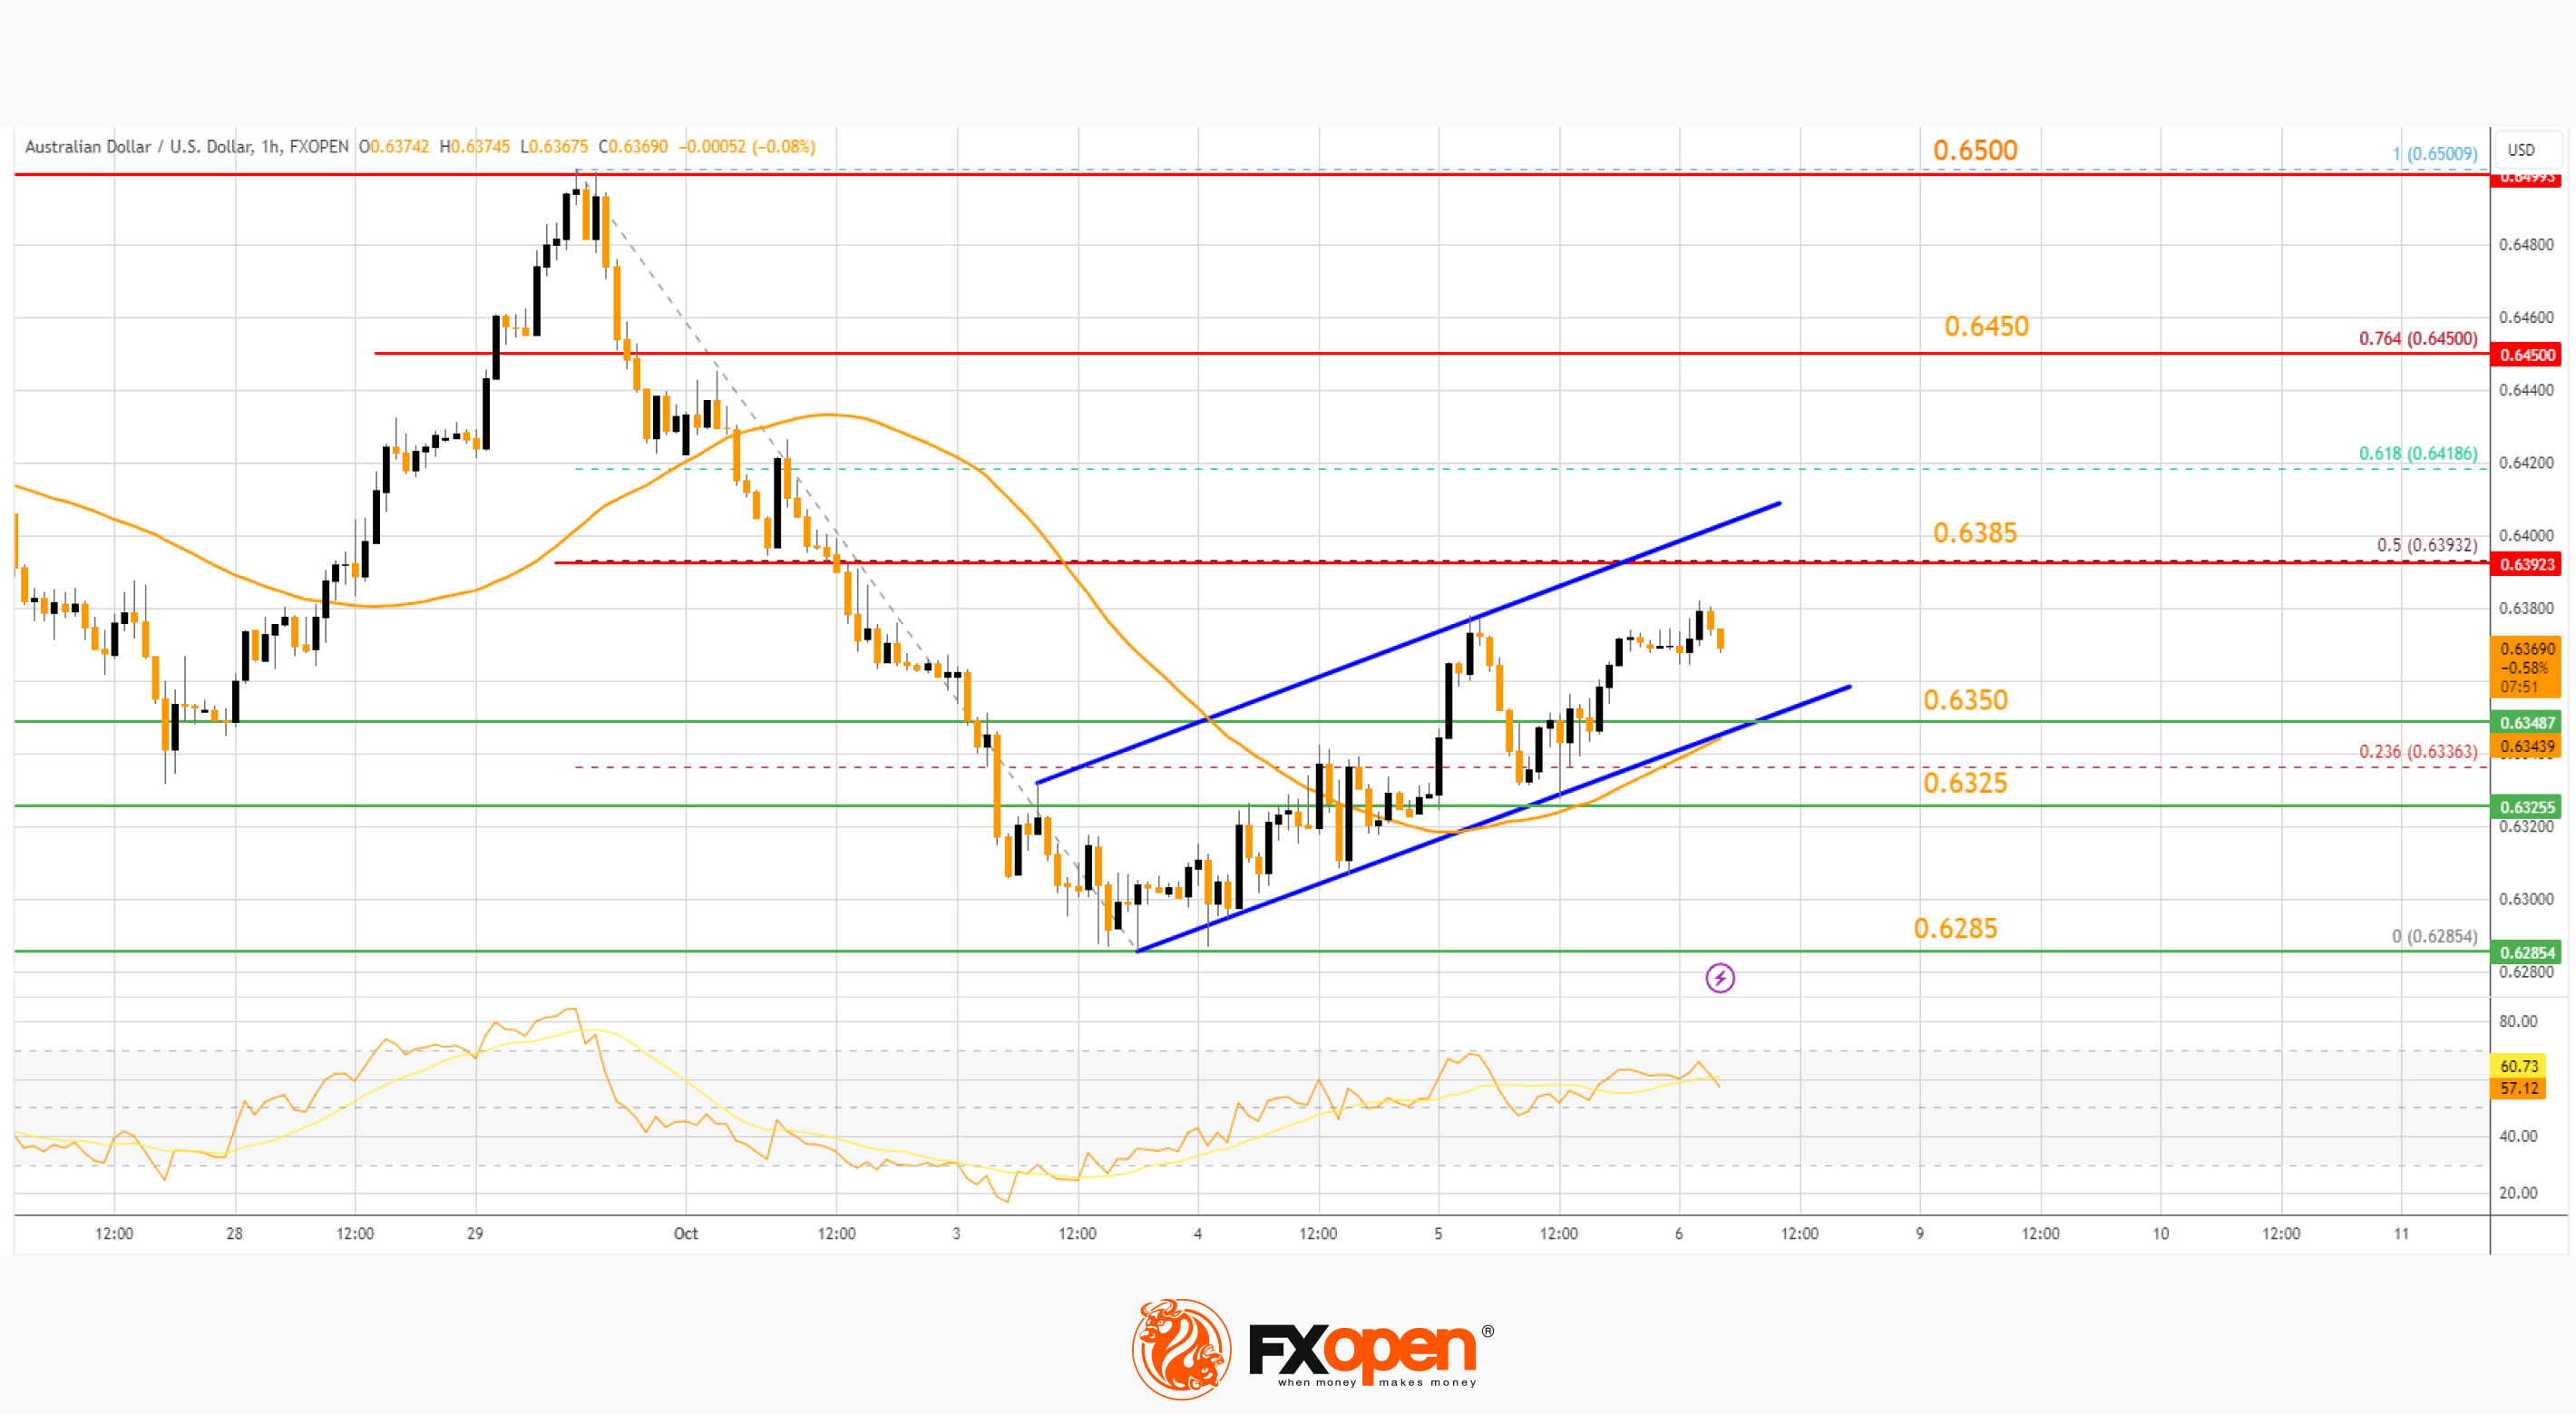
The pair is now above 0.6350 and the 50-hour simple moving average. On the upside, an immediate resistance is near the 50% Fib retracement level of the downward move from the 0.6500 swing high to the 0.6285 low at 0.6385.
The first major resistance is near a rising channel at 0.6450. A clear upside break above 0.6450 could send the pair toward 0.6500. The next major resistance on the AUD/USD chart is near 0.6550, above which the price could rise toward 0.6620. Any more gains might send the pair toward 0.6650.
On the downside, initial support is near the channel trend line at 0.6350. The next support could be the 0.6325. Any more losses might send the pair toward the 0.6285 support.
NZD/USD Technical Analysis
On the hourly chart of NZD/USD on FXOpen, the pair also followed a similar pattern and declined from the 0.6050 zone. The New Zealand Dollar gained bearish momentum and traded below 0.5950 against the US Dollar.
The pair even dropped below the 50-hour simple moving average and tested 0.5875. A low was formed near 0.5870 and the pair is now attempting a fresh increase. It is back above the 0.5930 level and the 50-hour simple moving average.
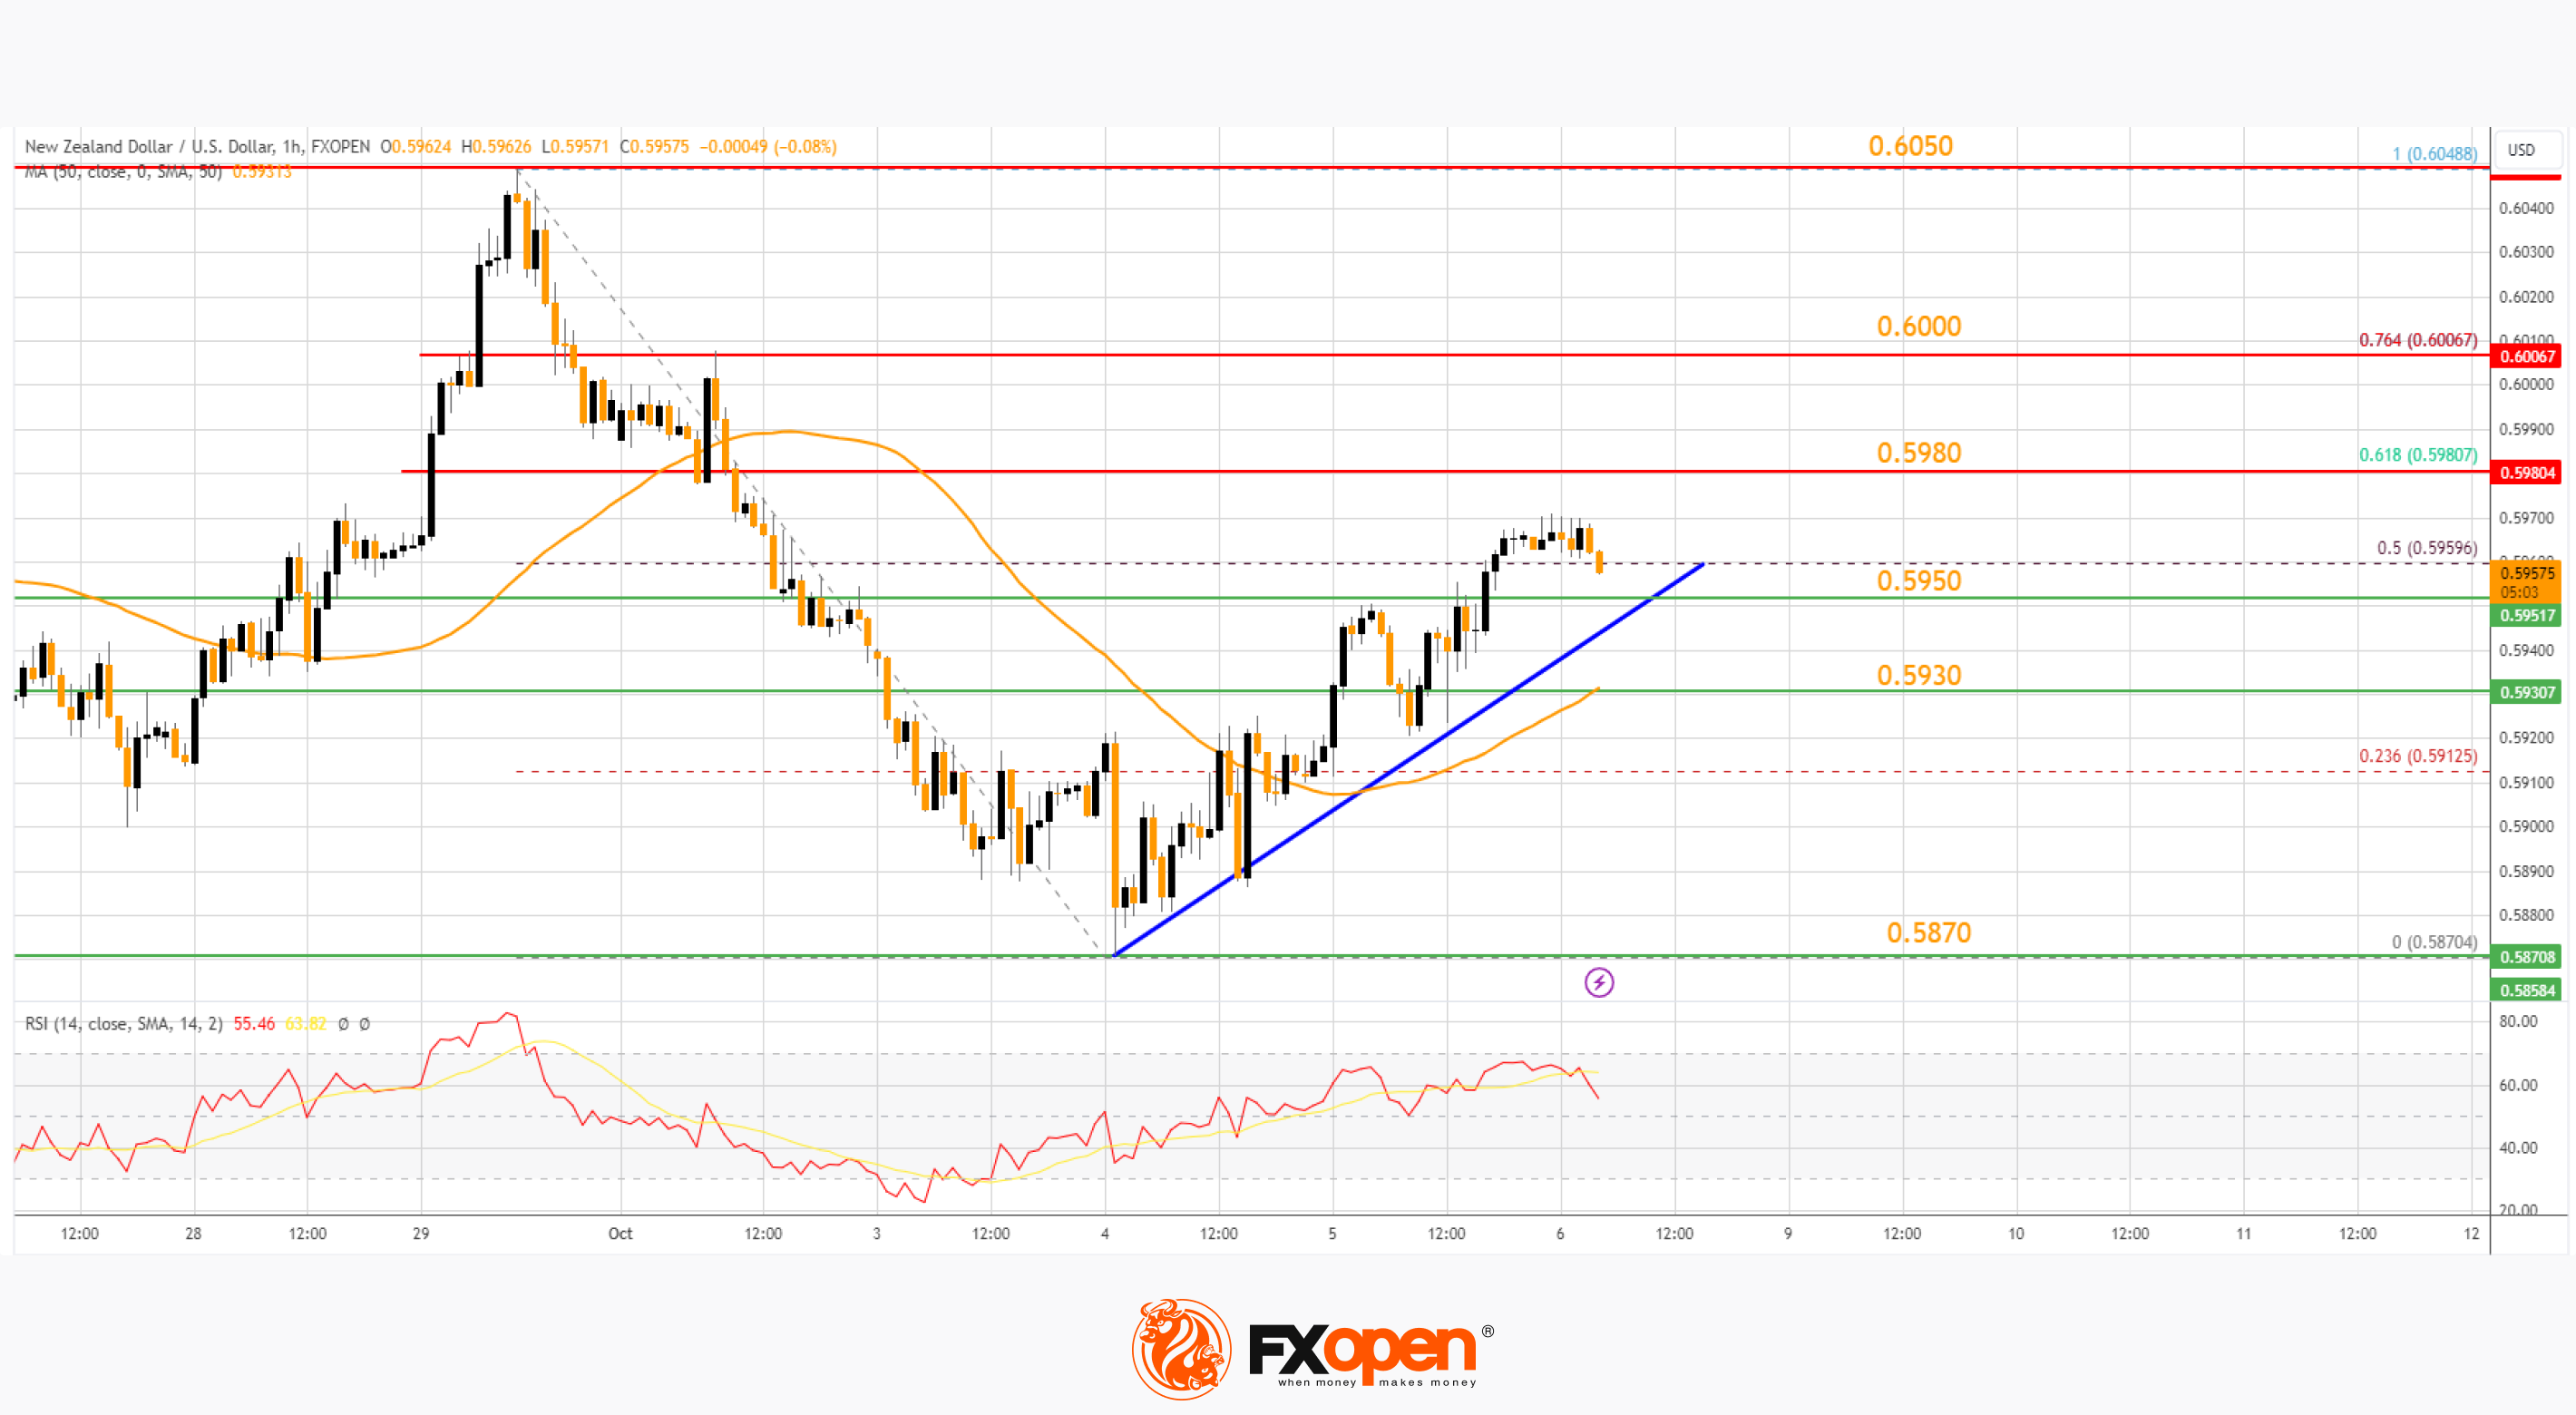
It is now consolidating to clear the 50% Fib retracement level of the downward move from the 0.6048 swing high to the 0.5870 low. There is also a major bullish trend line forming with support near 0.5950.
On the upside, the pair is facing resistance near the 61.8% Fib retracement level of the downward move from the 0.6048 swing high to the 0.5870 low at 0.5980. The next major resistance is near 0.6000. If there is a move above 0.6000, the pair could rise toward the 0.6050 resistance.
Any more gains might open the doors for a move toward the 0.6120 resistance zone. On the downside, immediate support on the NZD/USD chart is near 0.5950.
The next major support is near the 0.5930 zone. If there is a downside break below 0.5930, the pair could extend the decline toward the 0.5870 level. The next key support is near 0.5820.
Trade over 50 forex markets 24 hours a day with FXOpen. Take advantage of low commissions, deep liquidity, and spreads from 0.0 pips (additional fees may apply). Open your FXOpen account now or learn more about trading forex with FXOpen.
This article represents the opinion of the Companies operating under the FXOpen brand only. It is not to be construed as an offer, solicitation, or recommendation with respect to products and services provided by the Companies operating under the FXOpen brand, nor is it to be considered financial advice.
Stay ahead of the market!
Subscribe now to our mailing list and receive the latest market news and insights delivered directly to your inbox.


Latest articles

EUR/USD Chart Analysis: Pair Recovers Ahead of Fed News
On 10 March, analysing the EUR/USD chart, we:
→ considered the long-term descending channel, which remains relevant;
→ noted that the sequence of lower lows A–H was broken with the appearance of a higher peak I, with 1.1680 potentially

Nvidia (NVDA) Shares Set a March High
Nvidia shares experienced heightened volatility yesterday, with the price jumping to a March high during the Nvidia GTC 2026 conference, where Jensen Huang made several major announcements. According to media reports:
→ Nvidia unveiled a next-generation platform named after the astronomer

XTI/USD Chart Analysis: WTI Oil Price Fluctuates Near $100
For the third Monday in a row, trading in the oil market has opened with a bullish gap, although this time it is not as wide as the gap seen, for example, on 9 March. The reason for the volatility