


XTI/USD Chart Analysis: WTI Oil Price Fluctuates Near $100
FXOpen

For the third Monday in a row, trading in the oil market has opened with a bullish gap, although this time it is not as wide as the gap seen, for example, on 9 March. The reason for the volatility is clear — the ongoing military conflict in the Middle East, with no visible signs of de-escalation so far.
According to the latest media reports:
→ the Strait of Hormuz remains effectively closed;
→ over the weekend the United States struck Iran’s Kharg Island, a key hub for the country’s oil export infrastructure;
→ Iran launched an attack on the oil port of Fujairah in the UAE.
Technical Analysis of XTI/USD
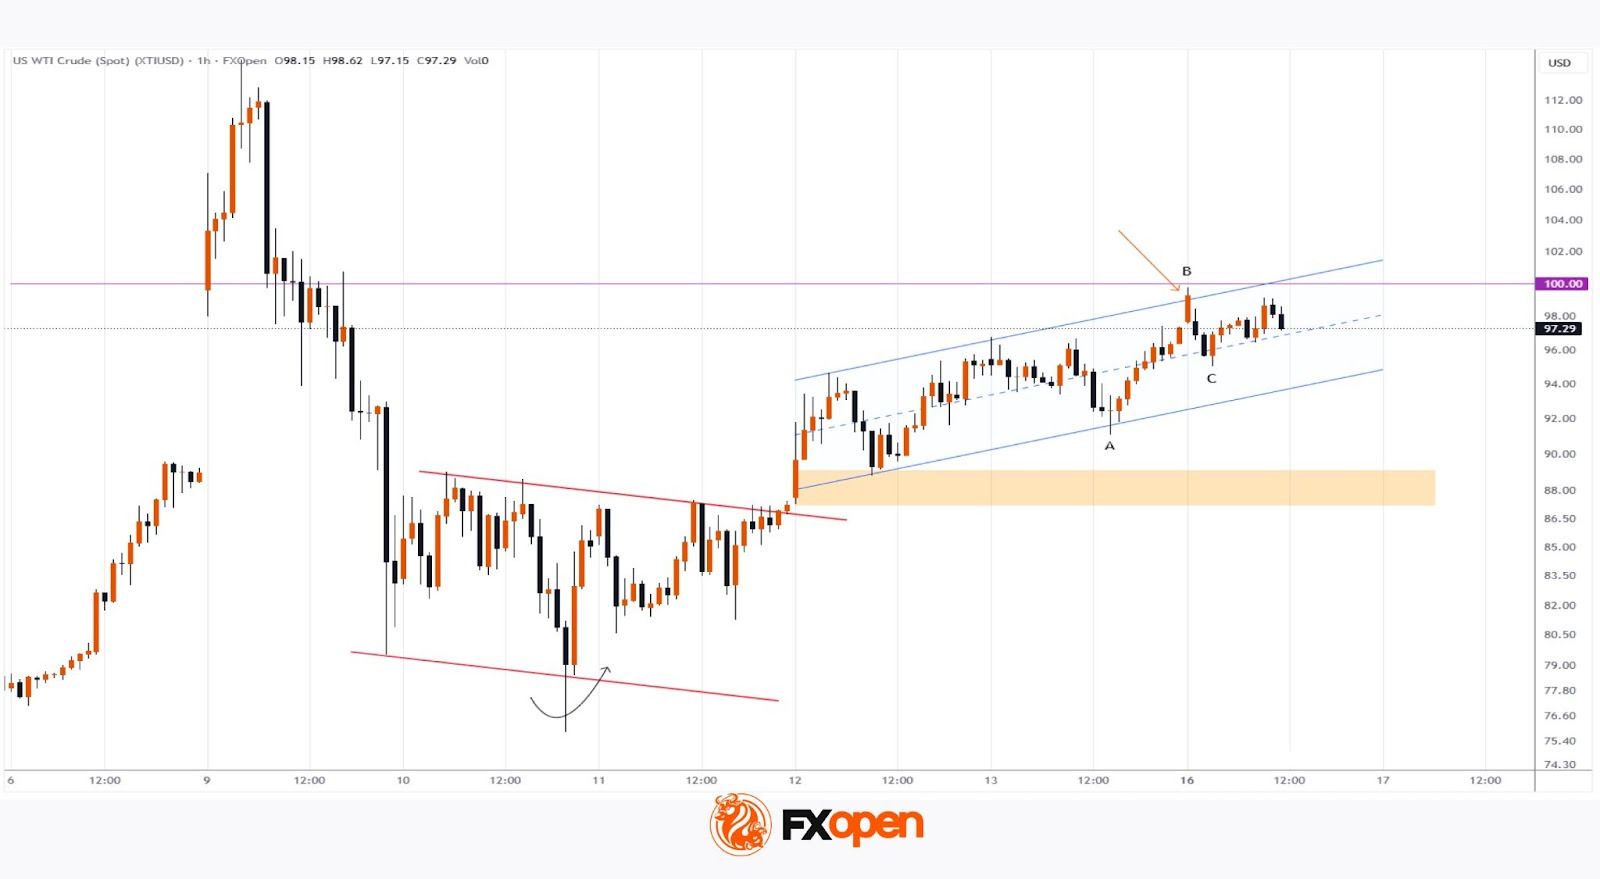
While analysing WTI price movements on 11 March, we:
→ identified a local descending channel (shown with red lines);
→ highlighted a sharp reversal on 10 March (marked with an arrow).
Since then, buying pressure has continued to strengthen, largely driven by developments in the Middle East. As a result:
→ the local descending channel was broken to the upside;
→ the breakout zone later acted as support;
→ the XTI/USD chart formed the structure for an ascending channel (shown in blue).
At present, the market retains a bullish bias. For instance, the pullback from B to C represents roughly a 50% retracement of the A–B impulse, while WTI prices remain close to the psychological level of $100 per barrel.
However, the candlestick structure at the market open (marked with an arrow) suggests that sellers were able to push prices lower. Therefore, even if we see an attempt to break above the $100 level in the near term, it may struggle to gain strong momentum.
Start trading commodity CFDs with tight spreads (additional fees may apply). Open your trading account now or learn more about trading commodity CFDs with FXOpen.
This article represents the opinion of the Companies operating under the FXOpen brand only. It is not to be construed as an offer, solicitation, or recommendation with respect to products and services provided by the Companies operating under the FXOpen brand, nor is it to be considered financial advice.
Stay ahead of the market!
Subscribe now to our mailing list and receive the latest market news and insights delivered directly to your inbox.


Latest articles

NZD/USD Analysis: A Tug-of-War at the Critical Level
The kiwi has strengthened meaningfully against most peers this month. However, against the US dollar specifically, NZD/USD remains well below its 2026 highs, trading in the mid-0.58 area versus January's peak near 0.6075.
New Zealand's Q2 inflation

AUD/USD and USD/CAD React to Rising Geopolitical Risks
Commodity-linked currencies remain under pressure as geopolitical tensions in the Middle East continue to escalate. The United States has maintained strikes on targets in Iran, while the Tehran-backed Houthis have intensified threats to shipping in the Red Sea and near

GBP/CHF: Trendline or RSI — Which One Is Lying?
Sterling enters this week on firmer footing, with political uncertainty fading fast after Andy Burnham's confirmation as Labour leader eased investor concerns over the succession to Keir Starmer. Markets reacted further to reports pointing to Shabana Mahmood as the frontrunner