


FXOpen
AUD/USD is showing positive signs and might climb further higher above 0.6900. NZD/USD is also rising and aiming for a move above the 0.6410 resistance zone.
Important Takeaways for AUD USD and NZD USD Analysis Today
· The Aussie Dollar started a fresh increase above the 0.6790 and 0.6845 levels against the US Dollar.
· There is a connecting bullish trend line forming with support near 0.6790 on the hourly chart of AUD/USD at FXOpen.
· NZD/USD is gaining bullish momentum above the 0.6355 support.
· There is a key bullish trend line forming with support near 0.6395 on the hourly chart of NZD/USD at FXOpen.
AUD/USD Technical Analysis
On the hourly chart of AUD/USD at FXOpen, the pair started a fresh increase from the 0.6630 support. The Aussie Dollar was able to clear the 0.6790 resistance to move into a positive zone against the US Dollar.
There was a close above the 0.6845 resistance and the 50-hour simple moving average. Finally, the pair tested the 0.6900 zone. A high is formed near 0.6894 and the pair is now consolidating gains. The AUD/USD chartindicates that the pair is now facing resistance near 0.6900.
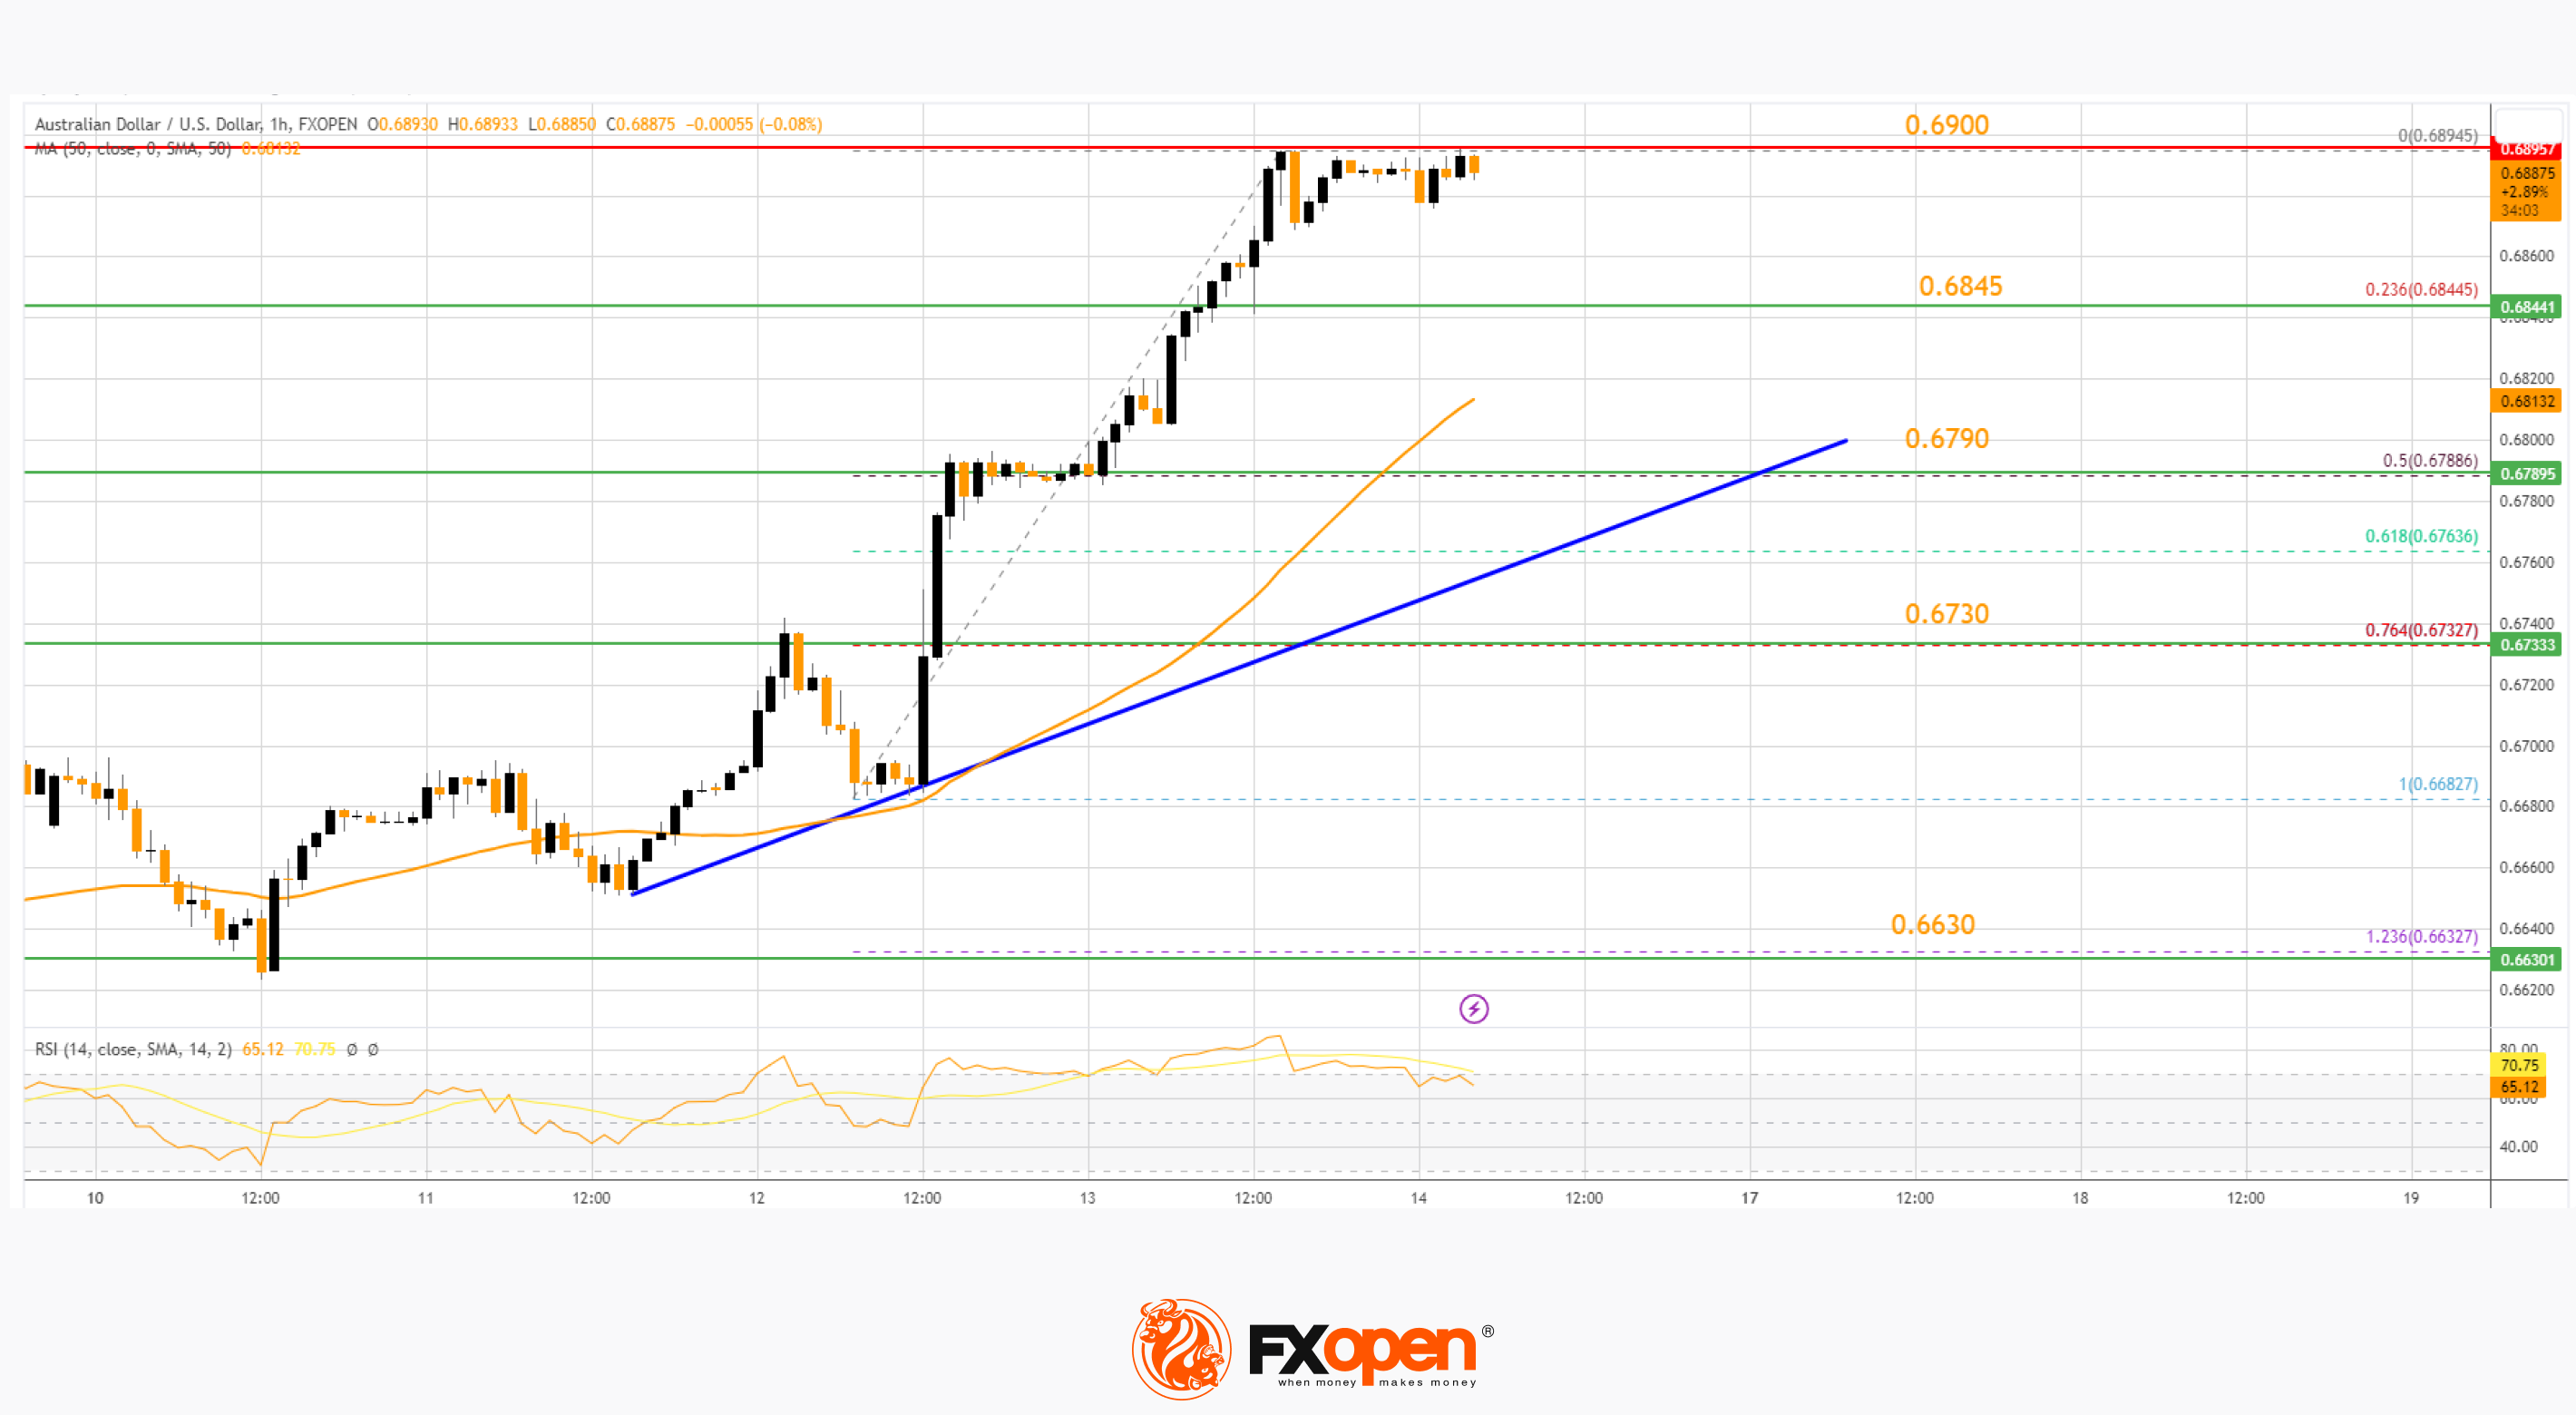
The first major resistance might be 0.6920. An upside break above the 0.6920 resistance might send the pair further higher. The next major resistance is near the 0.6945 level. Any more gains could clear the path for a move toward the 0.7000 resistance zone.
On the downside, initial support is near the 23.6% Fib retracement level of the upward move from the 0.6682 swing low to the 0.6894 high at 0.6845.
The next support could be a connecting bullish trend line at 0.6790 and the 50-hour simple moving average. It is close to the 50% Fib retracement level of the upward move from the 0.6682 swing low to the 0.6894 high.
If there is a downside break below the 0.6790 support, the pair could extend its decline toward the 0.6730 level. Any more losses might signal a move toward 0.6630.
NZD/USD Technical Analysis
On the hourly chart of AUD/USD on FXOpen, the pair started a steady increase from the 0.6180 level. The New Zealand Dollar broke the 0.6235 resistance to start the recent increase against the US Dollar.
The pair settled above 0.6320 and the 50-hour simple moving average. It tested the 0.6410 zone and is currently consolidating gains above the 23.6% Fib retracement level of the upward wave from the 0.6182 swing low to the 0.6411 high.
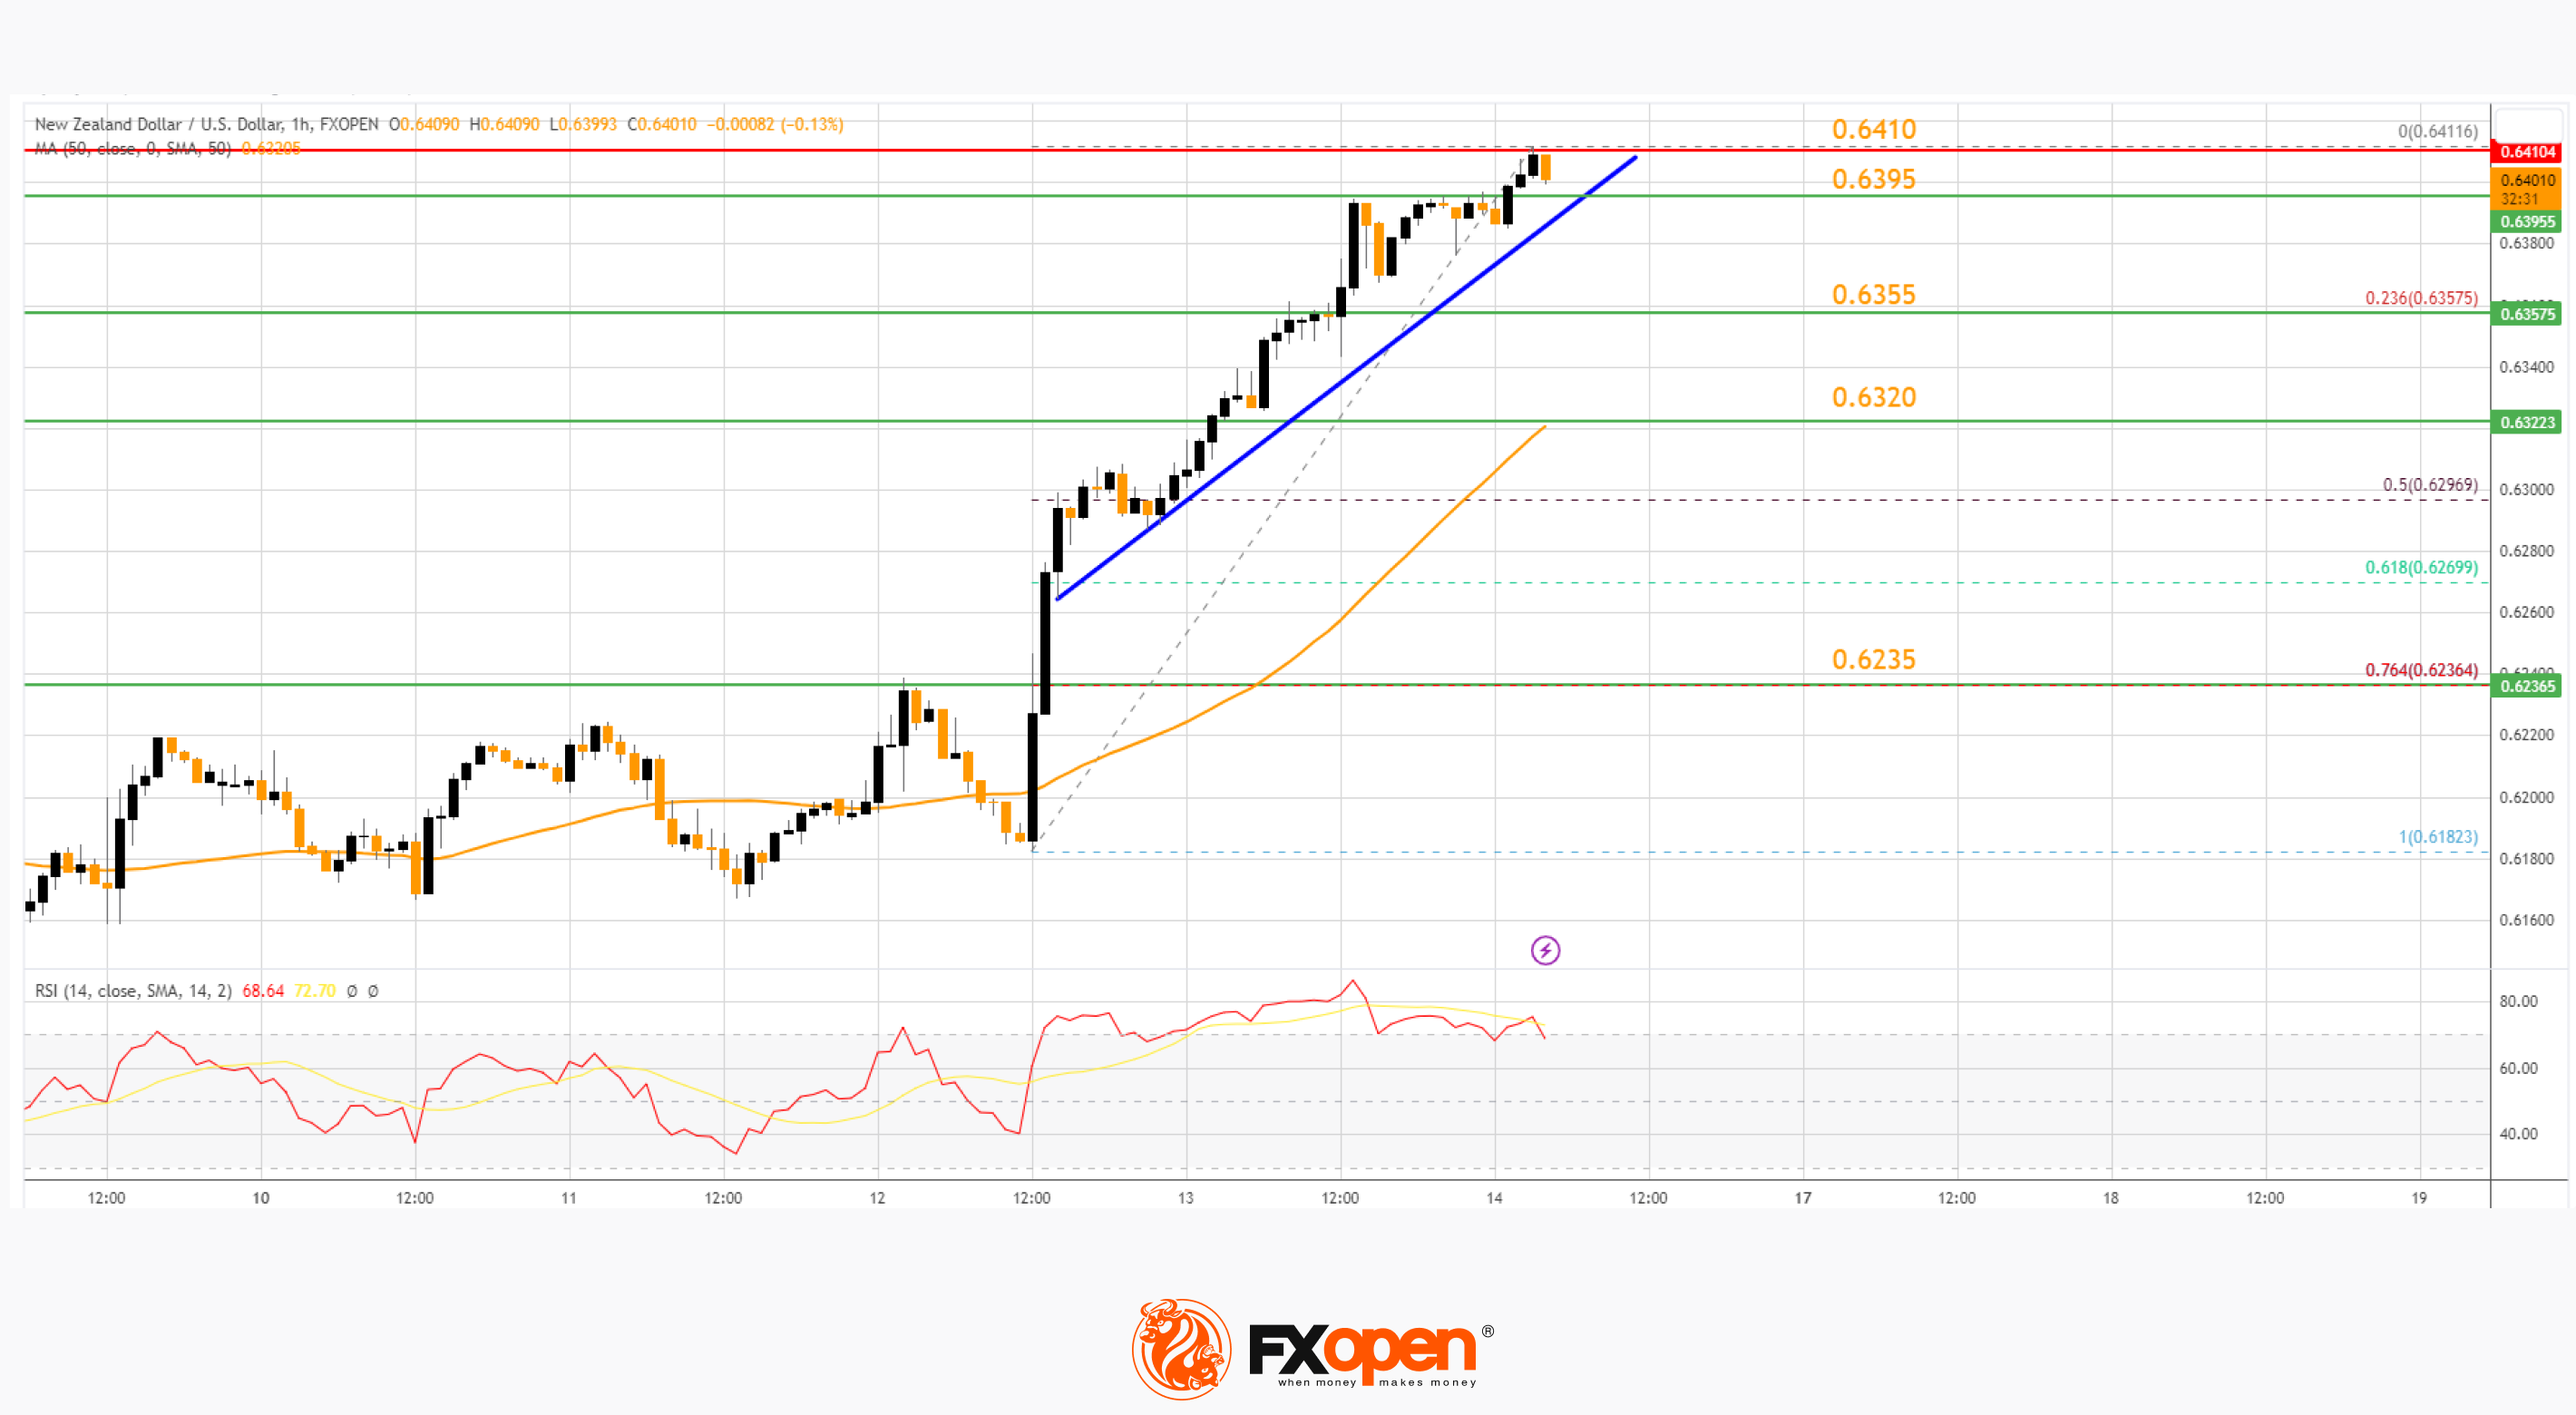
The NZD/USD chart suggests that the RSI is correcting lower and the pair might correct lower. On the downside, there is major support forming near a bullish trend line at 0.6395.
The next major support is near 0.6355, below which the pair might test the 50-hour simple moving average at 0.6320. If there is a downside break below the 0.6320 support, the pair might slide toward the 0.6235 support. It is close to the 76.4% Fib retracement level of the upward wave from the 0.6182 swing low to the 0.6411 high.
On the upside, the pair might struggle near 0.6420. The next major resistance is near the 0.6450 level. A clear move above the 0.6450 level might even push the pair toward the 0.6500 level. Any more gains might clear the path for a move toward the 0.6550 resistance zone in the coming days
Trade over 50 forex markets 24 hours a day with FXOpen. Take advantage of low commissions, deep liquidity, and spreads from 0.0 pips (additional fees may apply). Open your FXOpen account now or learn more about trading forex with FXOpen.
This article represents the opinion of the Companies operating under the FXOpen brand only. It is not to be construed as an offer, solicitation, or recommendation with respect to products and services provided by the Companies operating under the FXOpen brand, nor is it to be considered financial advice.
Stay ahead of the market!
Subscribe now to our mailing list and receive the latest market news and insights delivered directly to your inbox.


Latest articles

USD/CAD Rises to a Two-Month High
Today, the USD/CAD currency pair climbed above the 1.3787 level for the first time since late January.
→ Demand for the US dollar is being supported by concerns over escalating tensions in the Middle East. Market participants are favouring

Alphabet (GOOGL) Shares Fall to 2026 Low
As the chart shows, Alphabet (GOOGL) shares have dropped to their lowest level of 2026, with trading closing well below the psychological $300 per share mark.
Why Have Alphabet (GOOGL) Shares Declined?
The bearish move is driven by a combination

FX Market Awaits Macro Data: EUR/USD and GBP/USD Near Range Boundaries
European currencies are trading without a clear direction against the US dollar, remaining in a consolidation phase following the earlier decline driven by USD strength. At the start of the week, both EUR/USD and GBP/USD attempted a recovery,