


Market Analysis: AUD/USD and NZD/USD Eye Key Upside Break
FXOpen

AUD/USD is moving higher and might rally if it clears 0.6725. NZD/USD is also rising and could extend its increase above the 0.6255 resistance zone.
Important Takeaways for AUD USD and NZD USD Analysis Today
· The Aussie Dollar started a fresh increase above the 0.6680 and 0.6695 levels against the US Dollar.
· There is a key bearish trend line forming with resistance near 0.6715 on the hourly chart of AUD/USD at FXOpen.
· NZD/USD is showing positive signs above the 0.6220 support.
· There is a major bearish trend line forming with resistance near 0.6255 on the hourly chart of NZD/USD at FXOpen.
AUD/USD Technical Analysis
On the hourly chart of AUD/USD at FXOpen, the pair started a fresh increase from the 0.6650 support. The Aussie Dollar was able to clear the 0.6680 resistance to move into a positive zone against the US Dollar.
The bulls pushed the pair above the 50% Fib retracement level of the downward move from the 0.6725 swing high to the 0.6647 low. There was a close above the 0.6695 resistance and the 50-hour simple moving average.
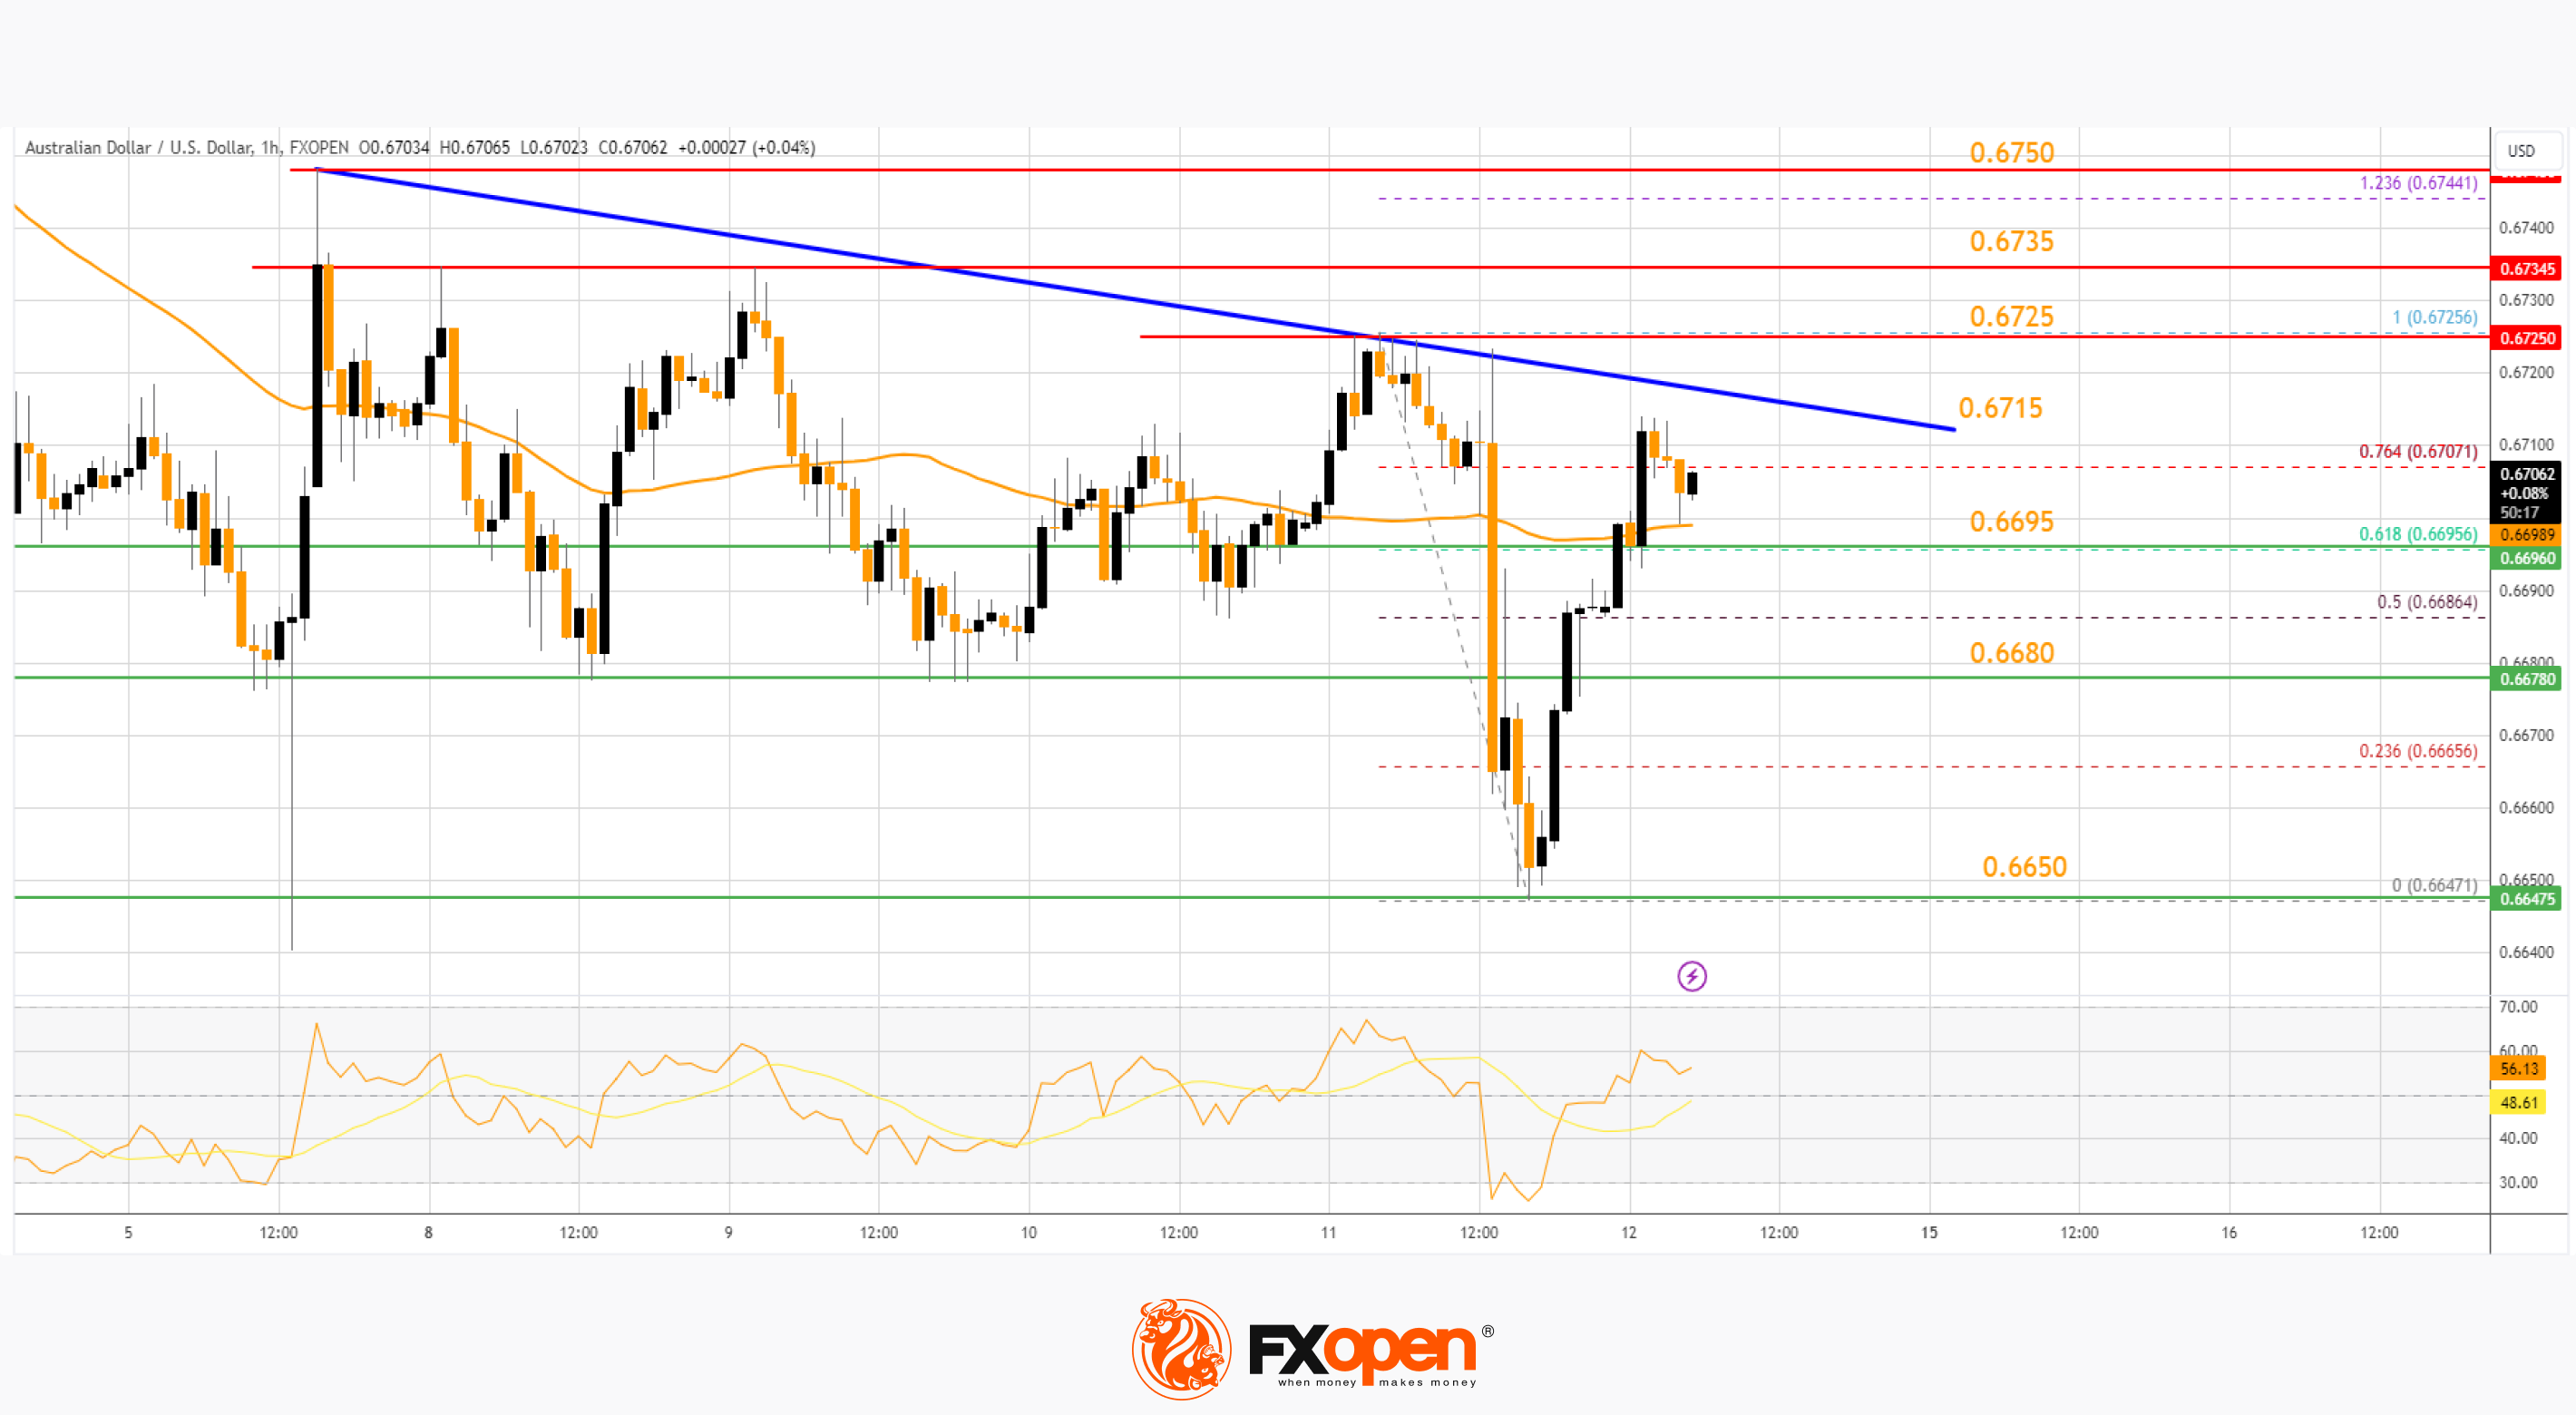
Finally, the pair spiked above the 76.4% Fib retracement level of the downward move from the 0.6725 swing high to the 0.6647 low. On the upside, the AUD/USD chart indicates that the pair is now facing resistance near a key bearish trend line at 0.6715.
The first major resistance might be 0.6725. An upside break above the 0.6725 resistance might send the pair further higher. The next major resistance is near the 0.6750 level. Any more gains could clear the path for a move toward the 0.6820 resistance zone.
If not, the pair might correct lower below the 50-hour simple moving average at 0.6695. The next support could be 0.6680. If there is a downside break below the 0.6680 support, the pair could extend its decline toward the 0.6650 zone. Any more losses might signal a move toward 0.6600.
NZD/USD Technical Analysis
On the hourly chart of NZD/USD on FXOpen, the pair started a steady increase from the 0.6200 level. The New Zealand Dollar broke the 0.6220 resistance to start the recent increase against the US Dollar.
The pair settled above 0.6235 and the 50-hour simple moving average. It tested the 0.6260 zone and is currently consolidating gains above the 23.6% Fib retracement level of the upward wave from the 0.6195 swing low to the 0.6258 high.
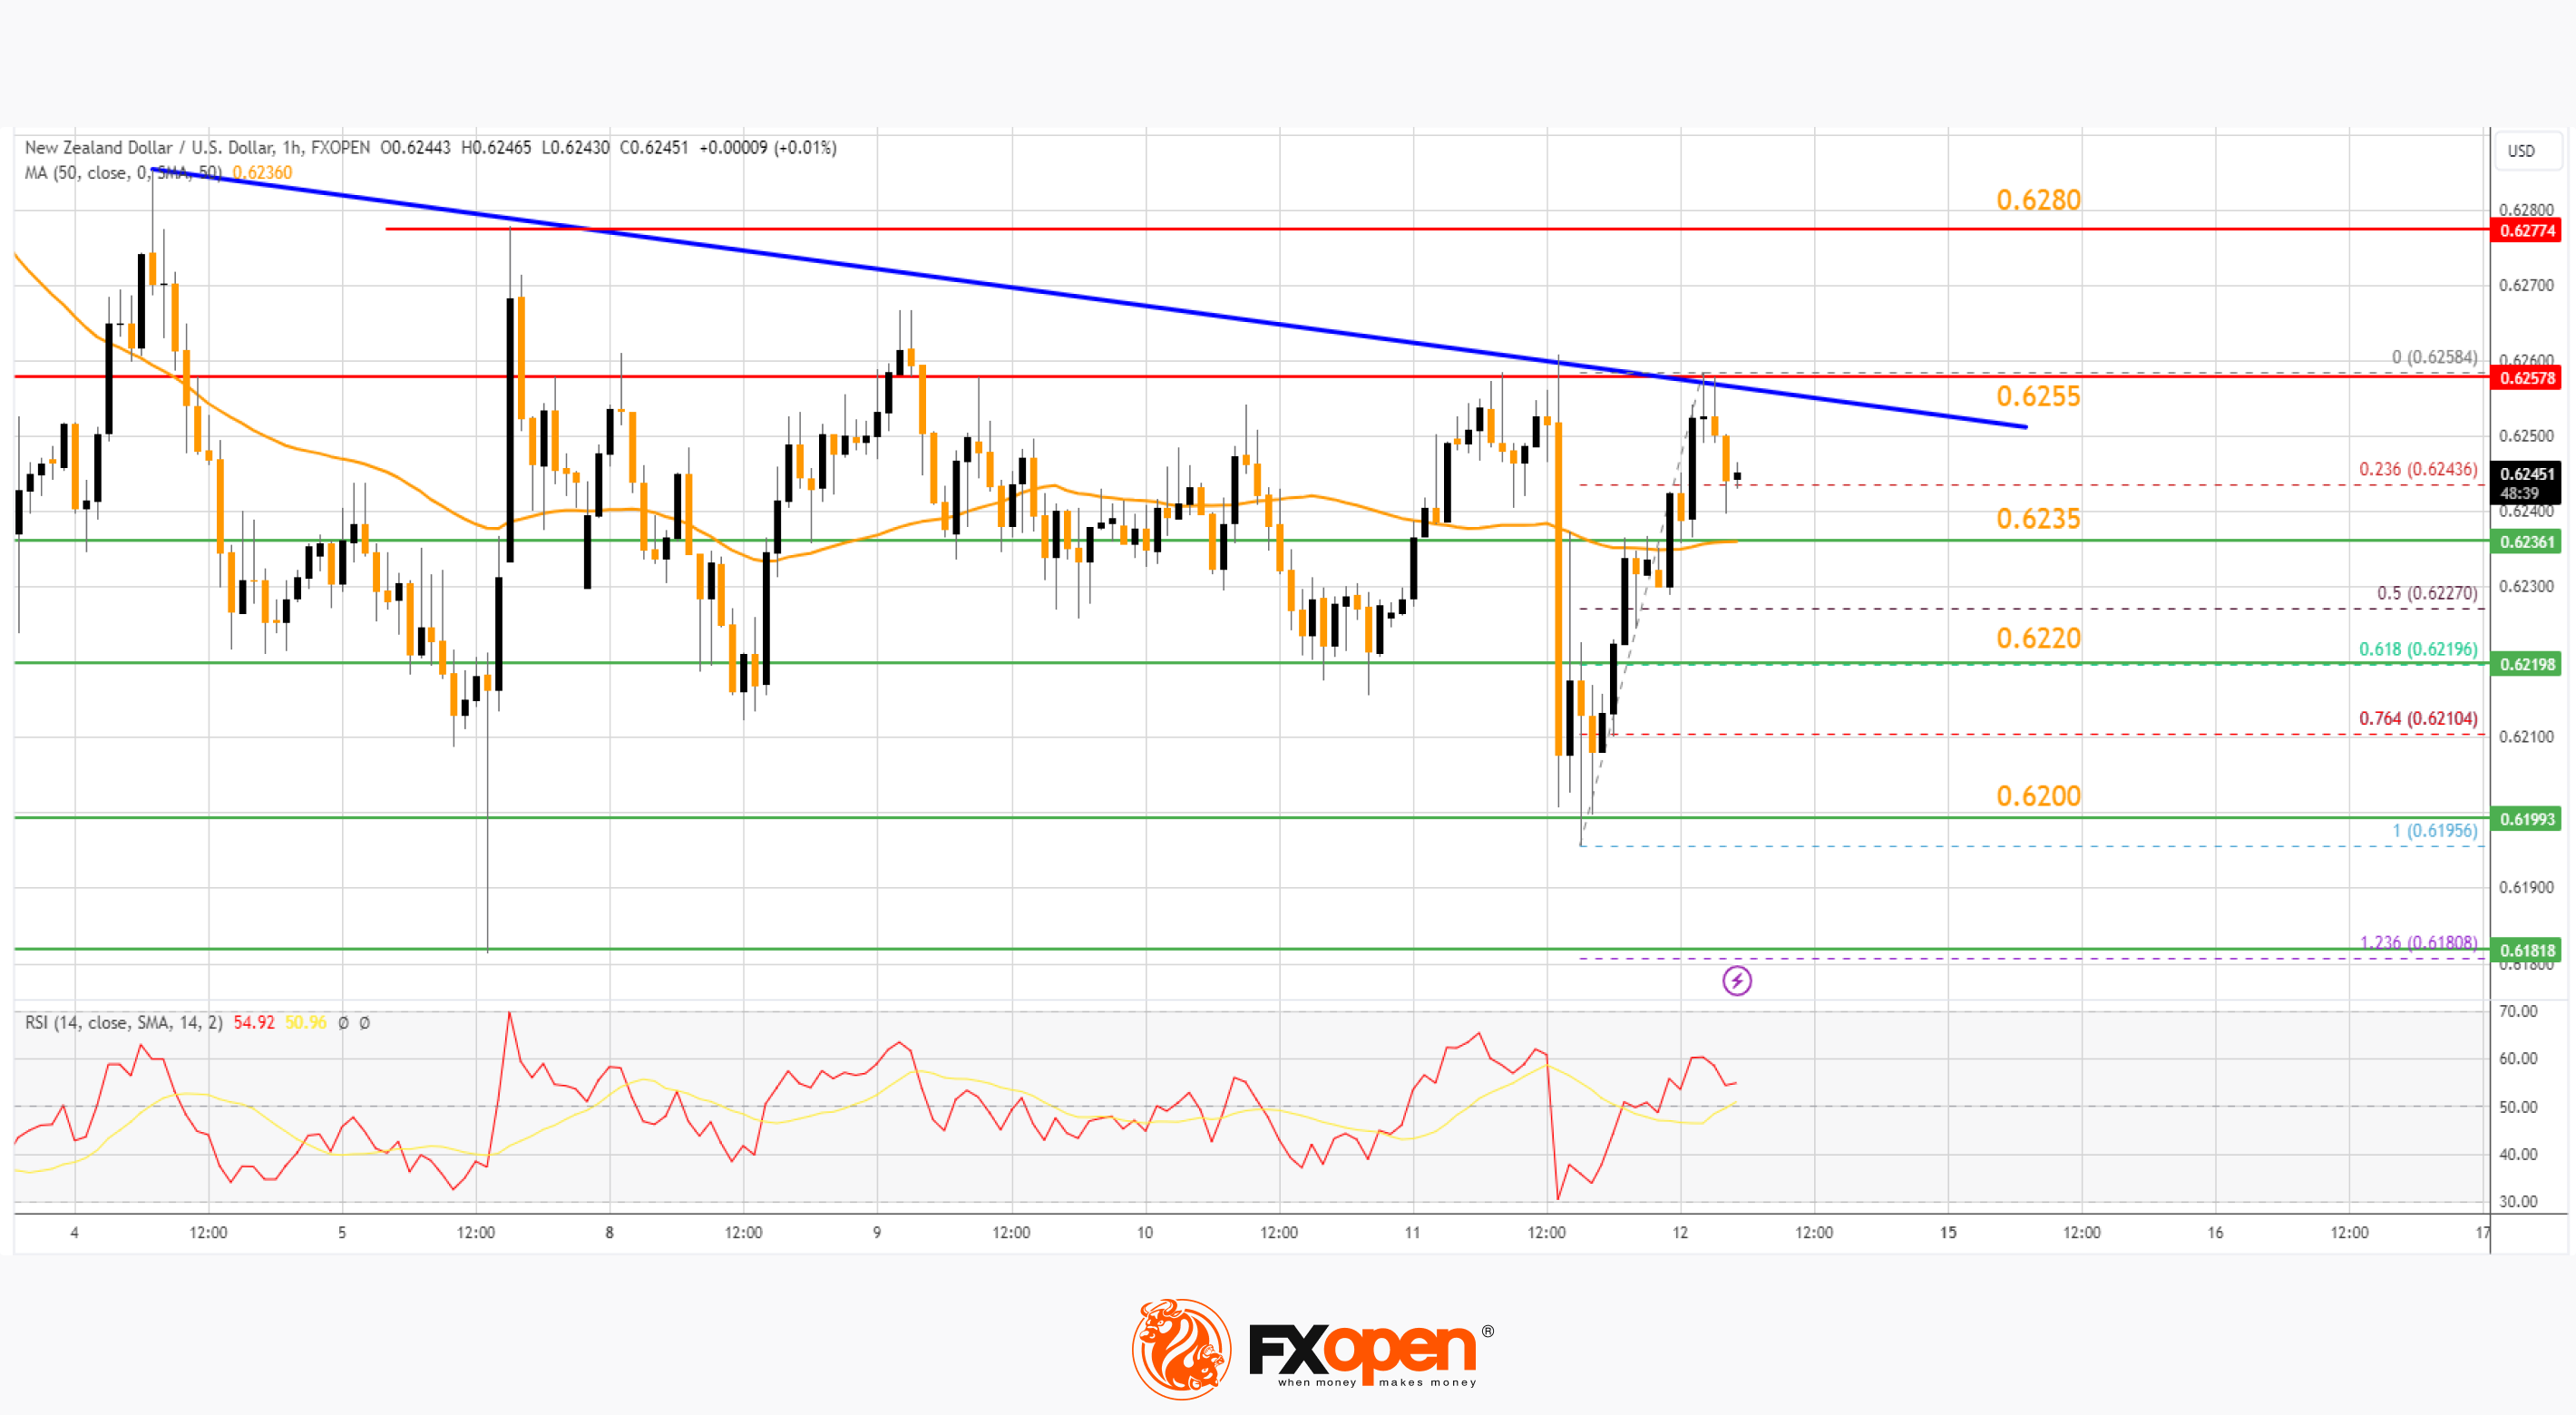
The NZD/USD chart suggests that the RSI is still above 50 and signaling more upsides. On the upside, the pair might struggle near 0.6255 and a major bearish trend line.
The next major resistance is near the 0.6280 level. A clear move above the 0.6280 level might even push the pair toward the 0.6320 level. Any more gains might clear the path for a move toward the 0.6400 resistance zone in the coming days.
On the downside, there is a support forming near the 50-hour simple moving average at 0.6235. The next major support is near the 61.8% Fib retracement level of the upward wave from the 0.6195 swing low to the 0.6258 high at 0.6220.
If there is a downside break below the 0.6220 support, the pair might slide toward the 0.6200 support. Any more losses could lead NZD/USD in a bearish zone to 0.6160.
Trade over 50 forex markets 24 hours a day with FXOpen. Take advantage of low commissions, deep liquidity, and spreads from 0.0 pips (additional fees may apply). Open your FXOpen account now or learn more about trading forex with FXOpen.
This article represents the opinion of the Companies operating under the FXOpen brand only. It is not to be construed as an offer, solicitation, or recommendation with respect to products and services provided by the Companies operating under the FXOpen brand, nor is it to be considered financial advice.
Stay ahead of the market!
Subscribe now to our mailing list and receive the latest market news and insights delivered directly to your inbox.


Latest articles

Brent Crude Oil: From Ceasefire to Crossfire — What's Next?
Just weeks ago, traders were pricing in peace. Now they're pricing in war again—and that reversal says everything about how fragile the current Middle East calm really is.
Brent crude has surged to $86 a barrel, its highest level

AUD/USD and USD/CAD React to Softer US Inflation
Commodity-linked currencies strengthened after US inflation data came in weaker than expected. The Consumer Price Index (CPI) slowed to 3.5% year-on-year in June, below the 3.8% forecast, while core inflation eased to 2.6% versus expectations of 2.

NVIDIA: Kyber NVL144 Dispute Weighs on the Stock
NVIDIA shares found themselves at the centre of debate over the future of the Kyber NVL144 system. On 6 July, CNBC, citing research firm SemiAnalysis, reported that the project could be delayed by more than a year—from 2027 to