


FXOpen

AUD/USD is attempting a recovery wave from 0.6440. NZD/USD is also correcting losses and might recover if there is a clear move above 0.5760.
Important Takeaways for AUD/USD and NZD/USD Analysis Today
· The Aussie Dollar found support near 0.6440 and is now recovering against the US Dollar.
· There was a break above a key bearish trend line with resistance at 0.6490 on the hourly chart of AUD/USD at FXOpen.
· NZD/USD is attempting a recovery wave above 0.5700.
· There was a break above a major bearish trend line with resistance near 0.5720 on the hourly chart of NZD/USD at FXOpen.
AUD/USD Technical Analysis
On the hourly chart of AUD/USD at FXOpen, the pair dipped from well above 0.6600. The Aussie Dollar declined below 0.6500, but the bulls were active near 0.6440 against the US Dollar.
A low was formed near 0.6440, and the pair is now correcting losses. There was a move above the 23.6% Fib retracement level of the downward wave from the 0.6612 swing high to the 0.6440 low. There was also a break above a key bearish trend line with resistance at 0.6490.
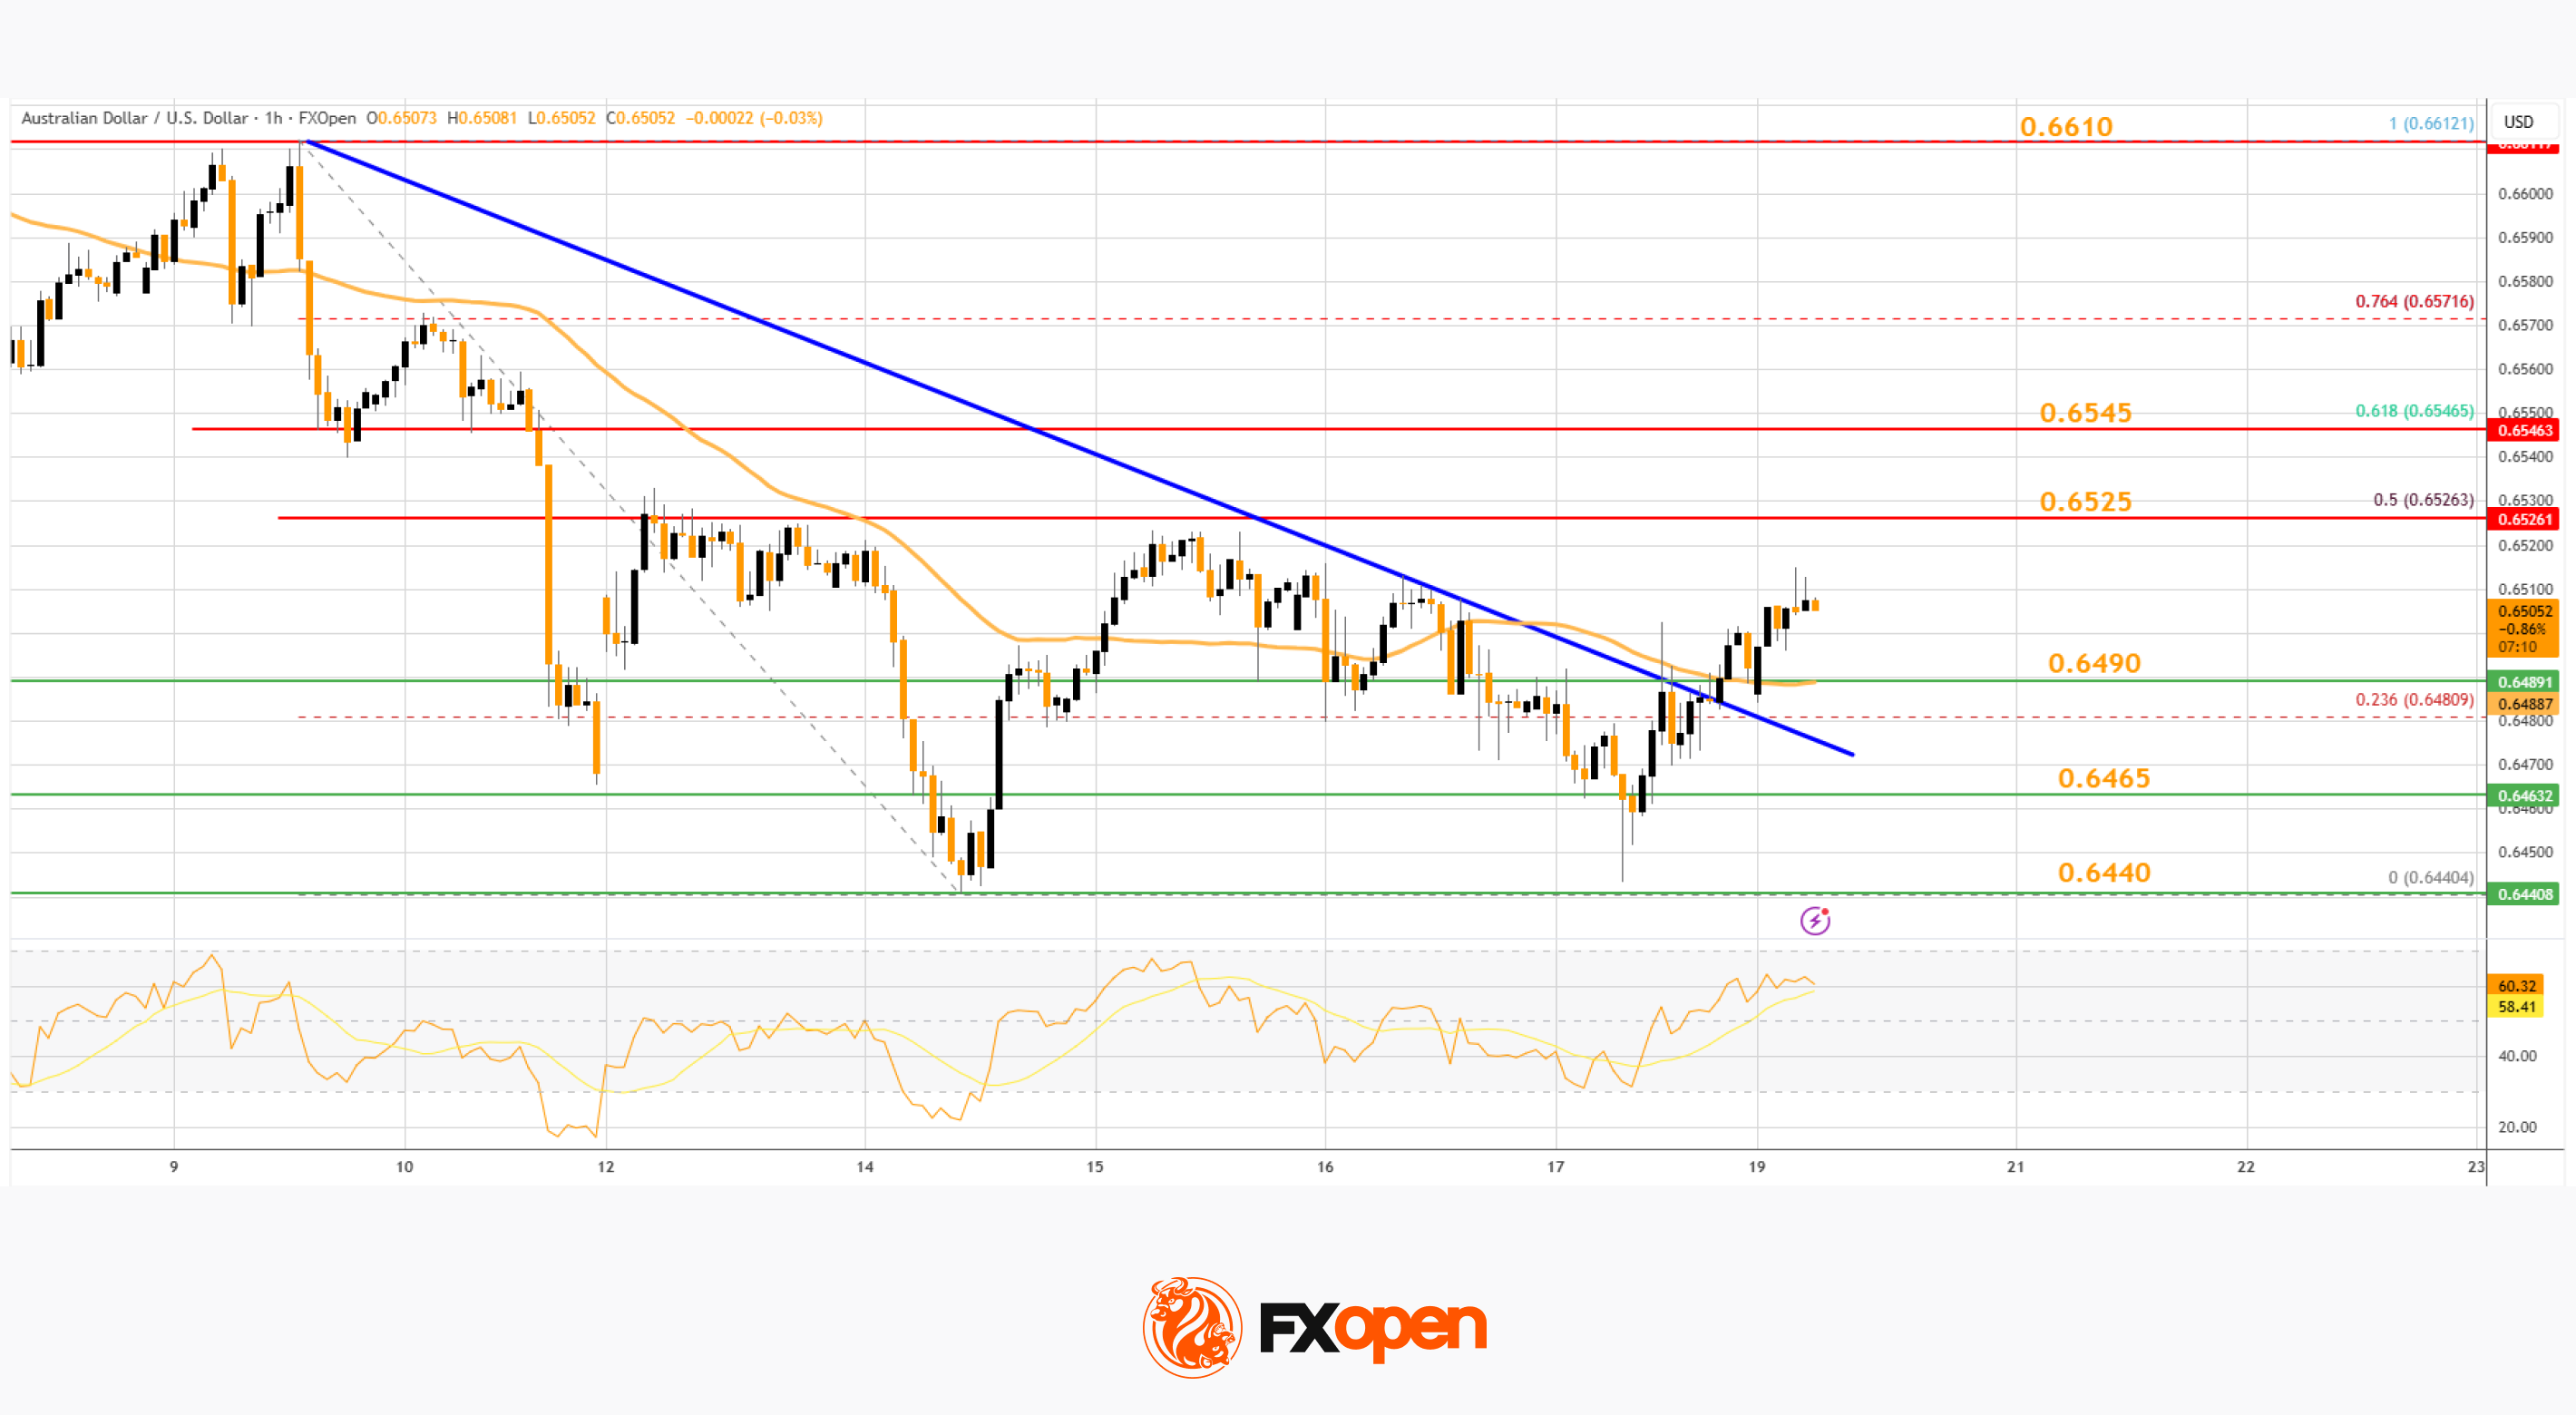
The pair is now above 0.6500 and the 50-hour simple moving average. On the upside, immediate resistance is near the 50% Fib retracement at 0.6525.
The first major hurdle for the bulls could be 0.6545. A clear upside break above 0.6545 could send the pair toward 0.6610. The next area of interest on the AUD/USD chart is near 0.6650, above which the price could rise toward 0.6680. Any more gains might send the pair toward 0.6720.
On the downside, initial support is near 0.6490 or the 50-hour simple moving average. The key breakdown zone could be 0.6465 and 0.6440. Any more losses might send the pair toward 0.6400.
NZD/USD Technical Analysis
On the hourly chart of NZD/USD on FXOpen, the pair also followed a similar pattern and declined from the 0.5800 zone. The New Zealand Dollar gained bearish momentum and traded below 0.5750 against the US Dollar.
The pair even dropped below the 50-hour simple moving average and tested 0.5680. A low was formed near 0.5682, and the pair is now attempting a fresh increase. It is back above 0.5700 and the 50-hour simple moving average.
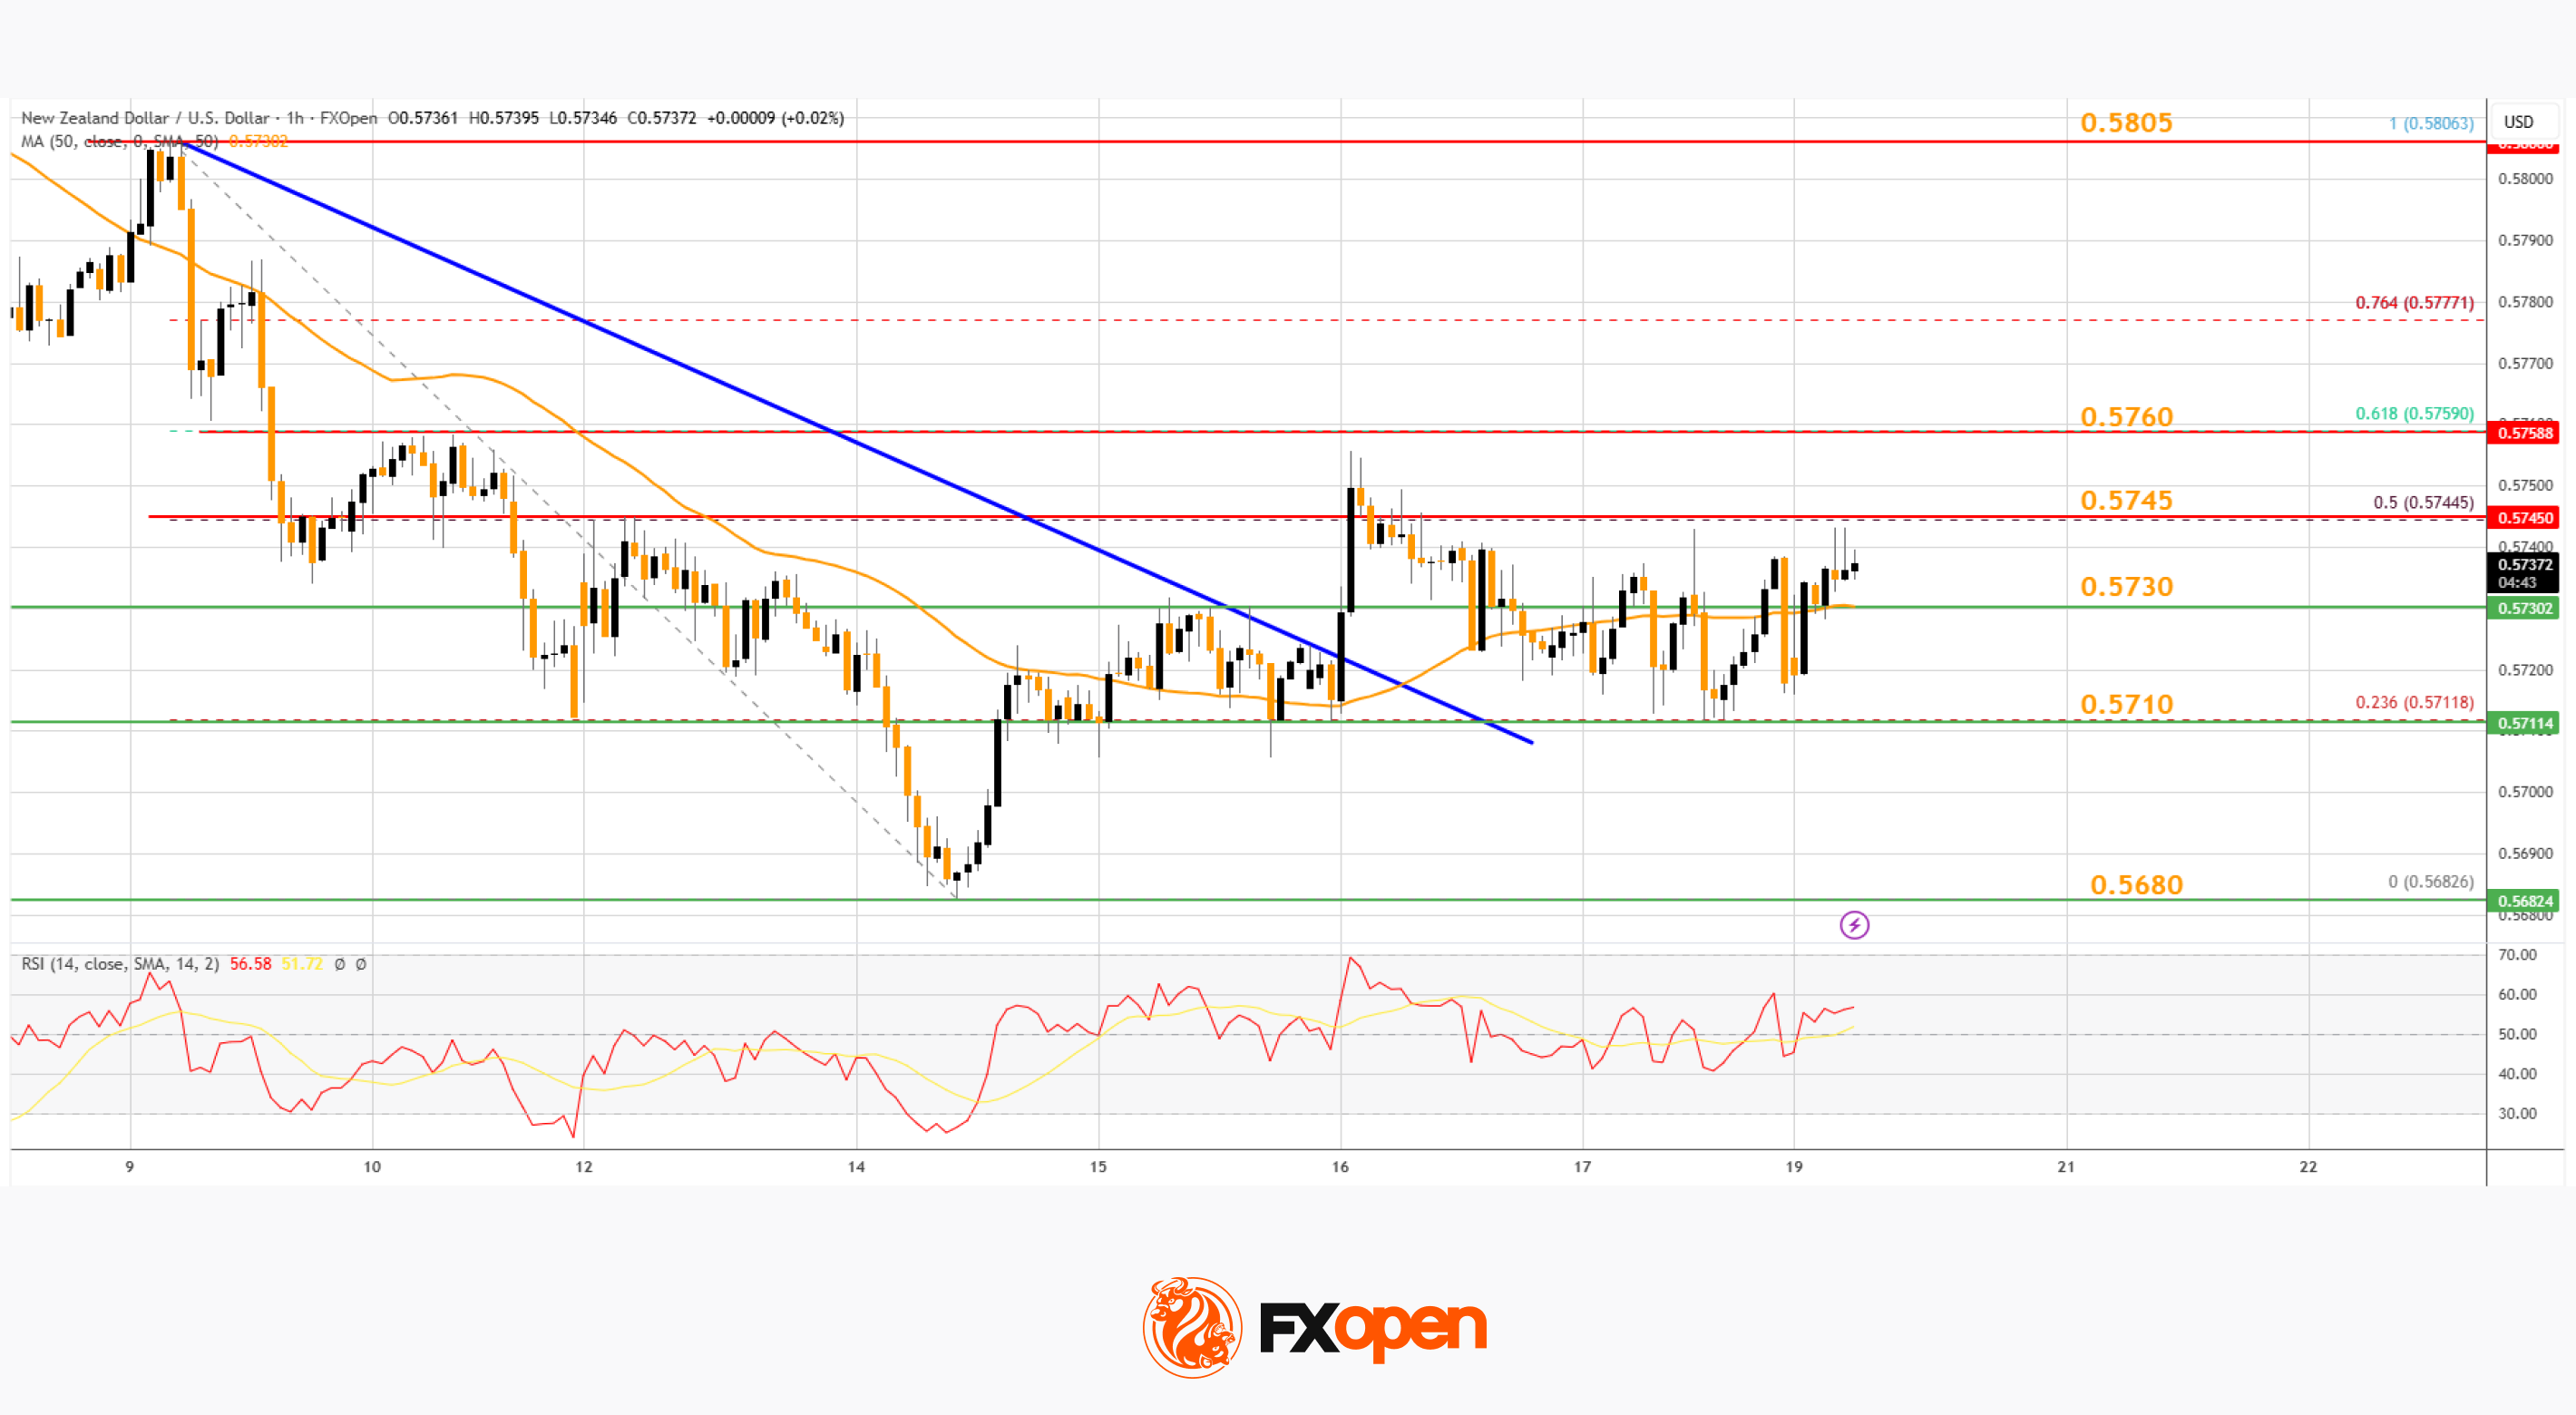
Besides, there was a break above a major bearish trend line with resistance near 0.5720. The pair tested the 50% Fib retracement level of the downward wave from the 0.5806 swing high to the 0.5682 low.
On the upside, the pair is facing a barrier near 0.5745. The next key breakout zone sits near the 61.8% Fib retracement at 0.5760. If there is a move above 0.5760, the pair could rise toward 0.5805. Any more gains might open the doors for a move to 0.5850.
On the downside, immediate support on the NZD/USD chart is near 0.5730. The next key area for the bulls might be 0.5710. If there is a downside break below 0.5710, the pair could extend the decline toward 0.5680. The main target for the bears below 0.5680 might be 0.5620.
Trade over 50 forex markets 24 hours a day with FXOpen. Take advantage of low commissions, deep liquidity, and spreads from 0.0 pips (additional fees may apply). Open your FXOpen account now or learn more about trading forex with FXOpen.
This article represents the opinion of the Companies operating under the FXOpen brand only. It is not to be construed as an offer, solicitation, or recommendation with respect to products and services provided by the Companies operating under the FXOpen brand, nor is it to be considered financial advice.
Stay ahead of the market!
Subscribe now to our mailing list and receive the latest market news and insights delivered directly to your inbox.


Latest articles

Market Analysis: Gold Price Slips Back, WTI Crude Oil Rally Gains Fresh Strength
Gold price rallied above $4,750 before correcting lower. Crude oil prices are rising and could climb further higher toward $110.00.
Important Takeaways for Gold and WTI Crude Oil Prices Analysis Today
· Gold price gained pace for a move

Consolidation Ahead of NFP: Commodity Currencies Search for Direction
Commodity-linked currencies have entered a consolidation phase following recent directional moves, as market participants adopt a wait-and-see approach ahead of key US labour market data. Current price action reflects a balance between ongoing demand for the US dollar and attempts

The Real Driver Behind the Dollar Rally: Market Insights with Gary Thomson
The US dollar has been firm, but the drivers behind the move may be more complex than they first appear.
While geopolitical tension and shifts in risk sentiment play a role, current price behaviour seems increasingly influenced by inflation expectations