


Market Analysis: AUD/USD and NZD/USD Remain In Uptrend
FXOpen

AUD/USD is correcting gains from the 0.6620 zone. NZD/USD is also moving lower and might attempt a fresh increase from 0.6000.
Important Takeaways for AUD USD and NZD USD Analysis Today
· The Aussie Dollar started a downside correction from 0.6620 against the US Dollar.
· There is a key bullish trend line forming with support at 0.6550 on the hourly chart of AUD/USD at FXOpen.
· NZD/USD is also moving lower below the 0.6030 support zone.
· There is a major bullish trend line forming with support at 0.5995 on the hourly chart of NZD/USD at FXOpen.
AUD/USD Technical Analysis
On the hourly chart of AUD/USD at FXOpen, the pair started a fresh increase from the 0.6480 support. The Aussie Dollar was able to clear the 0.6535 resistance to move into a positive zone against the US Dollar.
There was a close above the 0.6550 resistance and the 50-hour simple moving average. Finally, the pair tested the 0.6620 zone. A high was formed near 0.6619 and the pair is now correcting gains.
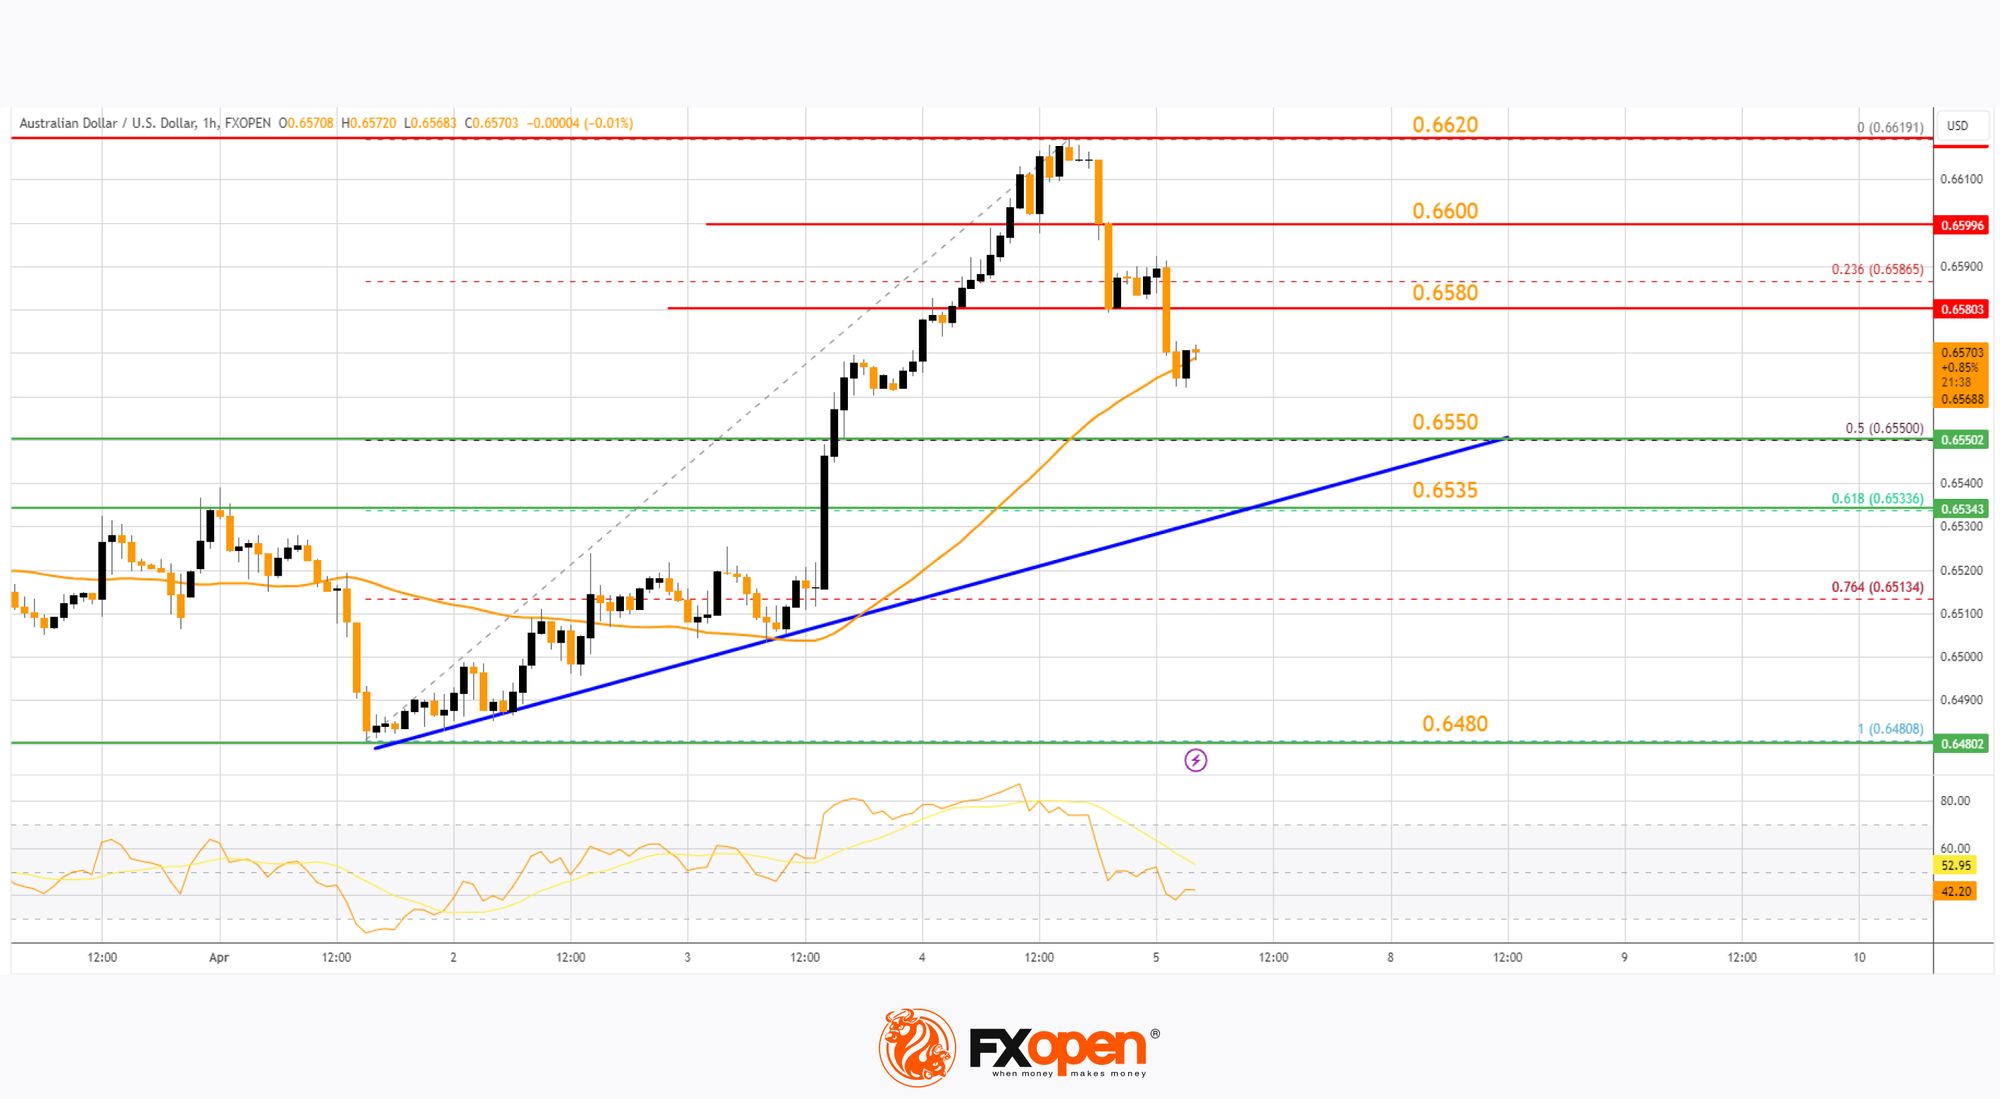
There was a move below the 0.6600 level. The pair declined below the 23.6% Fib retracement level of the upward move from the 0.6480 swing low to the 0.6619 high. On the downside, initial support is near the 50% Fib retracement level of the upward move from the 0.6480 swing low to the 0.6619 high at 0.6550.
There is also a key bullish trend line forming with support at 0.6550. The next support could be 0.6535. If there is a downside break below the 0.6535 support, the pair could extend its decline toward the 0.6480 level. Any more losses might signal a move toward 0.6440.
On the upside, the AUD/USD chart indicates that the pair is now facing resistance near 0.6580. The first major resistance might be 0.6600. An upside break above the 0.6600 resistance might send the pair further higher.
The next major resistance is near the 0.6620 level. Any more gains could clear the path for a move toward the 0.6650 resistance zone.
NZD/USD Technical Analysis
On the hourly chart of NZD/USD on FXOpen, the pair started a steady increase from the 0.5940 level. The New Zealand Dollar broke the 0.6000 resistance to start the recent increase against the US Dollar.
The pair settled above 0.6000 and the 50-hour simple moving average. It tested the 0.6050 zone and is currently correcting gains. The pair corrected lower below the 0.6030 level. The pair also traded below the 23.6% Fib retracement level of the upward wave from the 0.5939 swing low to the 0.6046 high.
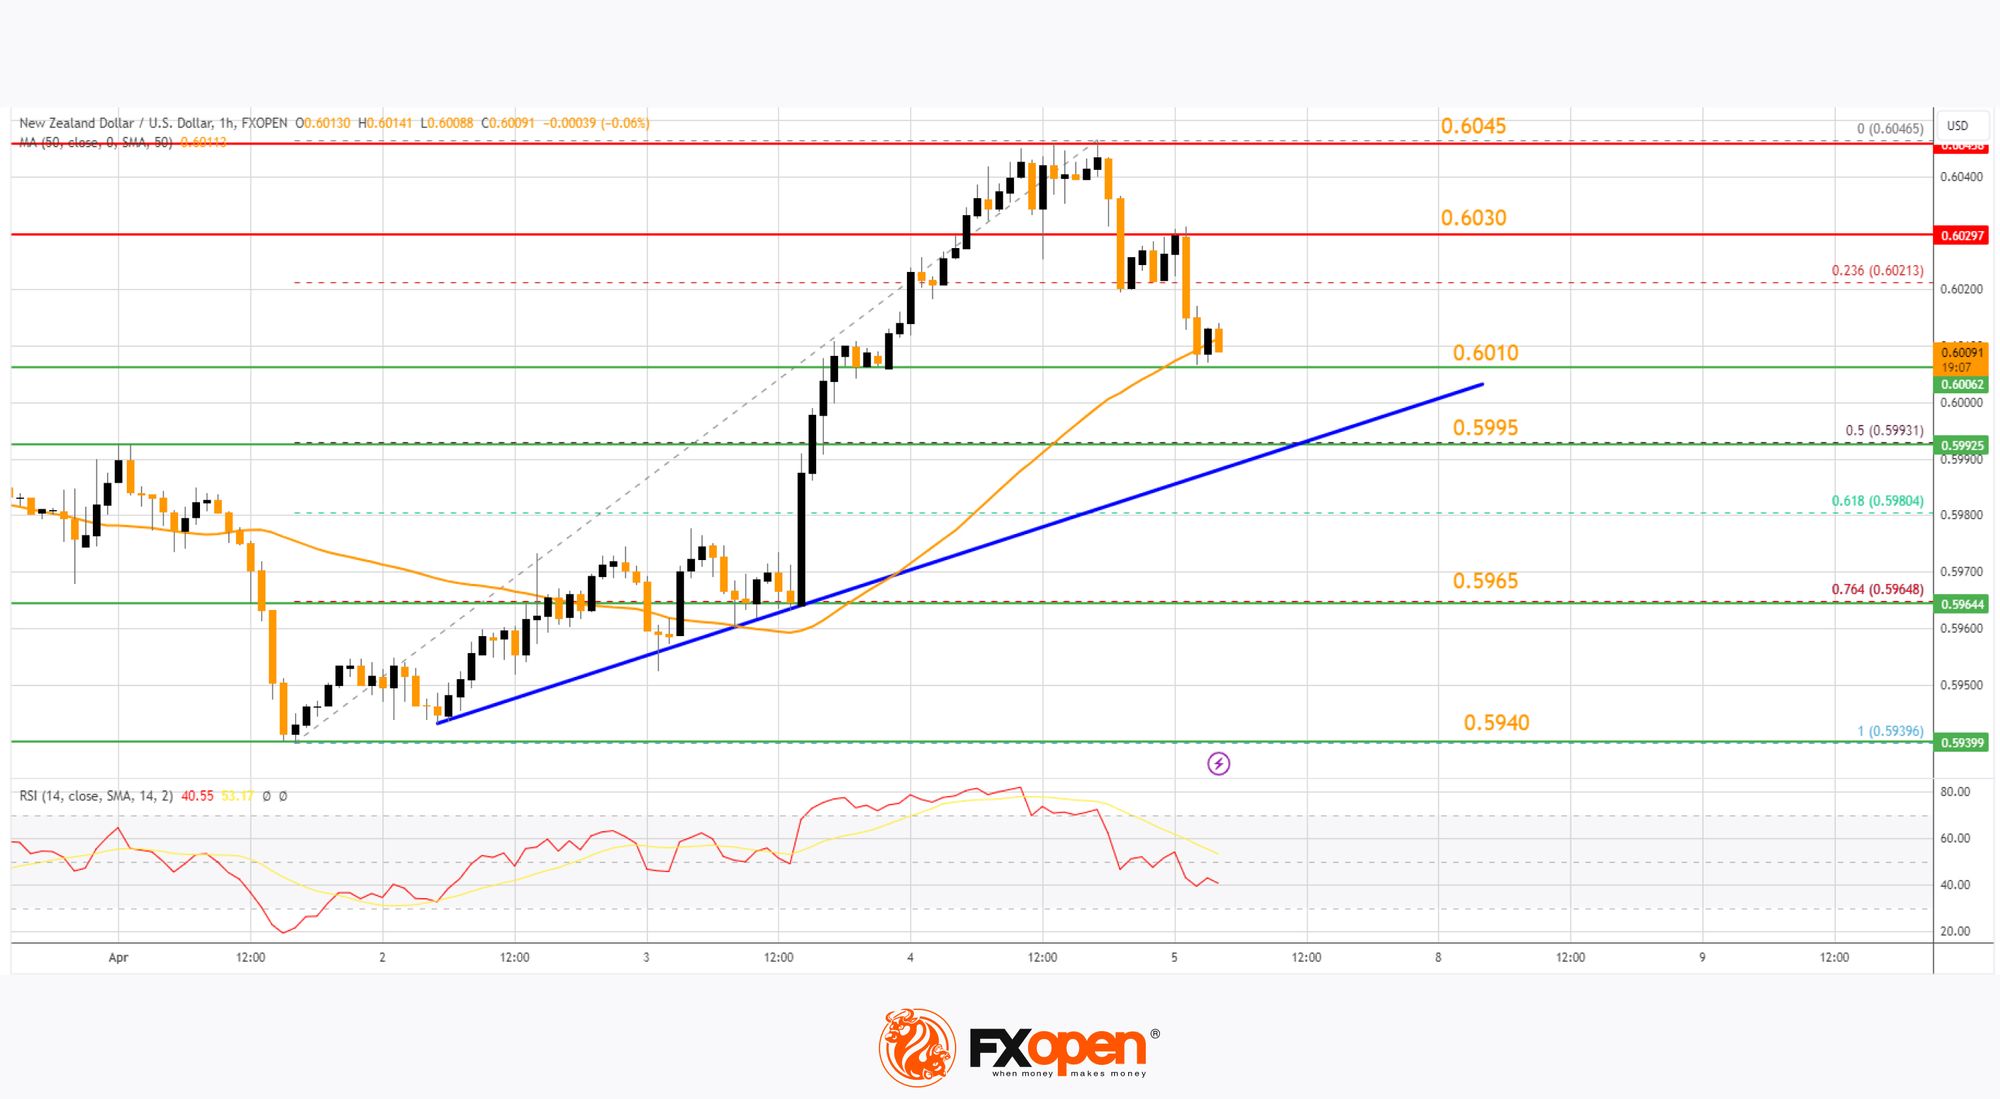
The NZD/USD chart suggests that the RSI is still below 50 and signaling more downsides. On the downside, there is major support forming near 0.6010.
The next major support is near the 50% Fib retracement level of the upward wave from the 0.5939 swing low to the 0.6046 high at 0.5995. There is also a major bullish trend line forming with support at 0.5995.
If there is a downside break below the 0.5995 support, the pair might slide toward the 0.5965 support. Any more losses could lead NZD/USD in a bearish zone to 0.5940.
On the upside, the pair might struggle near 0.6030. The next major resistance is near the 0.6045 level. A clear move above the 0.6045 level might even push the pair toward the 0.6080 level. Any more gains might clear the path for a move toward the 0.6120 resistance zone in the coming days.
Trade over 50 forex markets 24 hours a day with FXOpen. Take advantage of low commissions, deep liquidity, and spreads from 0.0 pips (additional fees may apply). Open your FXOpen account now or learn more about trading forex with FXOpen.
This article represents the opinion of the Companies operating under the FXOpen brand only. It is not to be construed as an offer, solicitation, or recommendation with respect to products and services provided by the Companies operating under the FXOpen brand, nor is it to be considered financial advice.
Stay ahead of the market!
Subscribe now to our mailing list and receive the latest market news and insights delivered directly to your inbox.


Latest articles

USD/CAD: One Trendline Away From Deciding the Next Move
After several strongly positive weeks, USD/CAD has stalled over the past few sessions, entering a phase of uncertainty.
On the dollar side, Fed Chair Kevin Warsh has struck a firm tone, reaffirming the 2% inflation target and pushing back

Amazon: New Bond Issuance to Fund AI Infrastructure
On 7 July, Amazon announced an eight-tranche bond offering worth at least $25 billion, with the proceeds expected to finance the construction of data centres and the expansion of its artificial intelligence infrastructure. Investor demand peaked at $62 billion, highlighting

Weekly Market Insights with Gary Thomson: US Inflation, UK GDP, Chair Warsh Testimony, and Earnings
In this video, we’ll explore the key economic events and market trends, shaping the financial landscape. Get ready for insights into financial markets to help you navigate the week ahead. Let’s dive in!
In this episode of Market