


Market Analysis: AUD/USD and NZD/USD Set Sights on Additional Upside
FXOpen

AUD/USD started a decent increase above the 0.6655 resistance. NZD/USD is also rising and could aim for a move above the 0.6140 resistance.
Important Takeaways for AUD/USD and NZD/USD Analysis Today
· The Aussie Dollar found support at 0.6585 and recovered higher against the US Dollar.
· There is a major bullish trend line forming with support at 0.6670 on the hourly chart of AUD/USD at FXOpen.
· NZD/USD is consolidating gains above the 0.6100 support.
· There is a key bullish trend line forming with support at 0.6100 on the hourly chart of NZD/USD at FXOpen.
AUD/USD Technical Analysis
On the hourly chart of AUD/USD at FXOpen, the pair formed a base above 0.6585. The Aussie Dollar started a decent increase above the 0.6630 resistance against the US Dollar, as mentioned in the previous analysis.
The bulls pushed the pair above the 0.6655 resistance zone. There was a close above the 0.6685 resistance and the 50-hour simple moving average. Finally, the pair tested the 0.6715 zone. A high was formed at 0.6714 before the pair corrected gains.
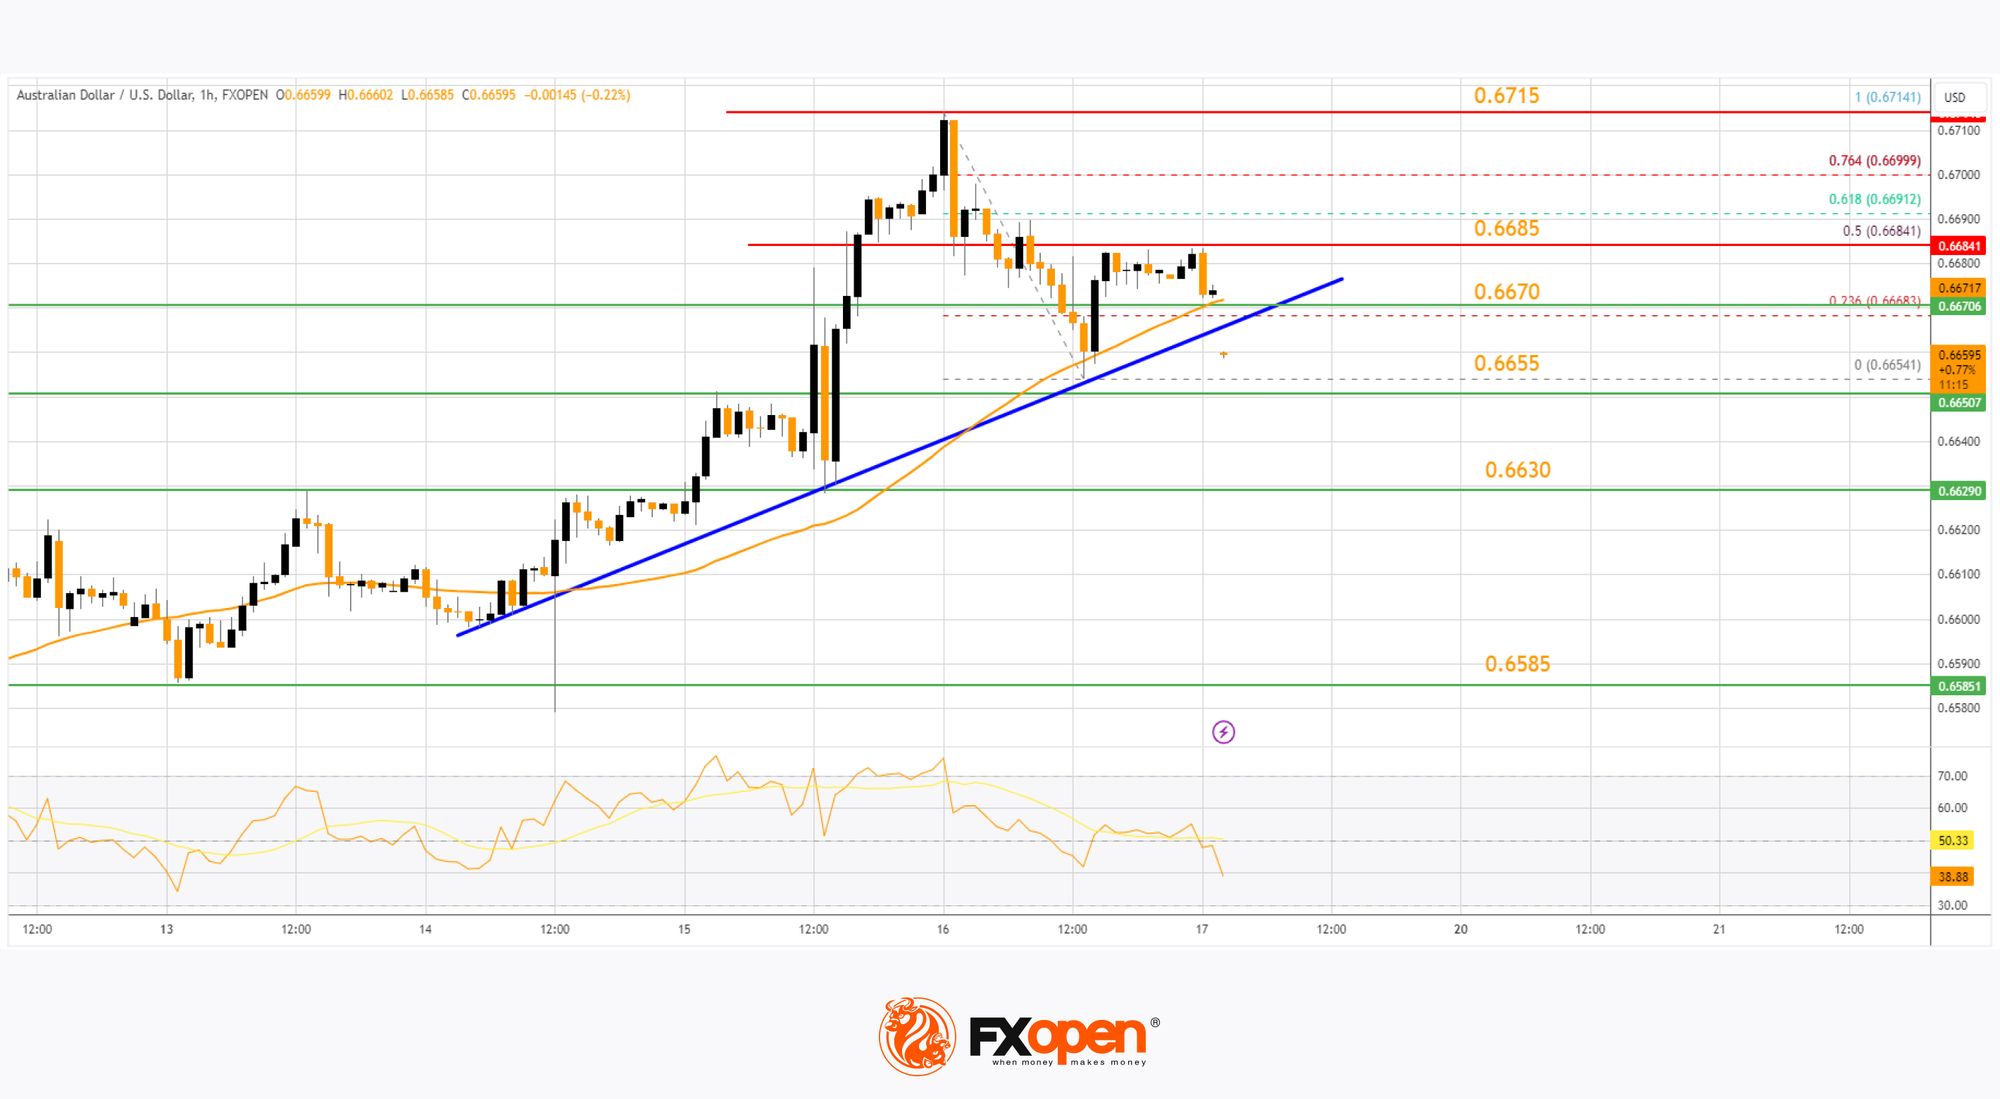
It tested the 0.6655 zone and is currently consolidating gains. There was a fresh increase above the 23.6% Fib retracement level of the downward move from the 0.6714 swing high to the 0.6654 low.
On the upside, the AUD/USD chart indicates that the pair is now facing resistance near the 50% Fib retracement level of the downward move from the 0.6714 swing high to the 0.6654 low at 0.6685. The first major resistance might be 0.6715.
An upside break above the 0.6715 resistance might send the pair further higher. The next major resistance is near the 0.6750 level. Any more gains could clear the path for a move toward the 0.6800 resistance zone.
If not, the pair might correct lower. Immediate support is near a major bullish trend line at 0.6670. The next support could be 0.6655. If there is a downside break below the 0.6655 support, the pair could extend its decline toward the 0.6630 zone. Any more losses might signal a move toward 0.6585.
NZD/USD Technical Analysis
On the hourly chart of NZD/USD on FXOpen, the pair also followed AUD/USD. The New Zealand Dollar formed a base above the 0.6000 level and started a decent increase against the US Dollar.
The pair climbed above the 0.6065 resistance and the 50-hour simple moving average. The pair even spiked above 0.6130. A high was formed near 0.6140 before there was a downside correction. The pair tested the 0.6100 zone before the bulls emerged.
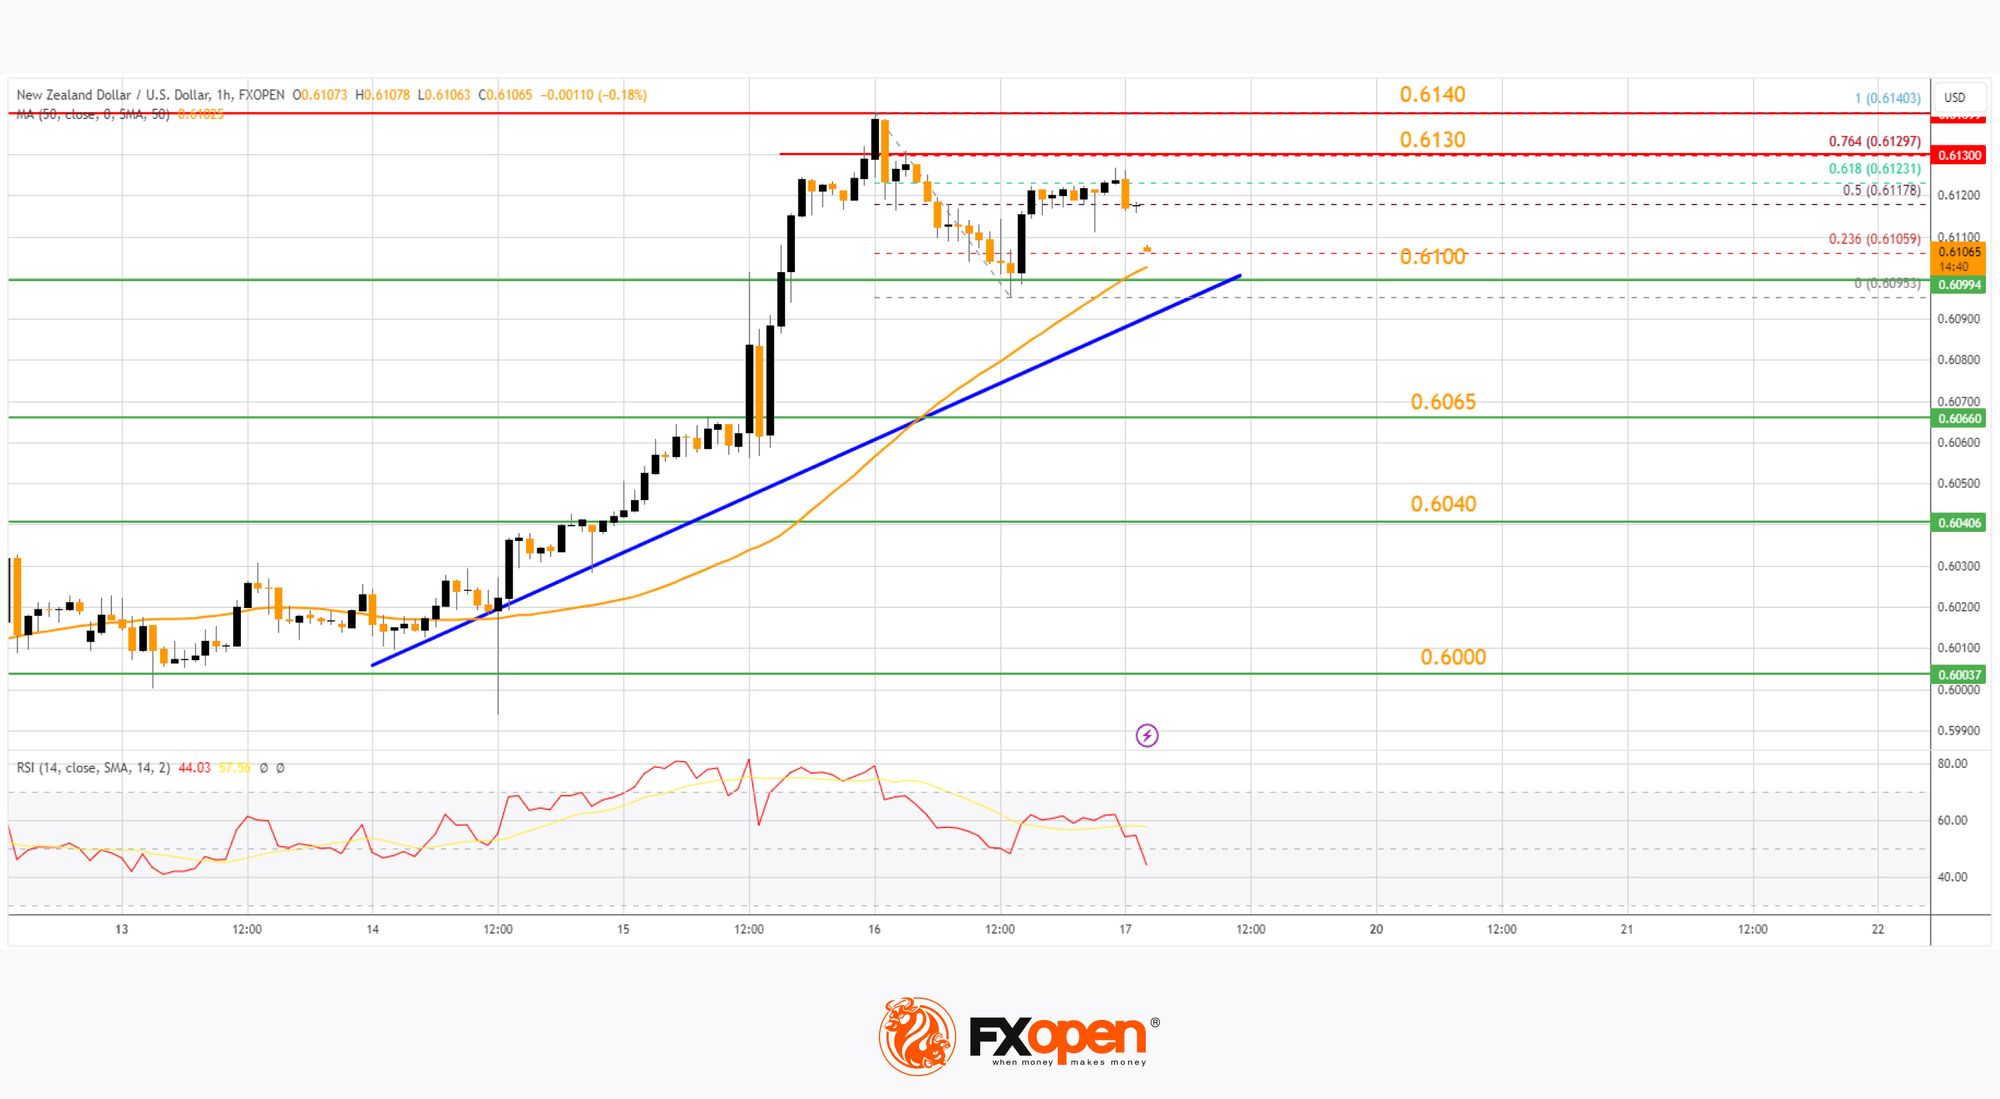
It is again rising above the 50% Fib retracement level of the downward move from the 0.6140 swing high to the 0.6095 low. The NZD/USD chartsuggests that the RSI is correcting lower toward 40.
On the upside, the pair is facing resistance near the 0.6130 zone and the 76.4% Fib retracement level of the downward move from the 0.6140 swing high to the 0.6095 low. The next major resistance is near the 0.6140 level.
A clear move above the 0.6140 level might even push the pair toward the 0.6185 level. Any more gains might clear the path for a move toward the 0.6220 resistance zone in the coming days.
On the downside, there is a support forming near the 50-hour simple moving average and a key bullish trend line at 0.6100. If there is a downside break below the 0.6100 support, the pair might slide toward 0.6065. Any more losses could lead NZD/USD in a bearish zone to 0.6040.
Trade over 50 forex markets 24 hours a day with FXOpen. Take advantage of low commissions, deep liquidity, and spreads from 0.0 pips (additional fees may apply). Open your FXOpen account now or learn more about trading forex with FXOpen.
This article represents the opinion of the Companies operating under the FXOpen brand only. It is not to be construed as an offer, solicitation, or recommendation with respect to products and services provided by the Companies operating under the FXOpen brand, nor is it to be considered financial advice.
Stay ahead of the market!
Subscribe now to our mailing list and receive the latest market news and insights delivered directly to your inbox.


Latest articles

Weekly Market Insights with Gary Thomson: US Inflation, UK GDP, Chair Warsh Testimony, and Earnings
In this video, we’ll explore the key economic events and market trends, shaping the financial landscape. Get ready for insights into financial markets to help you navigate the week ahead. Let’s dive in!
In this episode of Market

GBP/AUD Analysis: The Tug-of-War Begins
Oil is back in the driver's seat, and both the pound and the aussie are feeling its grip. The Bank of England held rates at 3.75% in June, but with UK inflation at 2.8% and crude oil climbing

Australian Dollar Holds Above the Current Market Profile
The minutes from the Reserve Bank of Australia's (RBA) June meeting, released on 30 June, suggested that policymakers are not yet ready to rule out further policy tightening. Board members noted persistent excess demand and broad-based inflationary pressures across the