


Market Analysis: AUD/USD and NZD/USD Show Signs of Life
FXOpen

AUD/USD is moving higher and might climb above 0.6450. NZD/USD is also rising and could extend its increase above the 0.5915 resistance zone.
Important Takeaways for AUD USD and NZD USD Analysis Today
· The Aussie Dollar started a fresh increase above the 0.6350 and 0.6400 levels against the US Dollar.
· There is a connecting bullish trend line forming with support near 0.6425 on the hourly chart of AUD/USD at FXOpen.
· NZD/USD is gaining bullish momentum above the 0.5870 support.
· There is a short-term contracting triangle forming with support near 0.5885 on the hourly chart of NZD/USD at FXOpen.
AUD/USD Technical Analysis
On the hourly chart of AUD/USD at FXOpen, the pair started a fresh increase from the 0.6320 support. The Aussie Dollar was able to clear the 0.6350 resistance to move into a positive zone against the US Dollar.
There was a close above the 0.6400 resistance and the 50-hour simple moving average. Finally, the pair tested the 0.6455 zone. A high is formed near 0.6456 and the pair is now consolidating gains.
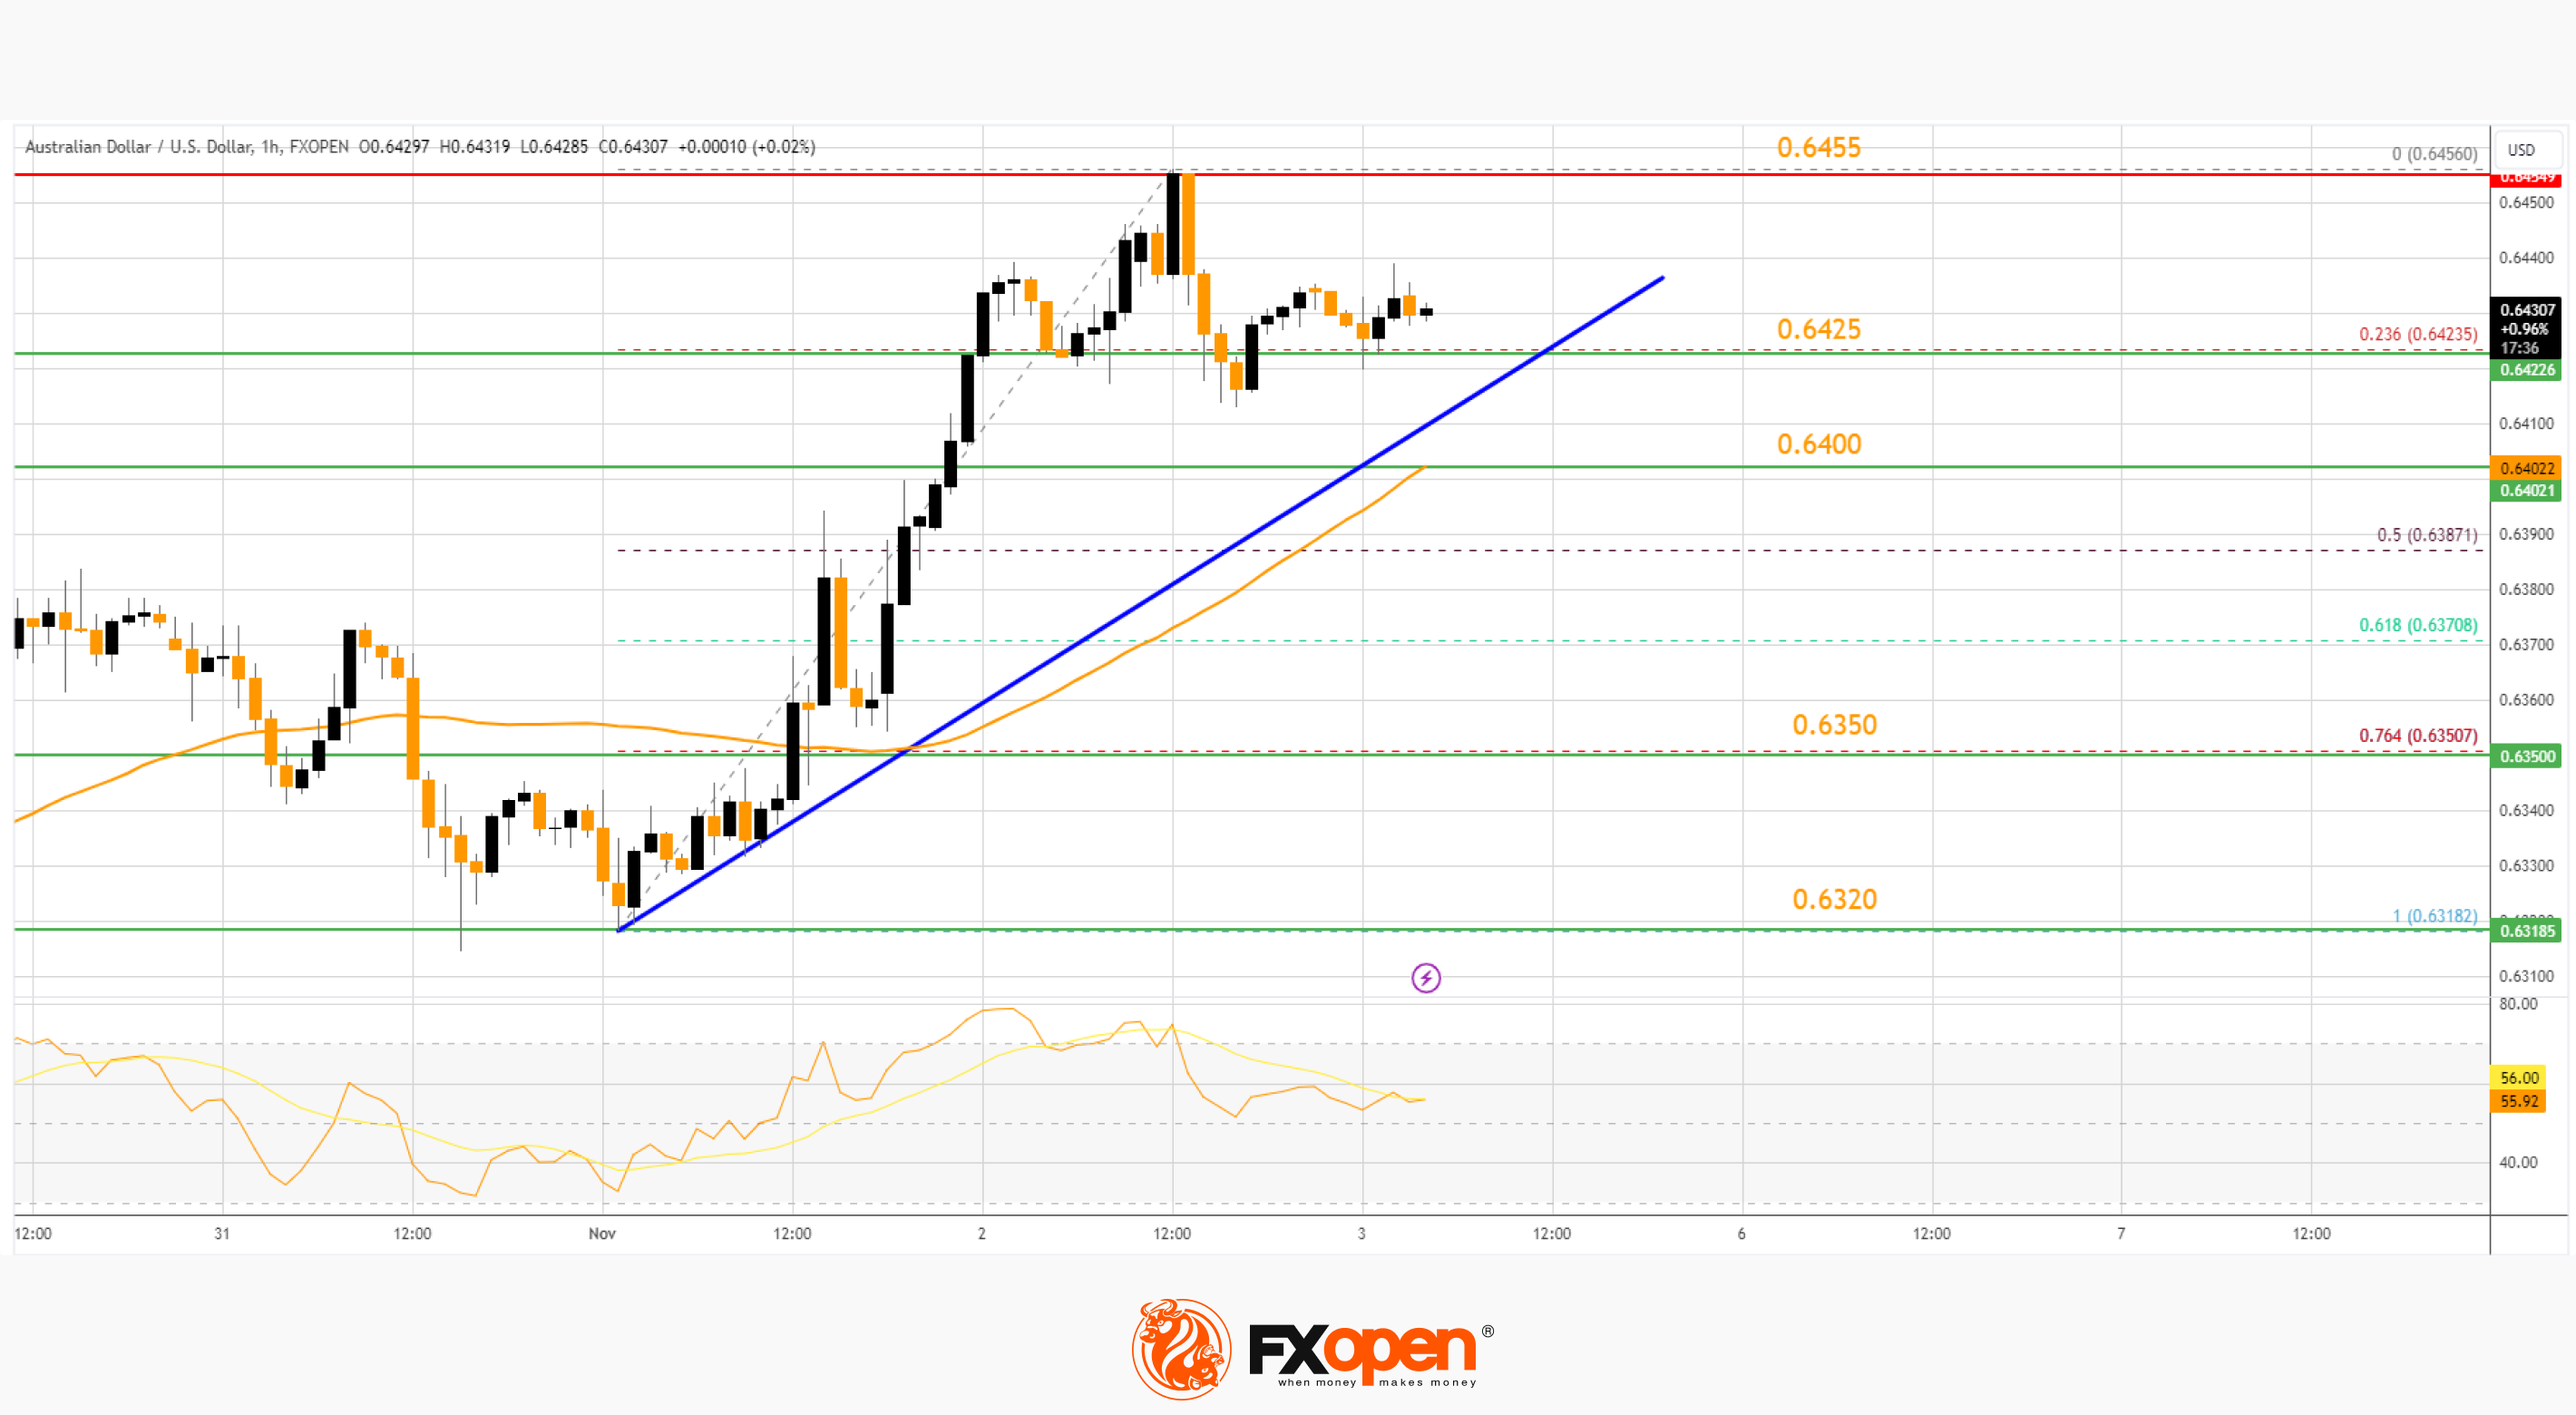
On the downside, initial support is near the 23.6% Fib retracement level of the upward move from the 0.6318 swing low to the 0.6456 high at 0.6425. There is also a connecting bullish trend line forming with support near the same zone.
The next support could be the 50-hour simple moving average at 0.6400. If there is a downside break below the 0.6400 support, the pair could extend its decline toward the 76.4% Fib retracement level of the upward move from the 0.6318 swing low to the 0.6456 high at 0.6350.
Any more losses might signal a move toward 0.6320. On the upside, the AUD/USD chart indicates that the pair is now facing resistance near 0.6455.
The first major resistance might be 0.6480. An upside break above the 0.6480 resistance might send the pair further higher. The next major resistance is near the 0.6550 level. Any more gains could clear the path for a move toward the 0.6620 resistance zone.
NZD/USD Technical Analysis
On the hourly chart of NZD/USD on FXOpen, the pair started a steady increase from the 0.5790 level. The New Zealand Dollar broke the 0.5820 resistance to start the recent increase against the US Dollar.
The pair settled above 0.5850 and the 50-hour simple moving average. It tested the 0.5915 zone and is currently consolidating gains above the 23.6% Fib retracement level of the upward wave from the 0.5788 swing low to the 0.5916 high.
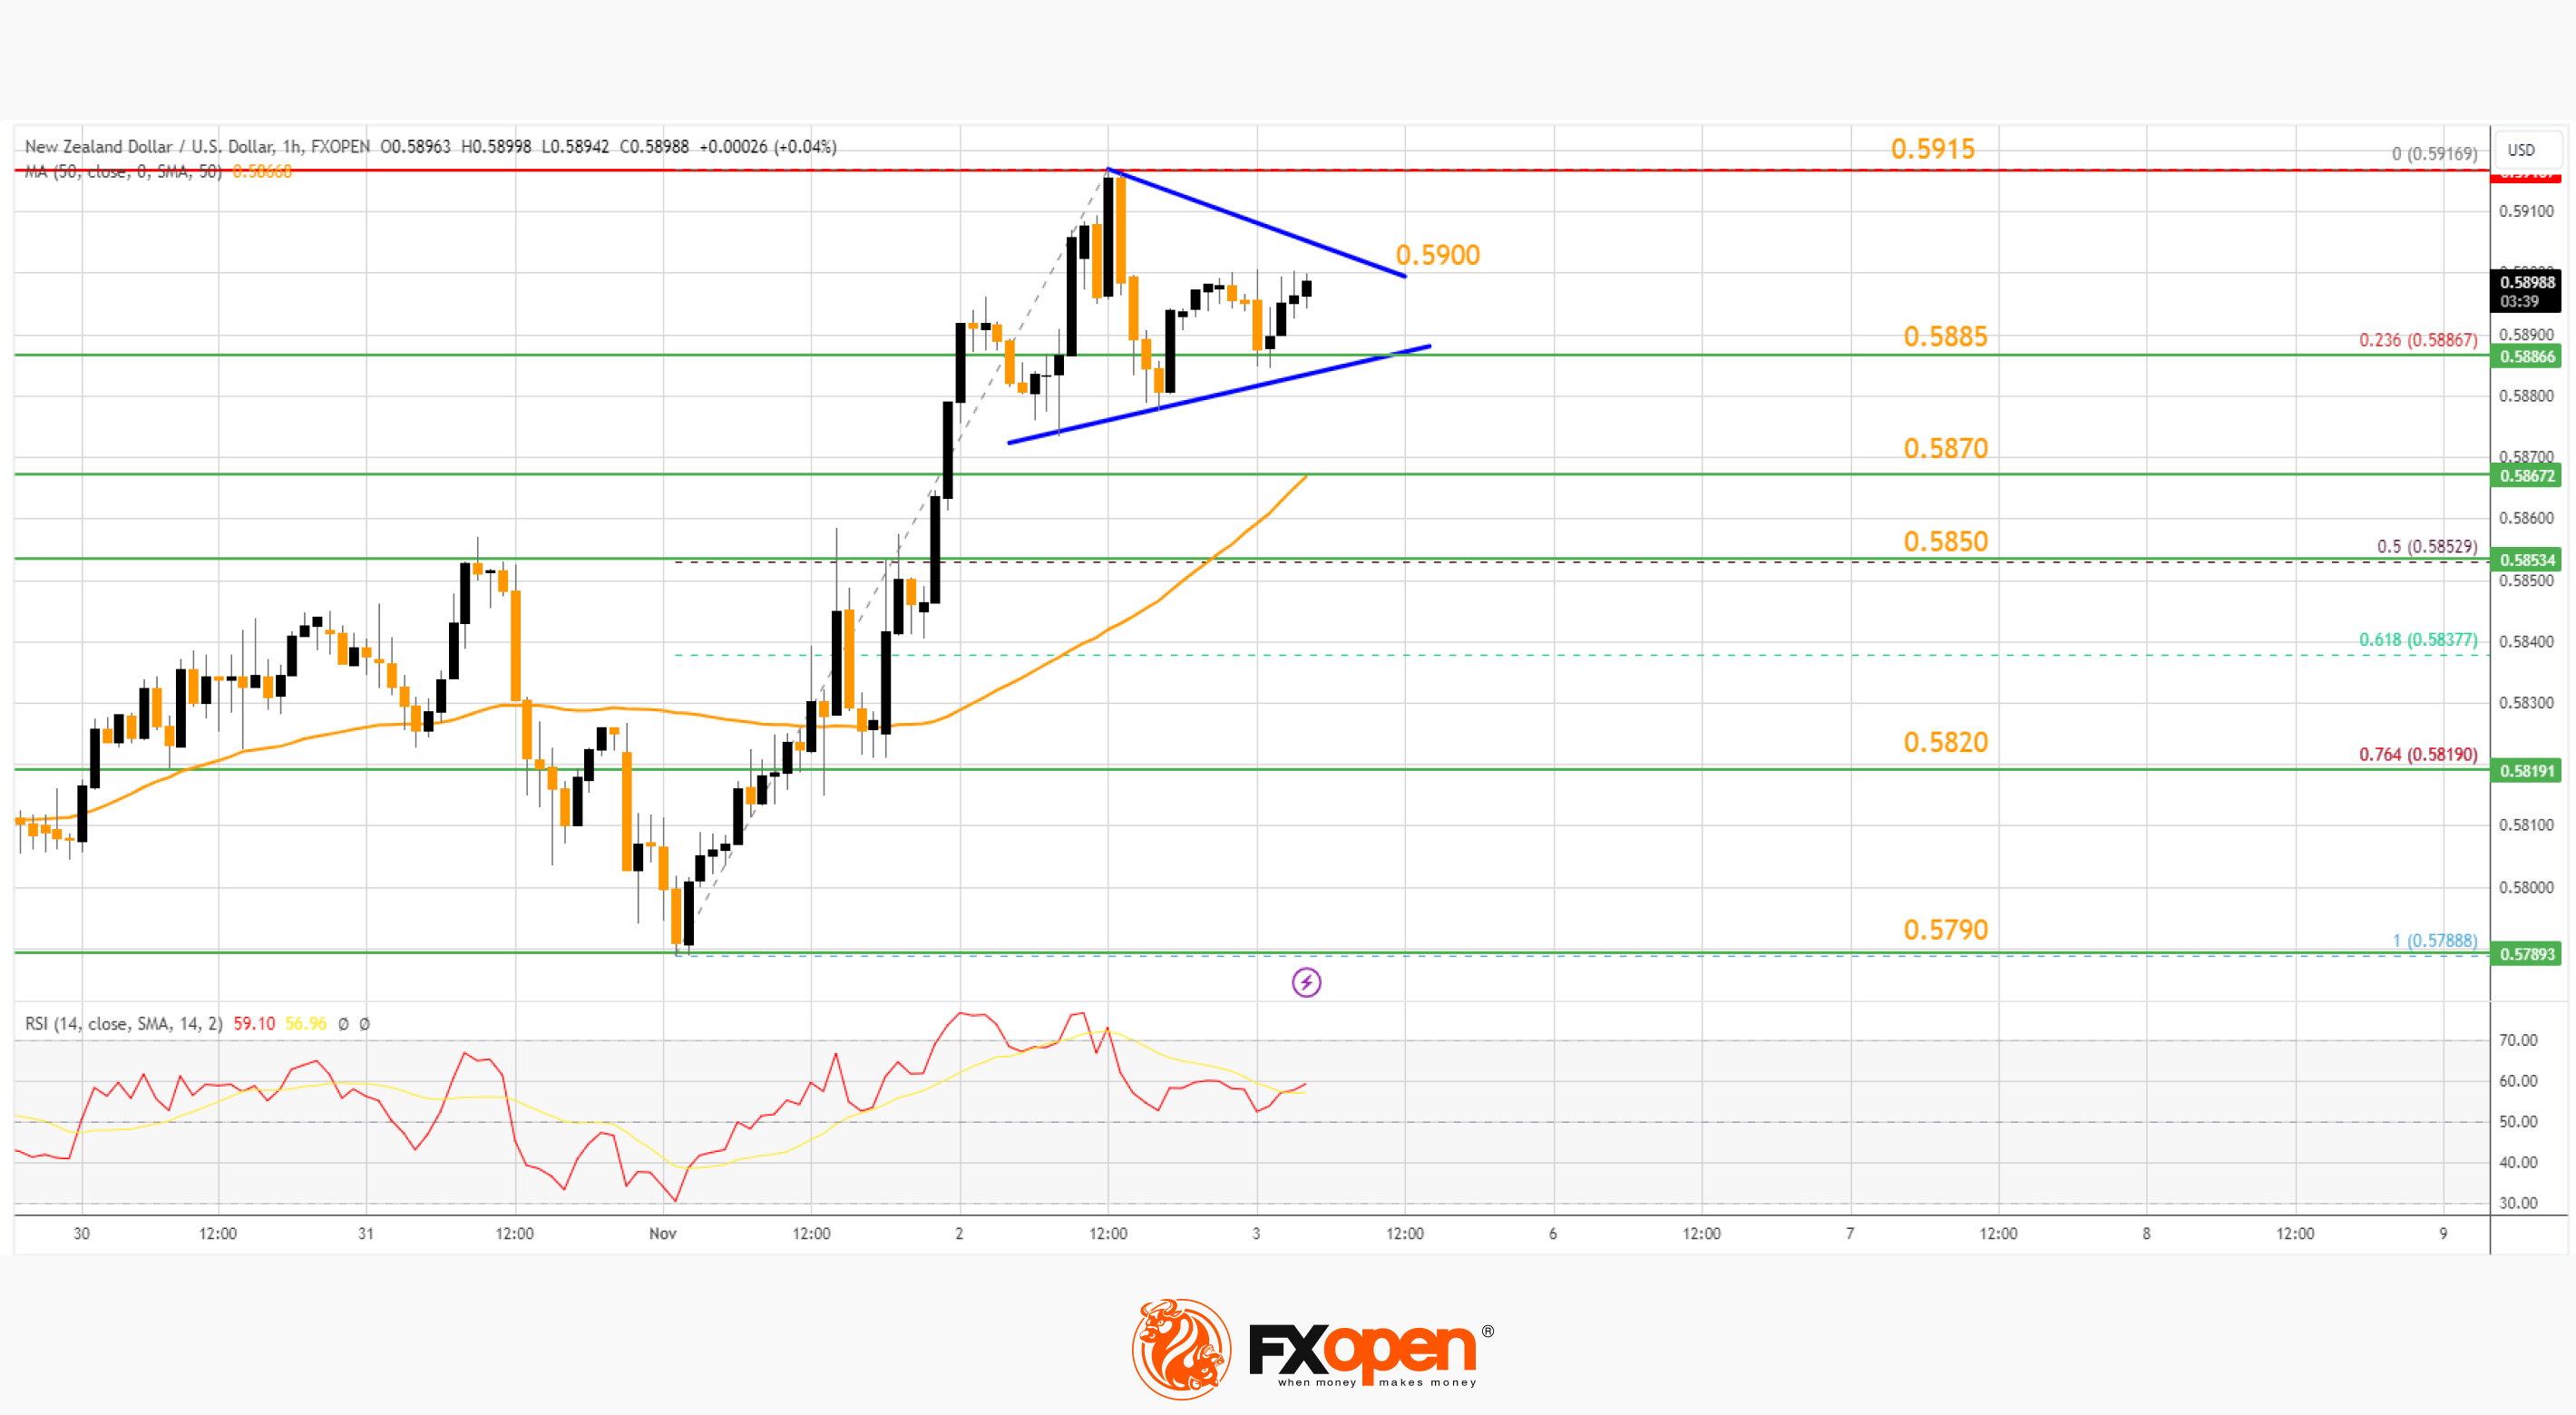
The NZD/USD chart suggests that the RSI is still above 50 and signaling more upsides. On the upside, the pair might struggle near 0.5900. The next major resistance is near the 0.5915 level.
A clear move above the 0.5915 level might even push the pair toward the 0.5950 level. Any more gains might clear the path for a move toward the 0.6000 resistance zone in the coming days.
On the downside, there is major support forming near a short-term contracting triangle at 0.5885. The next major support is near the 50-hour simple moving average at 0.5870, below which the pair might test the 50% Fib retracement level of the upward wave from the 0.5788 swing low to the 0.5916 high at 0.5850.
If there is a downside break below the 0.5850 support, the pair might slide toward the 0.5820 support. Any more losses could lead NZD/USD in a bearish zone to 0.5790.
Trade over 50 forex markets 24 hours a day with FXOpen. Take advantage of low commissions, deep liquidity, and spreads from 0.0 pips (additional fees may apply). Open your FXOpen account now or learn more about trading forex with FXOpen.
This article represents the opinion of the Companies operating under the FXOpen brand only. It is not to be construed as an offer, solicitation, or recommendation with respect to products and services provided by the Companies operating under the FXOpen brand, nor is it to be considered financial advice.
Stay ahead of the market!
Subscribe now to our mailing list and receive the latest market news and insights delivered directly to your inbox.


Latest articles

Dow Jones (DJIA): Consolidation Beyond the Trend
Federal Reserve Chair Kevin Warsh testified before Congress on 14–15 July, reaffirming the Fed's commitment to bringing inflation back to target while providing no clear guidance on the future path of interest rates. Meanwhile, June inflation data came in

European Currencies Strengthen Ahead of Key Macroeconomic Releases
EUR/USD and GBP/USD continue to recover moderately following the recent weakening of the US dollar. European currencies have been supported by expectations that US inflationary pressures will continue to ease after softer-than-expected CPI and PPI data, reinforcing market

Brent Crude Oil: From Ceasefire to Crossfire — What's Next?
Just weeks ago, traders were pricing in peace. Now they're pricing in war again—and that reversal says everything about how fragile the current Middle East calm really is.
Brent crude has surged to $86 a barrel, its highest level