


FXOpen

AUD/USD is attempting a recovery wave from 0.6590. NZD/USD could gain bullish momentum if there is a clear move above the 0.6150 resistance.
Important Takeaways for AUD/USD and NZD/USD Analysis Today
· The Aussie Dollar found support near 0.6590 and is now recovering against the US Dollar.
· There was a break above a key bearish trend line with resistance at 0.6630 on the hourly chart of AUD/USD at FXOpen.
· NZD/USD is attempting a recovery wave above the 0.6110 resistance.
· There is a major bearish trend line forming with resistance near 0.6150 on the hourly chart of NZD/USD at FXOpen.
AUD/USD Technical Analysis
On the hourly chart of AUD/USD at FXOpen, the pair dipped from the 0.6700 resistance zone. The Aussie Dollar declined below 0.6660, but the bulls were active near 0.6600 against the US Dollar.
A low was formed near 0.6590 and the pair is now correcting losses. There was a move above the 50% Fib retracement level of the downward move from the 0.6704 swing high to the 0.6585 low. There was also a break above a key bearish trend line with resistance at 0.6630.
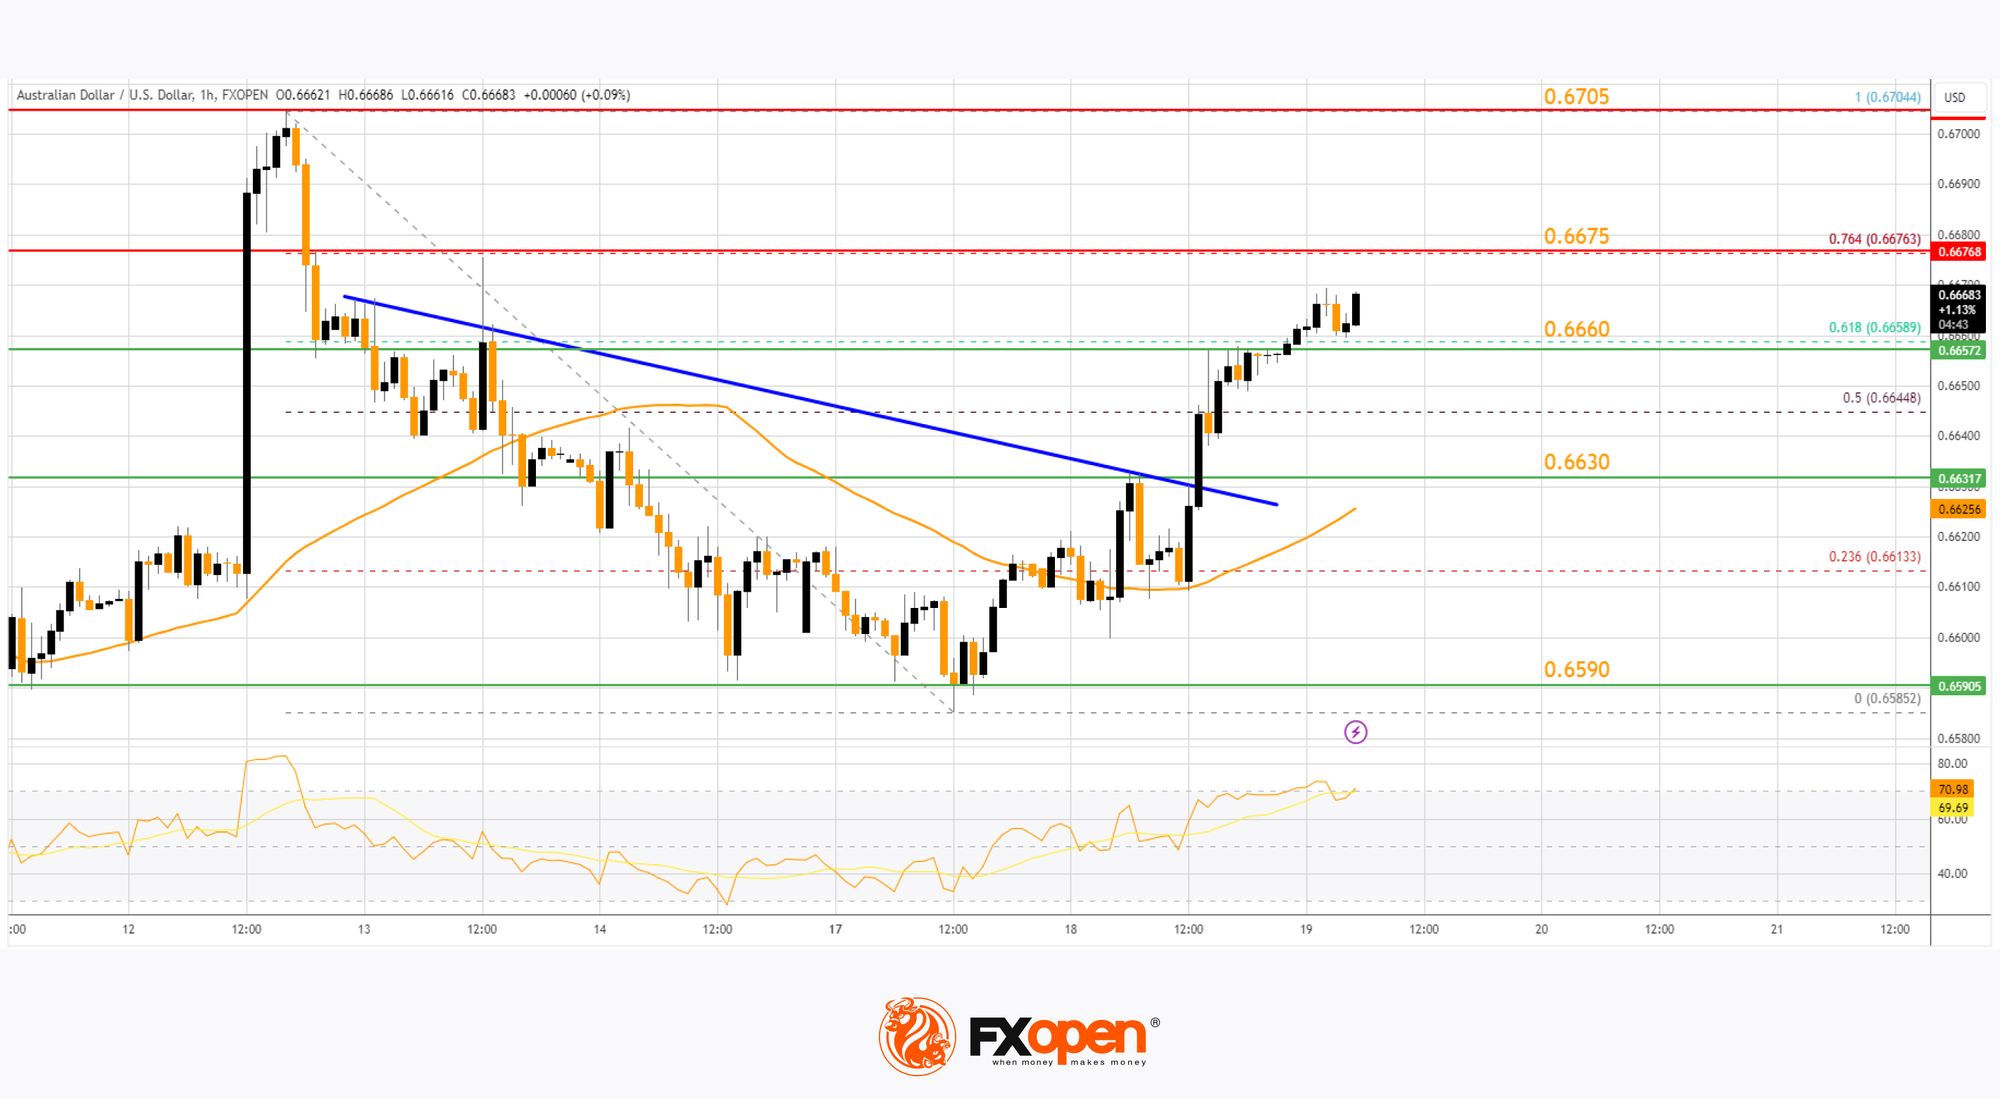
The pair is now above 0.6660 and the 50-hour simple moving average. On the upside, immediate resistance is near the 76.4% Fib retracement level of the downward move from the 0.6704 swing high to the 0.6585 low at 0.6675.
The first major resistance is near a rising channel at 0.6705. A clear upside break above 0.6705 could send the pair toward 0.6750. The next major resistance on the AUD/USD chart is near 0.6780, above which the price could rise toward 0.6800. Any more gains might send the pair toward 0.6820.
On the downside, initial support is near 0.6660. The next support could be the 0.6630 zone or the 50-hour simple moving average. Any more losses might send the pair toward the 0.6590 support.
Read analytical AUD/USD price forecasts for 2024 and beyond.
NZD/USD Technical Analysis
On the hourly chart of NZD/USD on FXOpen, the pair also followed a similar pattern and declined from the 0.6220 zone. The New Zealand Dollar gained bearish momentum and traded below 0.6150 against the US Dollar.
The pair even dropped below the 50-hour simple moving average and tested 0.6100. A low was formed near 0.6095 and the pair is now attempting a fresh increase. It is back above the 0.6110 level and the 50-hour simple moving average.
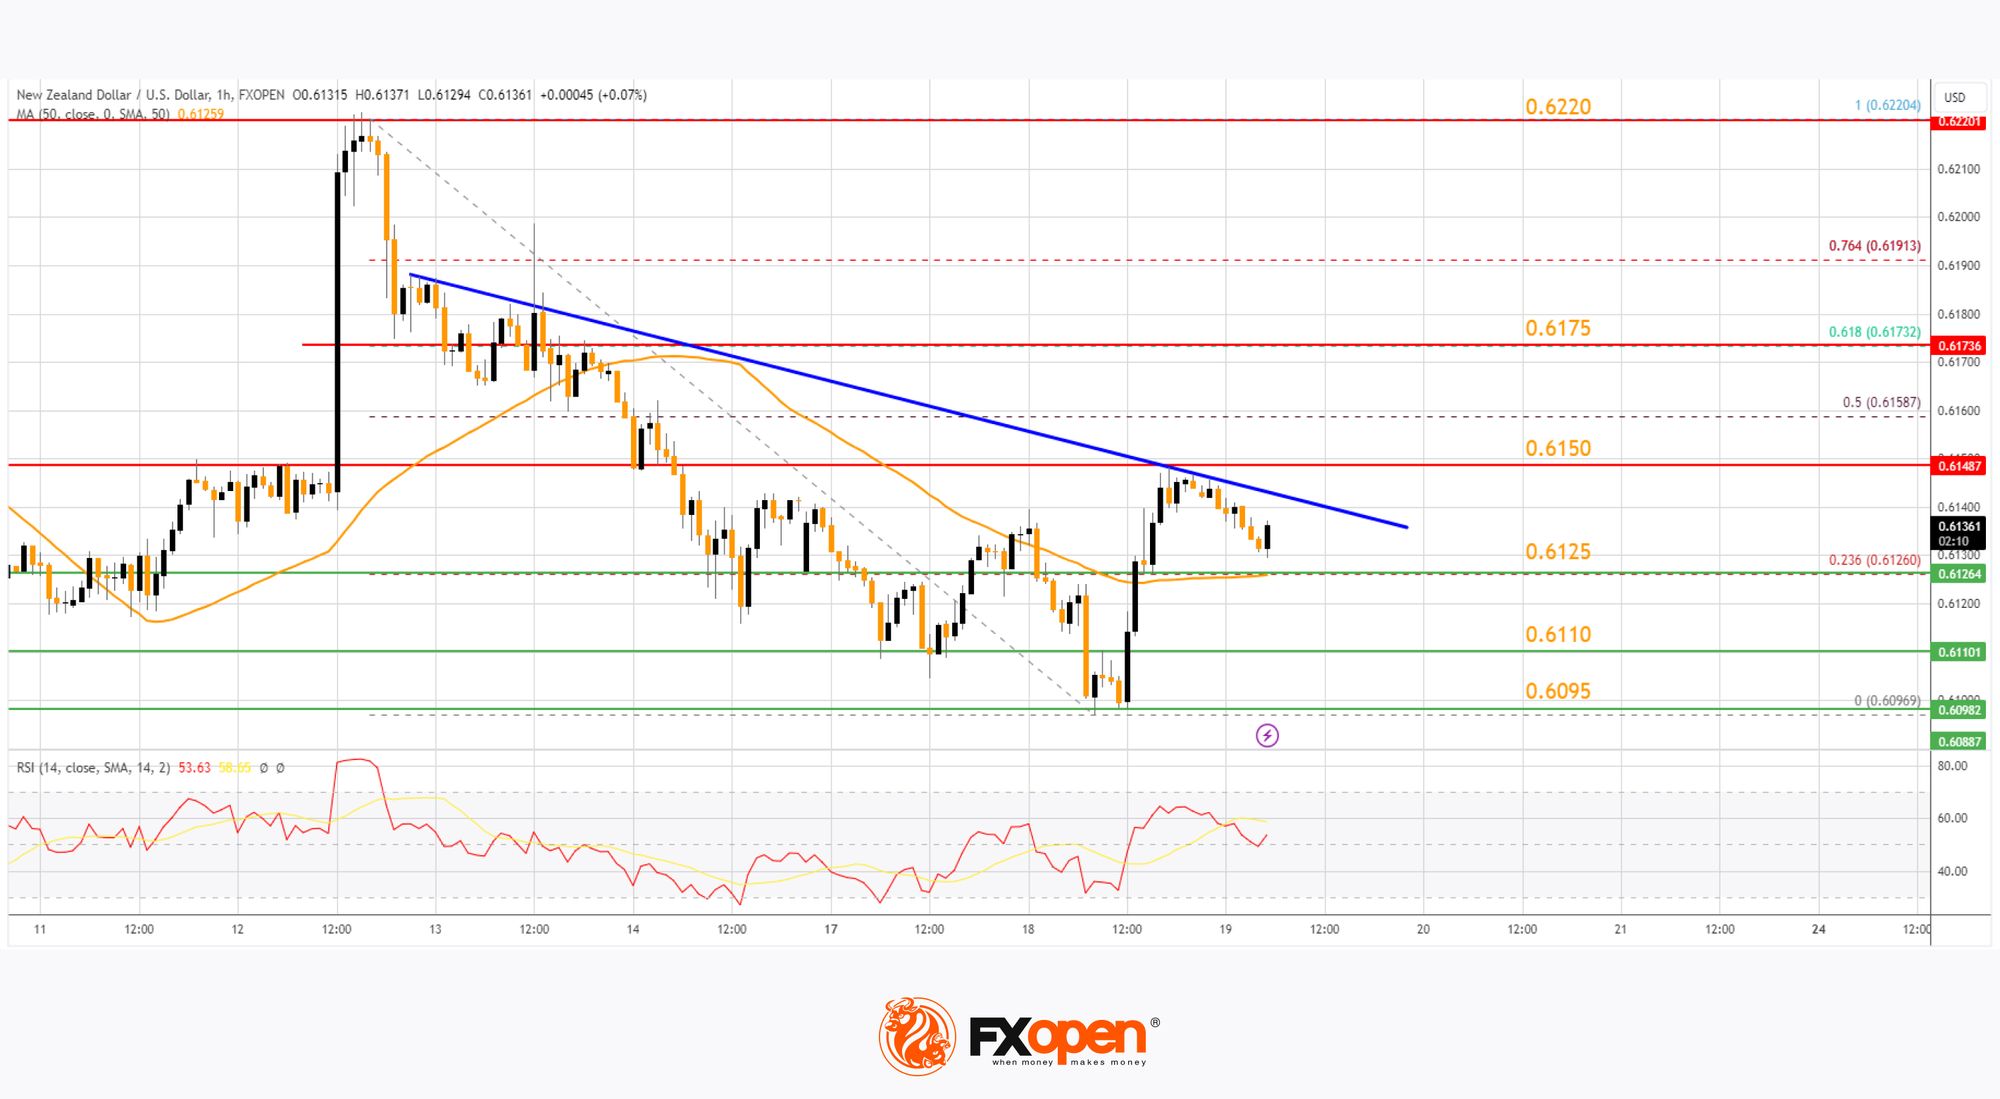
On the upside, the pair is facing resistance near the 50% Fib retracement level of the downward move from the 0.6220 swing high to the 0.6096 low. There is also a major bearish trend line forming with resistance near 0.6150.
The next major resistance is near the 61.8% Fib retracement level of the downward move from the 0.6220 swing high to the 0.6096 low at 0.6175. If there is a move above 0.6175, the pair could rise toward the 0.6220 resistance.
Any more gains might open the doors for a move toward the 0.6250 resistance zone. On the downside, immediate support on the NZD/USD chart is near 0.6125.
The next major support is near the 0.6110 zone. If there is a downside break below 0.6110, the pair could extend the decline toward the 0.6095 level. The next key support is near 0.6965.
Trade over 50 forex markets 24 hours a day with FXOpen. Take advantage of low commissions, deep liquidity, and spreads from 0.0 pips (additional fees may apply). Open your FXOpen account now or learn more about trading forex with FXOpen.
This article represents the opinion of the Companies operating under the FXOpen brand only. It is not to be construed as an offer, solicitation, or recommendation with respect to products and services provided by the Companies operating under the FXOpen brand, nor is it to be considered financial advice.
Stay ahead of the market!
Subscribe now to our mailing list and receive the latest market news and insights delivered directly to your inbox.


Latest articles

European Currencies Decline: Pound Hits New Lows, Euro Under Pressure
European currencies continue to weaken against the US dollar amid rising geopolitical tensions and increased demand for safe-haven and liquid assets. Market participants are reducing exposure to riskier instruments, putting pressure on both the euro and the pound. Additional support

Market Analysis: GBP/USD Dips Further As EUR/GBP Regains Traction
GBP/USD failed to climb above 1.3500 and corrected some gains. EUR/GBP started a decent increase and might aim for more gains above 0.8700.
Important Takeaways for GBP/USD and EUR/GBP Analysis Today
· The British Pound
