


Gold Price Holds Near Key Support
FXOpen

As the XAU/USD chart shows, the gold price has been holding within the $5,060–$5,200 range over the past several sessions.
Bullish view: the key support is the lower boundary of the long-term channel that has been in place since the beginning of 2026.
Bearish view: pressure on the price comes from statements by President Trump suggesting that the conflict in the Middle East could end soon. Yesterday, the US president described the operation in Iran as a “small incursion” and a “short-term” measure, which helped ease geopolitical risks and reduce demand for gold as a safe-haven asset.
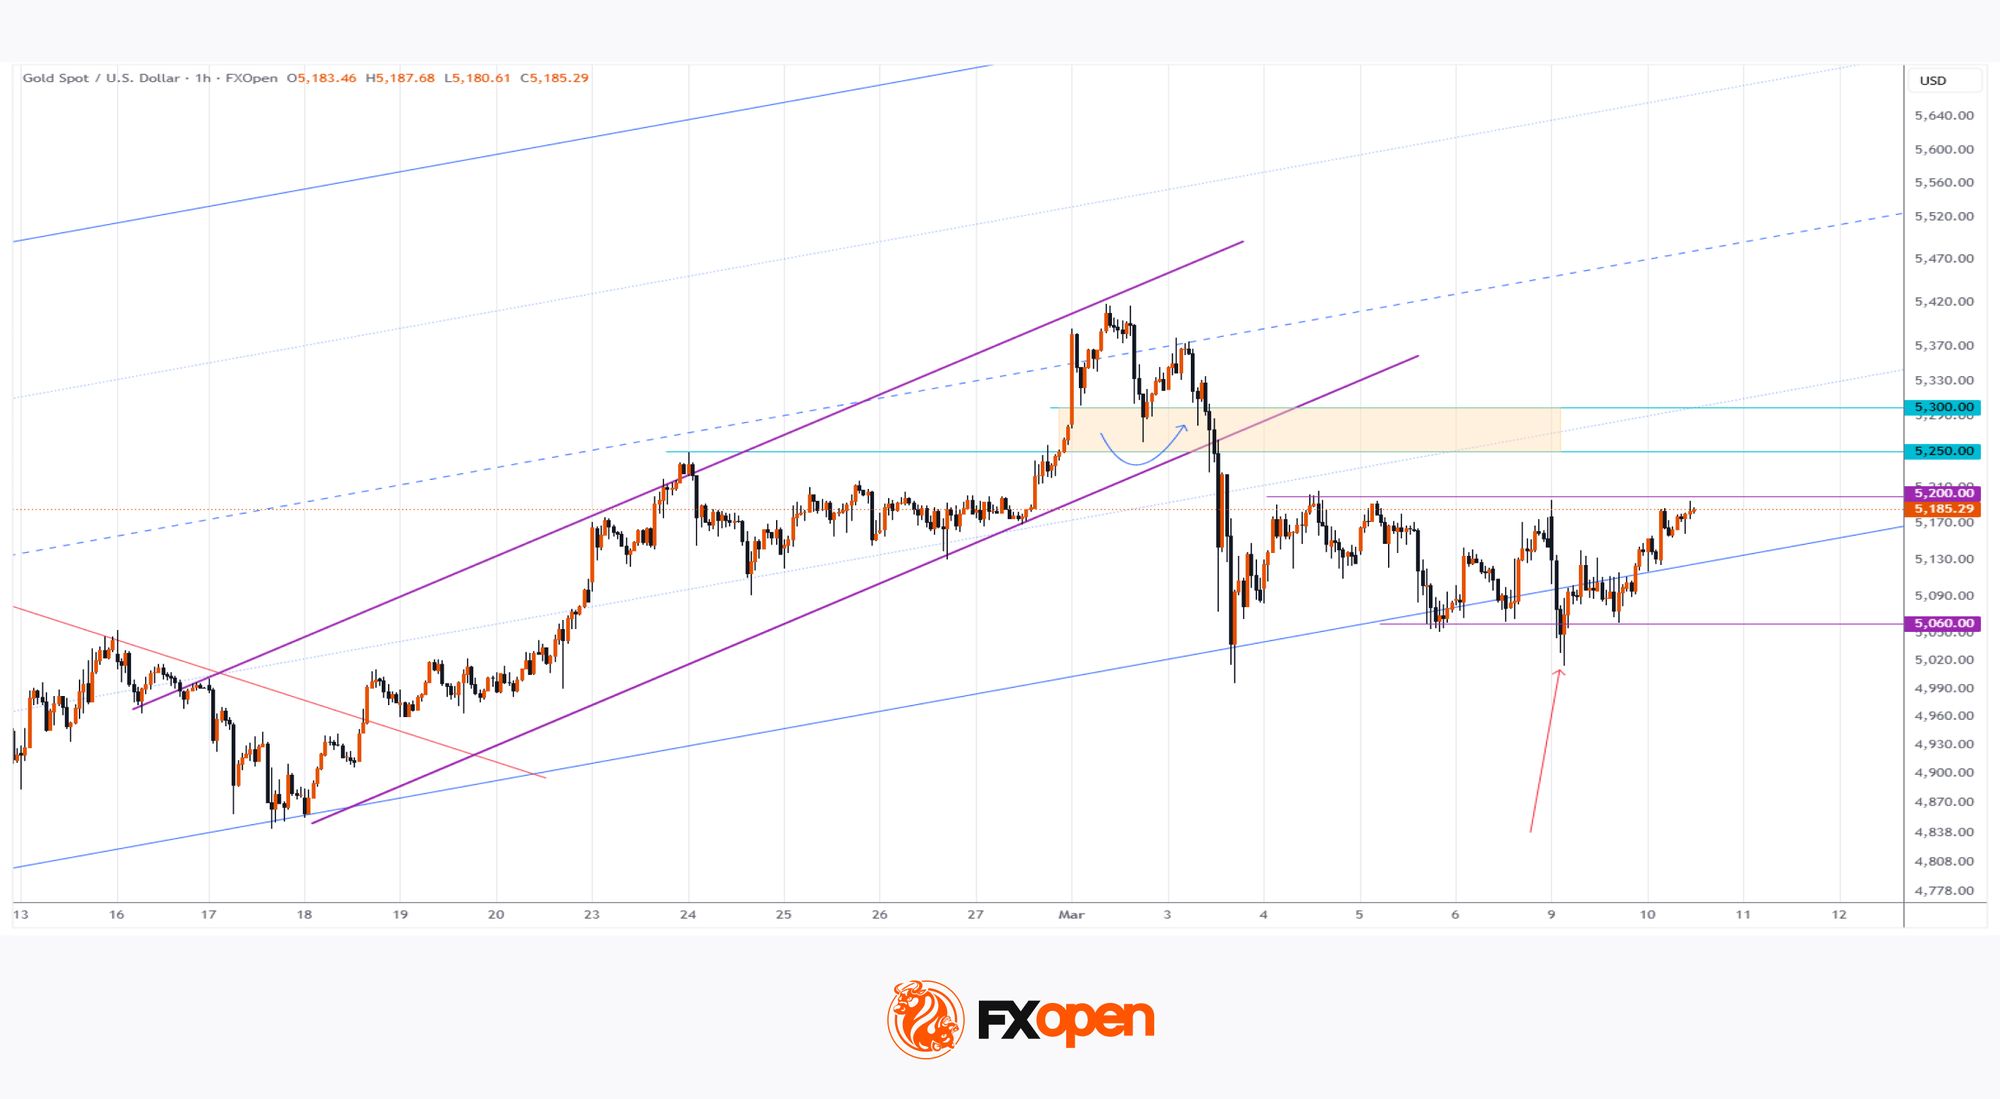
Technical Analysis of the XAU/USD Chart
On the morning of 2 March, while analysing gold price movements following the attack on Iran, we confirmed the validity of the long-term ascending channel and also:
→ drew a local purple channel;
→ noted that the price was trading in close proximity to resistance lines;
→ suggested that emotions would settle and that the gold price might pull back, with support likely emerging in the $5,250–$5,300 area.
Indeed, later that evening the indicated zone acted as local support (shown by the blue arrow), but by 3 March the pullback had extended to the lower boundary of the blue channel.
It is worth noting that yesterday’s attempt by the bears (marked by the red arrow) failed to gain continuation — a sign that selling pressure may be weakening. Therefore, it would be reasonable to expect bulls to attempt to regain the initiative. A closer look at the XAU/USD chart also reveals that yesterday’s rising local lows form a cup-and-handle pattern.
At the same time, in the near term an important test of bullish intent may come at the breakout level of the purple channel around the $5,250 mark.
Start trading commodity CFDs with tight spreads (additional fees may apply). Open your trading account now or learn more about trading commodity CFDs with FXOpen.
This article represents the opinion of the Companies operating under the FXOpen brand only. It is not to be construed as an offer, solicitation, or recommendation with respect to products and services provided by the Companies operating under the FXOpen brand, nor is it to be considered financial advice.
Stay ahead of the market!
Subscribe now to our mailing list and receive the latest market news and insights delivered directly to your inbox.


Latest articles

EUR/USD: All Eyes on the Fed as the Range Reaches Its Breaking Point
The dollar's next move hinges on tonight's Fed decision, and this time markets genuinely don't know what to expect. While economists still lean toward a hold—with CME FedWatch odds sitting near 68.5% for no change—Kevin Warsh's hawkish

USD/JPY and USD/CAD Test Resistance Ahead of Fresh Fed Signals
The US dollar continues to hold the upper hand against most major currencies ahead of the outcome of the latest Federal Reserve meeting. While the base-case scenario remains for interest rates to stay unchanged, markets are also pricing in the

Amazon Earnings: Does the Chart Already Know Something the Numbers Don't?
All eyes are on July 30, when Amazon reports Q2 2026 earnings, with Wall Street increasingly convinced the bar has been set too low. Consensus sees EPS near $1.82-$2.26 on roughly $197 billion in revenue, but the