


Market Analysis: AUD/USD and NZD/USD Signal Downside Continuation
FXOpen

AUD/USD declined below the 0.6450 and 0.6430 support levels. NZD/USD is also moving lower and might trade below the 0.5900 zone.
Important Takeaways for AUD/USD and NZD/USD Analysis Today
· The Aussie Dollar started a fresh decline from well above the 0.6480 level against the US Dollar.
· There was a break below a key bullish trend line with support near 0.6430 on the hourly chart of AUD/USD at FXOpen.
· NZD/USD declined heavily from the 0.5985 resistance zone.
· There was a break below a major bullish trend line with support near 0.5945 on the hourly chart of NZD/USD at FXOpen.
AUD/USD Technical Analysis
On the hourly chart of AUD/USD at FXOpen, the pair struggled to clear the 0.6500 zone. The Aussie Dollar started a fresh decline below the 0.6450 support against the US Dollar.
There was a break below a key bullish trend line with support near 0.6430. The pair even settled below 0.6430 and the 50-hour simple moving average. The pair is now showing bearish signs and trading near the last swing low at 0.6410.
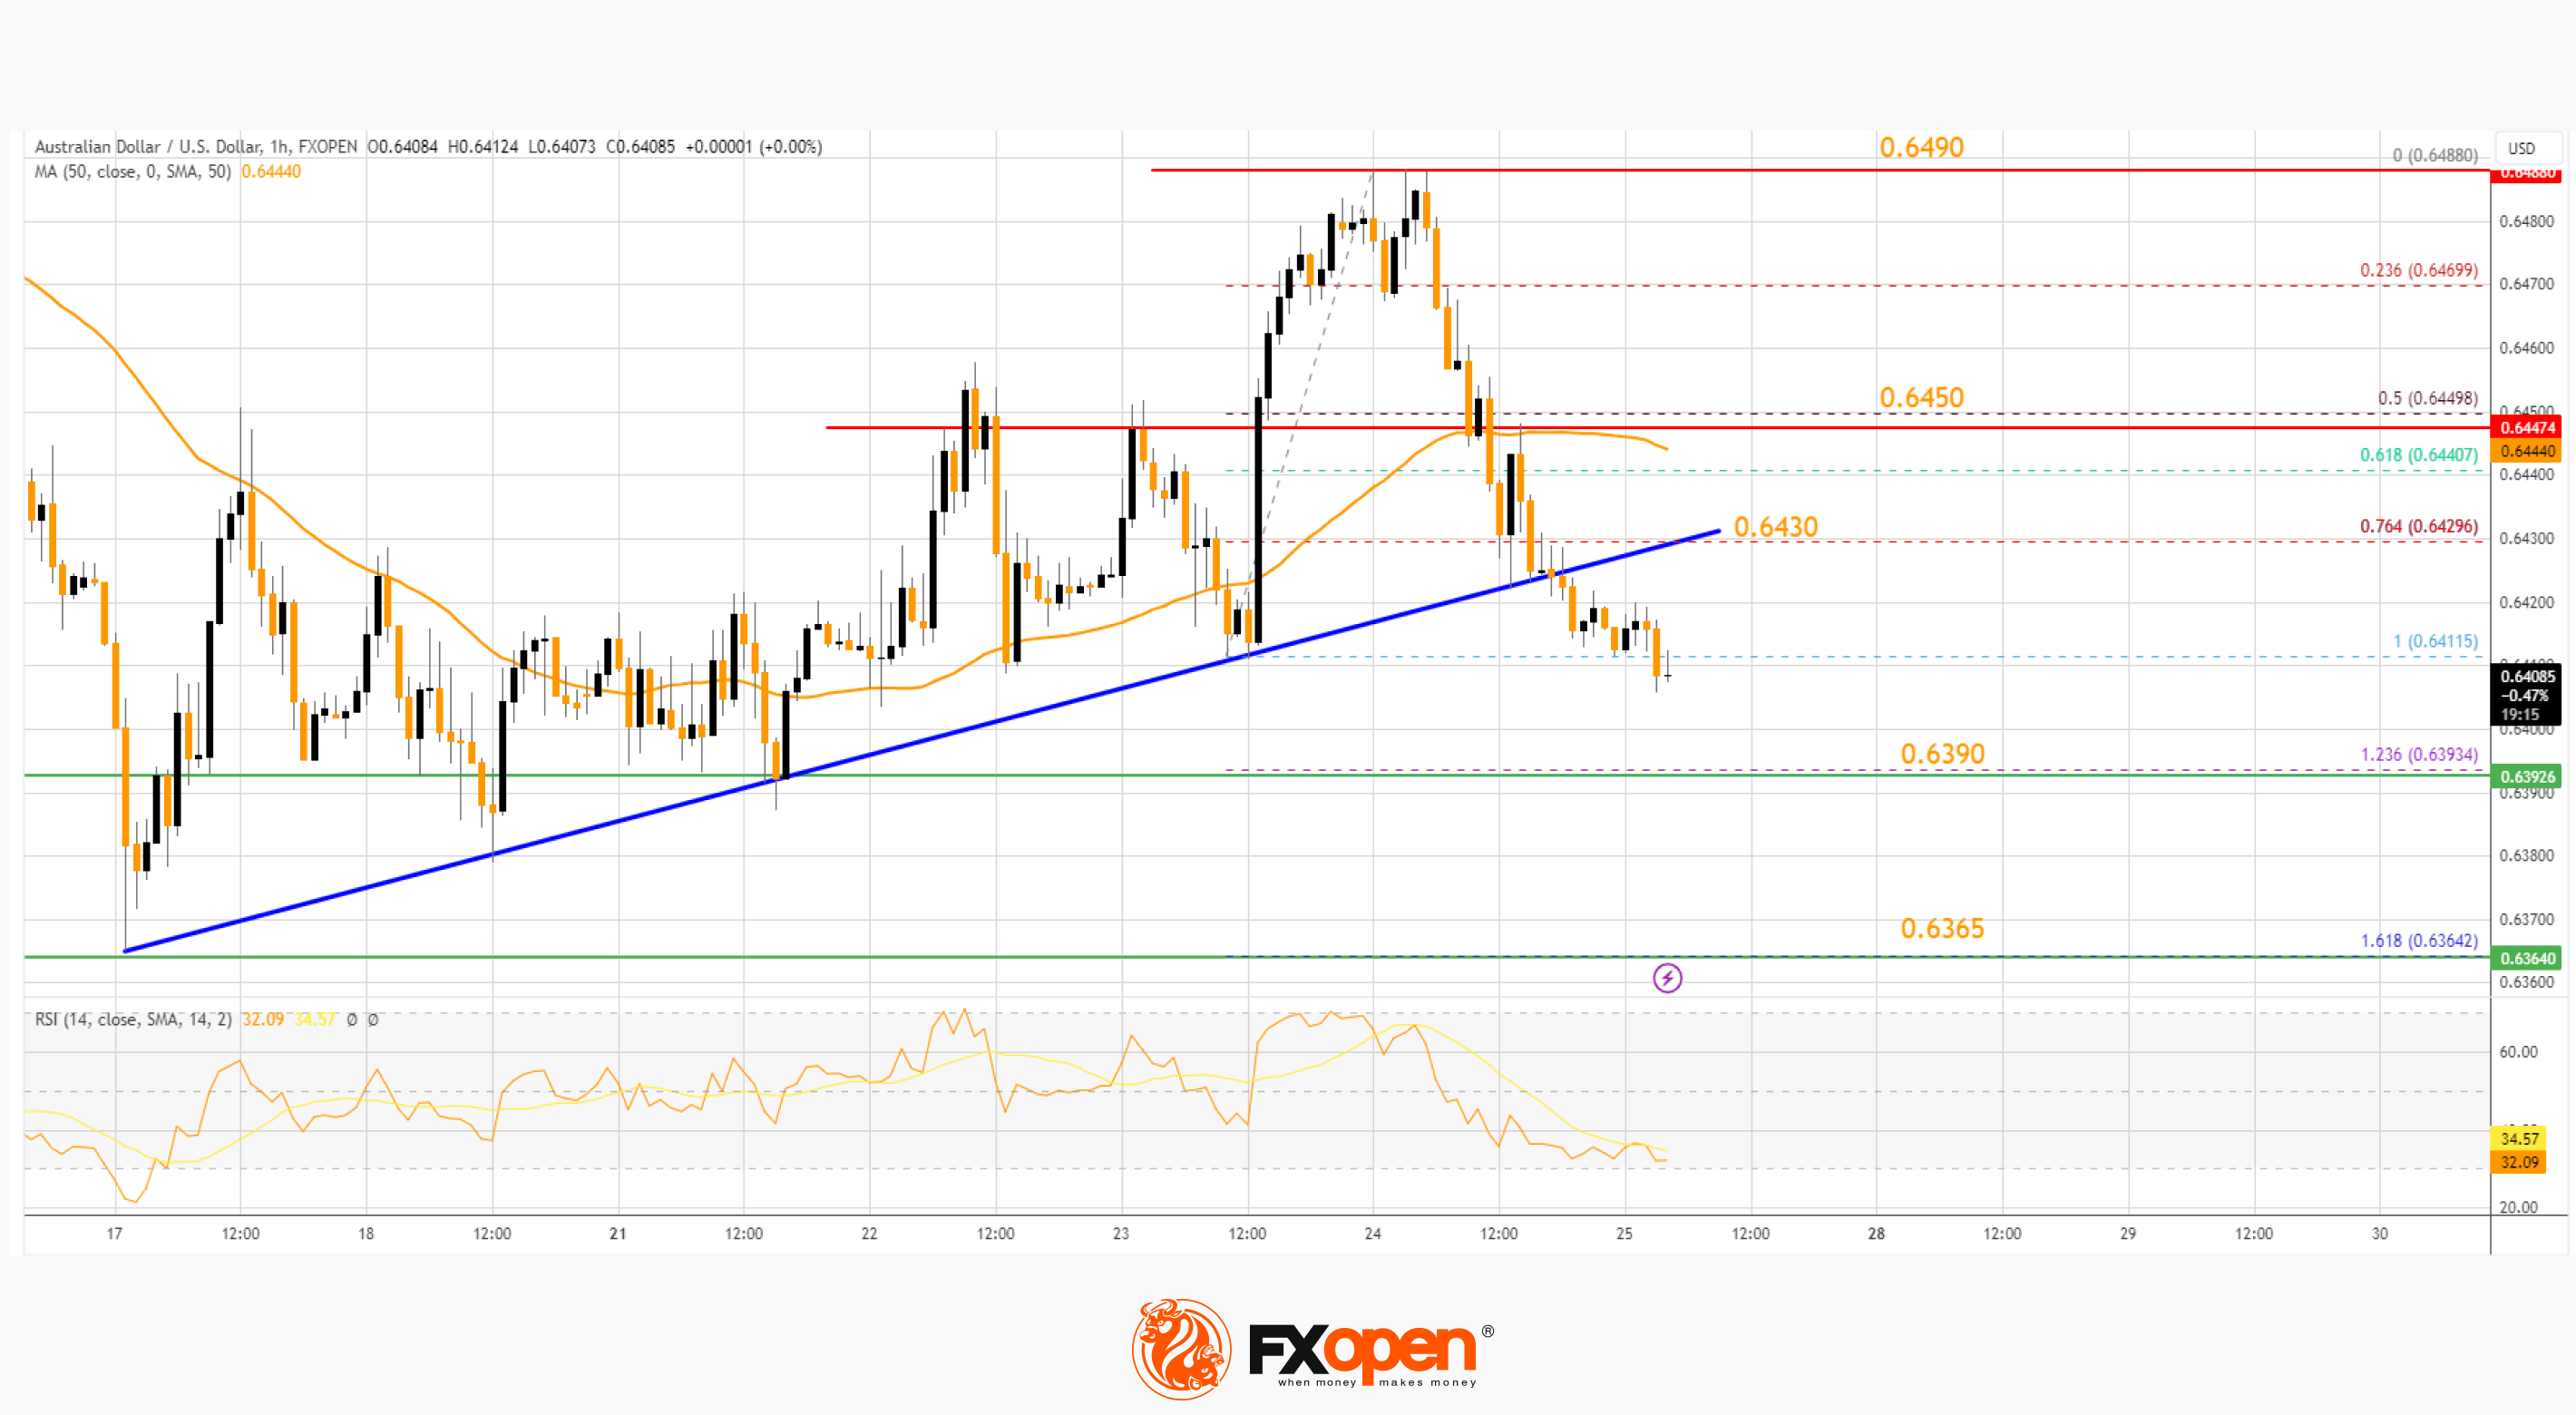
On the downside, initial support is near the 1.236 Fib extension level of the upward move from the 0.6411 swing low to the 0.6490 high at 0.6390. If there is a downside break below 0.6390, the pair could extend its decline.
The next support could be the 1.618 Fib extension level of the upward move from the 0.6411 swing low to the 0.6490 high at 0.6365. Any more losses might send the pair toward the 0.6320 support.
On the upside, an immediate resistance is near 0.6430. The next major resistance is near the 50-hour simple moving average at 0.6450, above which the price could rise toward 0.6490. Any more gains might send the pair toward 0.6550.
A close above the 0.6550 level could start another steady increase in the near term. The next major resistance on the AUD/USD chart could be 0.6620.
NZD/USD Technical Analysis
On the hourly chart of NZD/USD on FXOpen, the pair also followed a similar pattern and declined from the 0.5985 zone. The New Zealand Dollar gained bearish momentum and traded below 0.5950 against the US Dollar.
There was a break below a major bullish trend line with support near 0.5945 and the 50-hour simple moving average. The pair settled below the 61.8% Fib retracement level of the upward move from the 0.5896 swing low to the 0.5985 high.
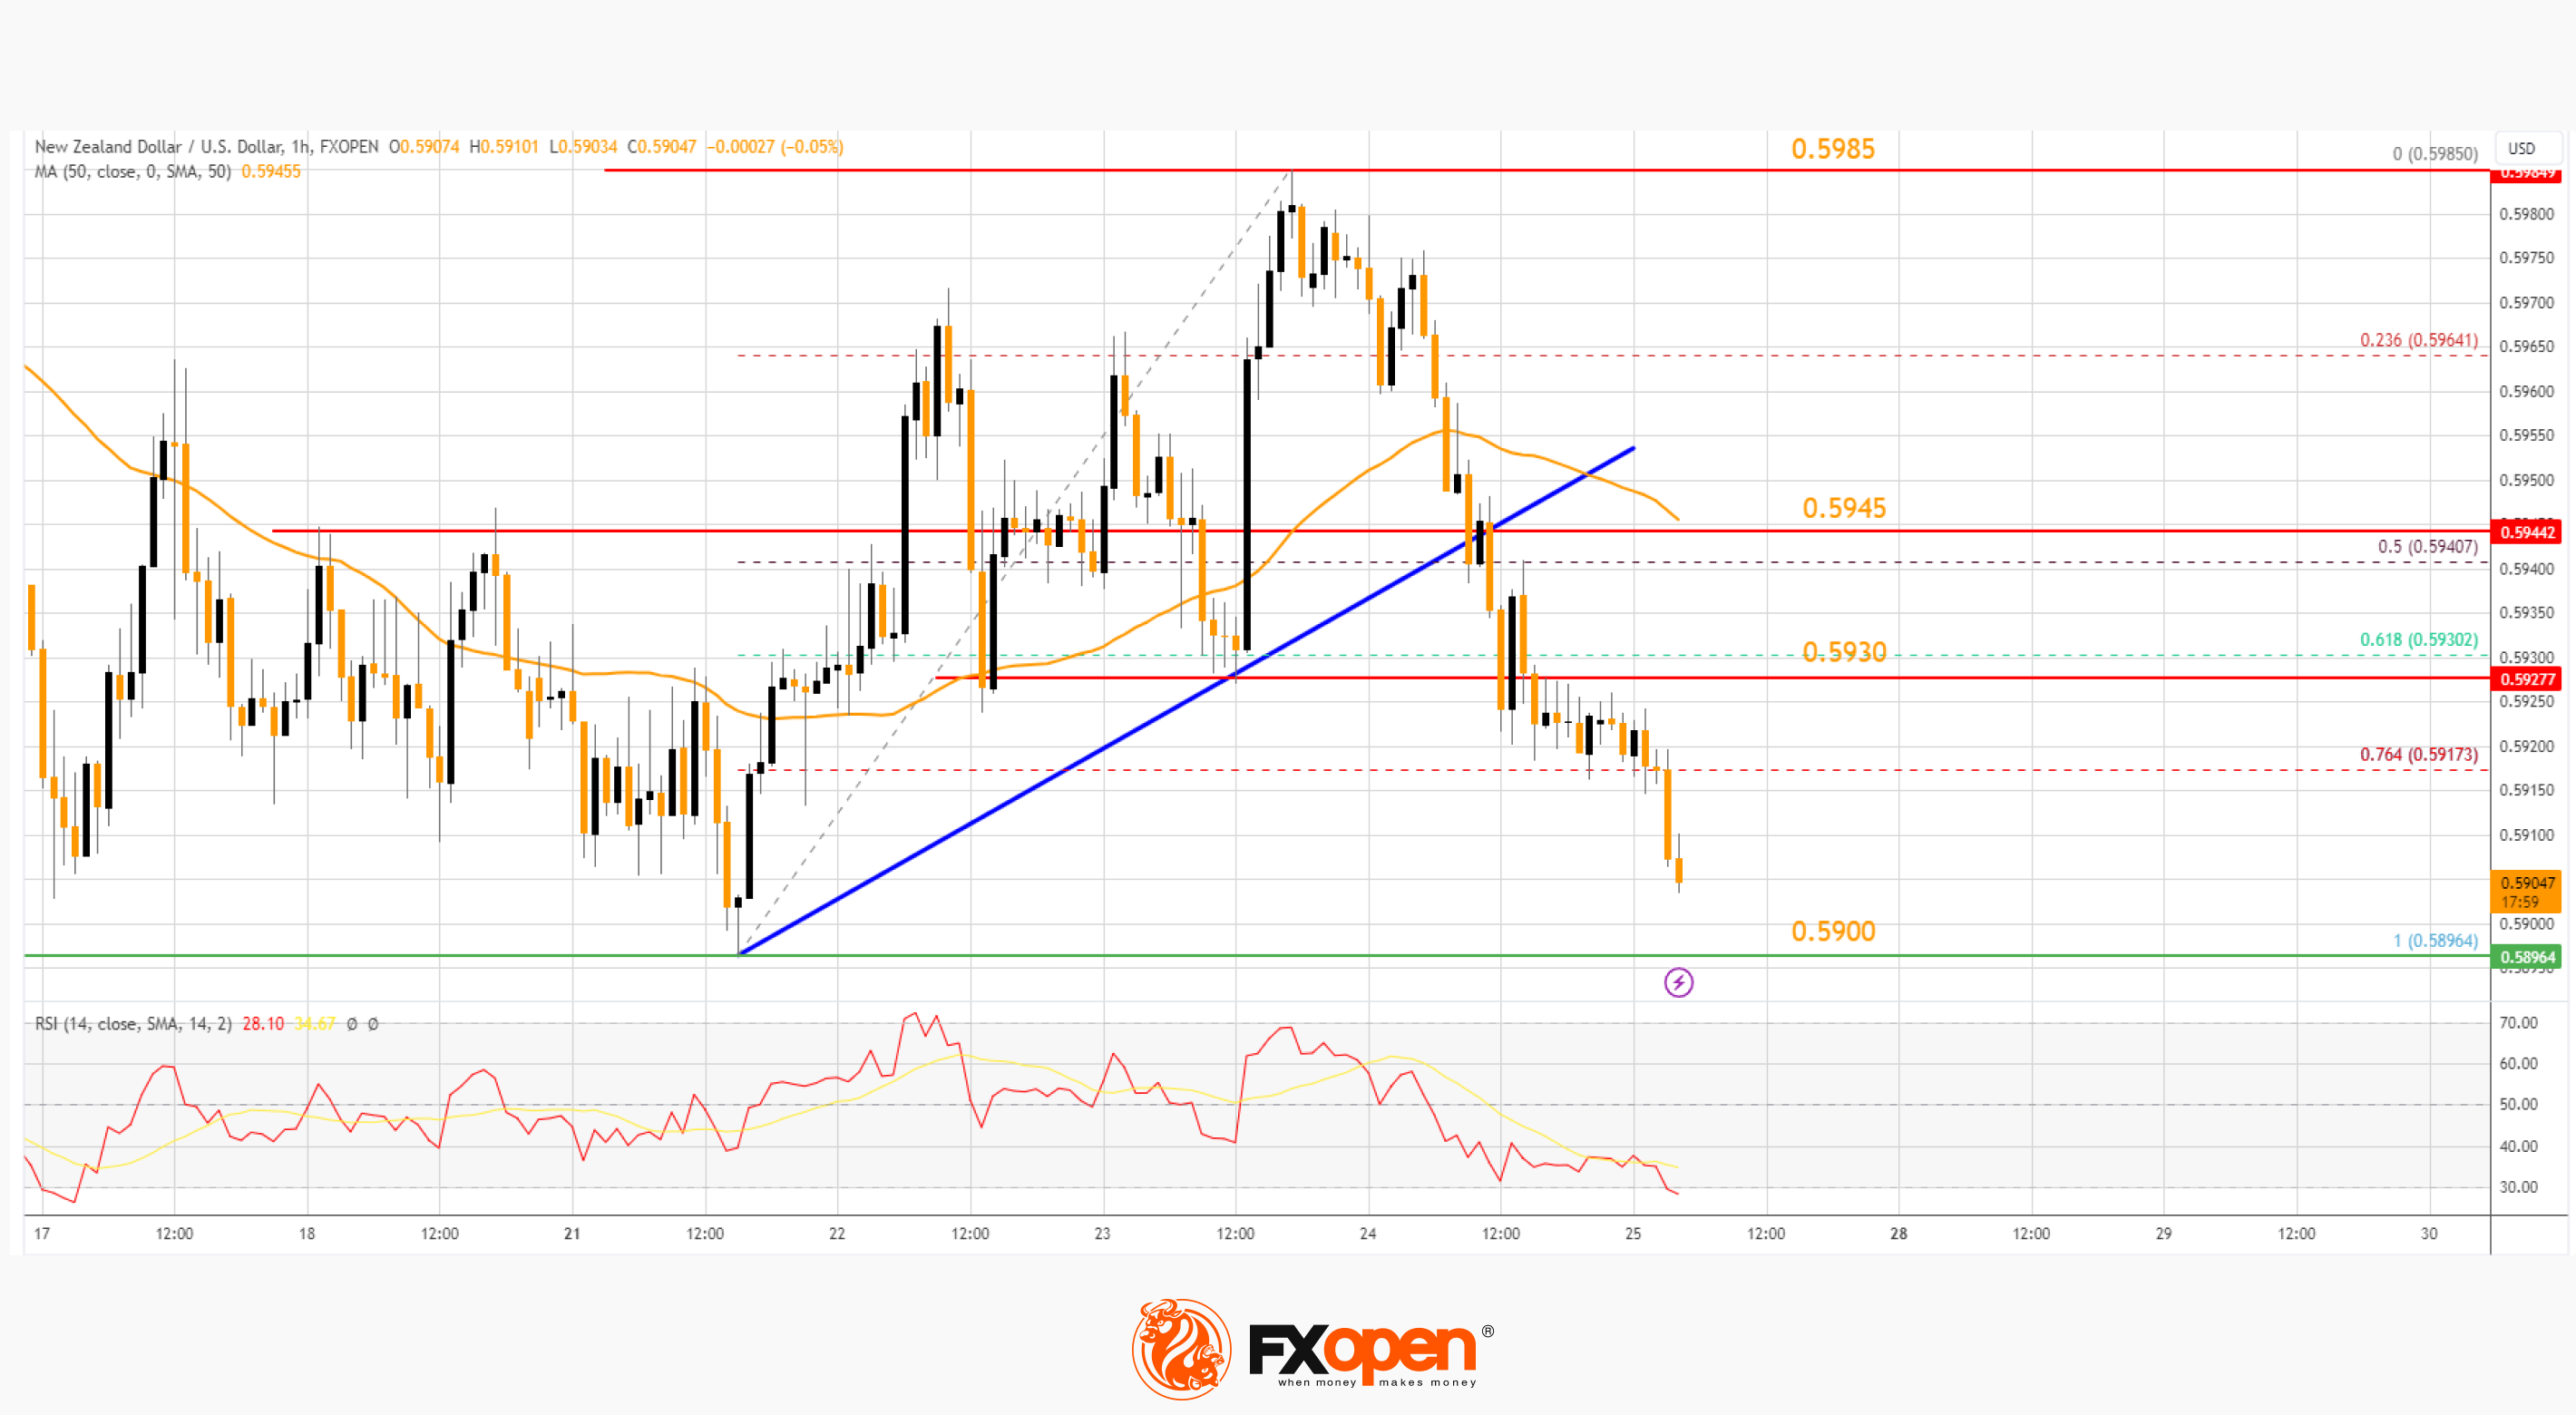
The current price action suggests a high chance of more losses below the 76.4% Fib retracement level of the upward move from the 0.5896 swing low to the 0.5985 high.
On the downside, immediate support on the NZD/USD chart is near the 0.5900 level. The next major support is near the 0.5865 zone. If there is a downside break below 0.5865, the pair could extend its decline toward the 0.5840 level. The next key support is near 0.5800.
Immediate resistance on the upside is near 0.5930. If there is a move above 0.5930, the pair could rise toward the 50-hour simple moving average at 0.5945. Any more gains might open the doors for a move toward the 0.5985 resistance zone in the coming days.
Trade over 50 forex markets 24 hours a day with FXOpen. Take advantage of low commissions, deep liquidity, and spreads from 0.0 pips (additional fees may apply). Open your FXOpen account now or learn more about trading forex with FXOpen.
This article represents the opinion of the Companies operating under the FXOpen brand only. It is not to be construed as an offer, solicitation, or recommendation with respect to products and services provided by the Companies operating under the FXOpen brand, nor is it to be considered financial advice.
Stay ahead of the market!
Subscribe now to our mailing list and receive the latest market news and insights delivered directly to your inbox.


Latest articles

Weekly Market Insights with Gary Thomson: The Week of Central Banks and Earnings
In this video, we’ll explore the key economic events and market trends, shaping the financial landscape. Get ready for insights into financial markets to help you navigate the week ahead. Let’s dive in!
In this episode of Market

Intel at a Crossroads: Earnings Beat Meets Technical Resistance
Intel has just delivered its strongest quarter in over fifteen years, and the market reaction says it all. Q2 2026 revenue surged 25% year-over-year to $16.1 billion, crushing the consensus estimate of $14.42 billion, while adjusted EPS of

Tesla: Complex Range Structure Breaks Down Following Quarterly Earnings
Tesla released its Q2 2026 results after the market closed on 22 July. Revenue increased 26% year-on-year to $28.24 billion, while vehicle deliveries reached a record 480,126 units. However, operating margin fell sharply to 1.4%, down from