


Market Analysis: AUD/USD and NZD/USD Signal More Downsides
FXOpen

AUD/USD declined below the 0.6355 and 0.6330 support levels. NZD/USD is also moving lower and might trade below the 0.5800 zone.
Important Takeaways for AUD/USD and NZD/USD Analysis Today
· The Aussie Dollar started a fresh decline from well above the 0.6355 level against the US Dollar.
· There is a key bearish trend line forming with resistance near 0.6330 on the hourly chart of AUD/USD at FXOpen.
· NZD/USD declined steadily from the 0.5930 resistance zone.
· There is a connecting bearish trend line forming with resistance near 0.5840 on the hourly chart of NZD/USD at FXOpen.
AUD/USD Technical Analysis
On the hourly chart of AUD/USD at FXOpen, the pair struggled to clear the 0.6400 zone. The Aussie Dollar started a fresh decline below the 0.6355 support against the US Dollar.
The pair even settled below 0.6330 and the 50-hour simple moving average. A low was formed near 0.6295 before there was an upside correction. The pair climbed above the 50% Fib retracement level of the downward move from the 0.6393 swing high to the 0.6295 low.
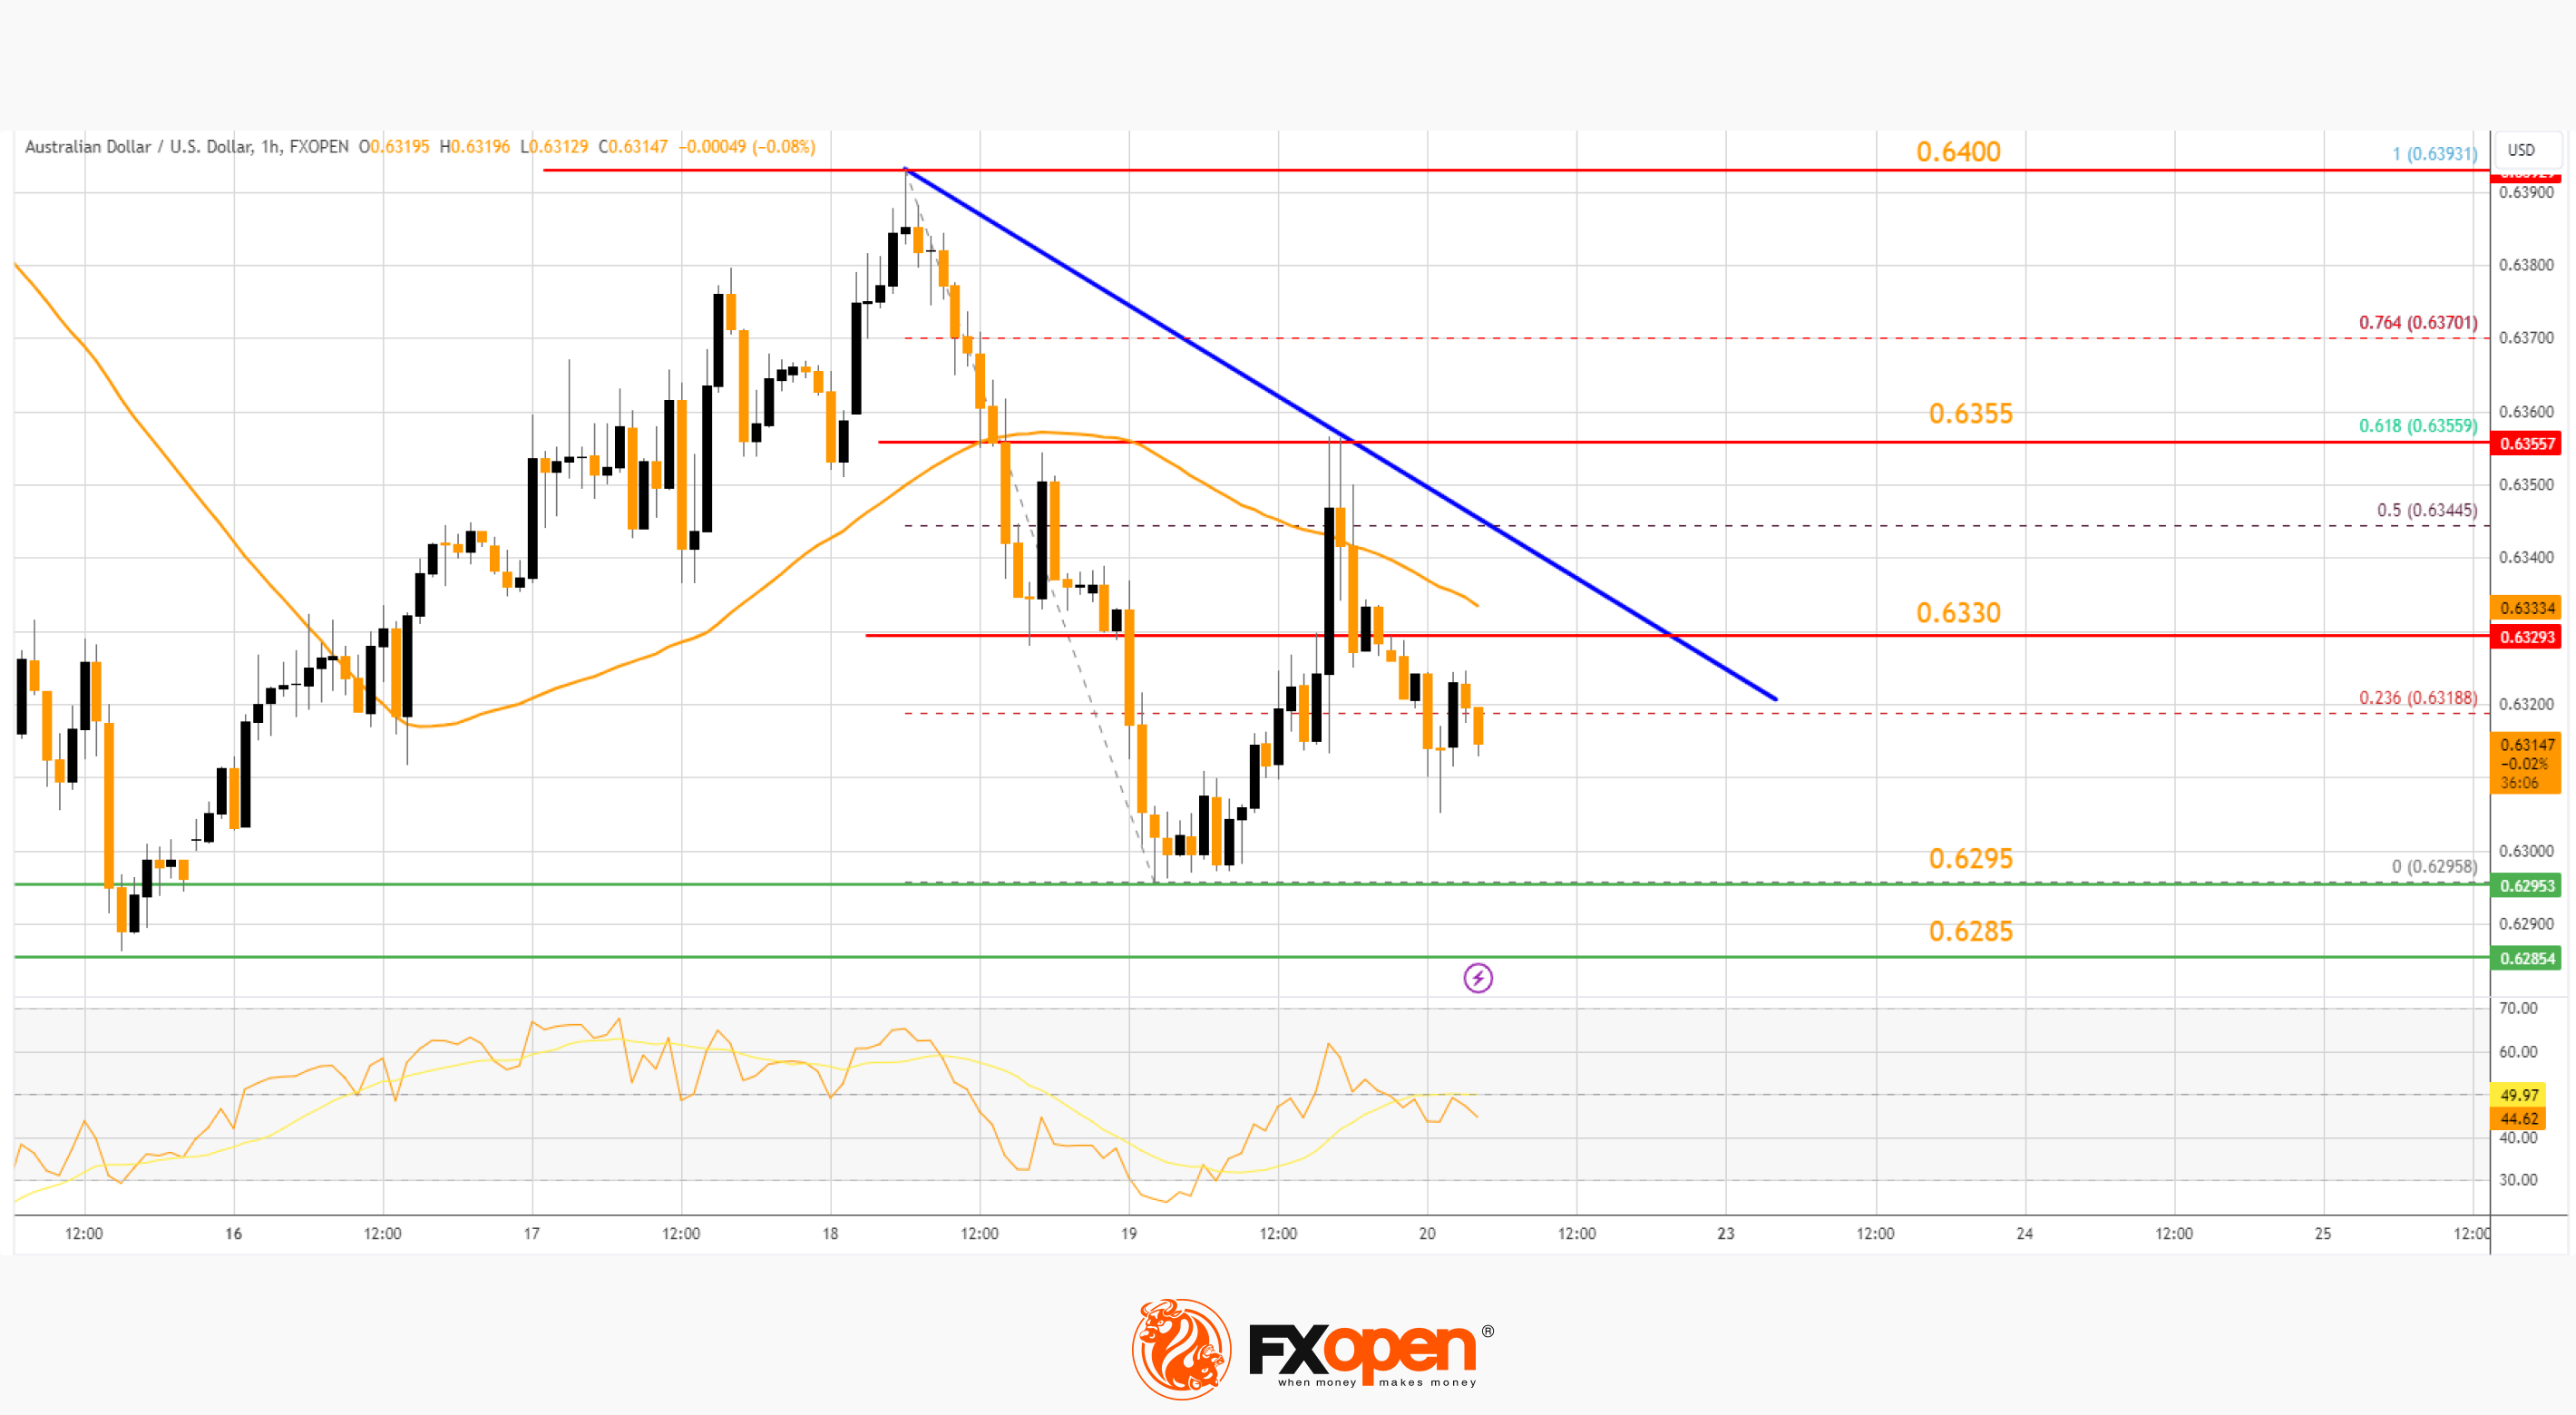
However, the bears were active near the 0.6355 resistance zone. It failed to clear the 61.8% Fib retracement level of the downward move from the 0.6393 swing high to the 0.6295 low.
There is also a key bearish trend line forming with resistance near 0.6330. On the downside, initial support is near the 0.6295 low. The next support sits at 0.6285. If there is a downside break below 0.6285, the pair could extend its decline.
The next support could be 0.6250. Any more losses might send the pair toward the 0.6220 support. On the upside, an immediate resistance is near the trend line at 0.6330.
The next major resistance is near 0.6355, above which the price could rise toward 0.6400. Any more gains might send the pair toward 0.6420. A close above the 0.6420 level could start another steady increase in the near term. The next major resistance on the AUD/USD chart could be 0.6500.
NZD/USD Technical Analysis
On the hourly chart of NZD/USD on FXOpen, the pair also followed a similar pattern and declined from the 0.5930 zone. The New Zealand Dollar gained bearish momentum and traded below 0.5870 against the US Dollar.
The pair even tested the 0.5815 zone before there was a minor recovery wave. The pair climbed above the 23.6% Fib retracement level of the downward move from the 0.5916 swing high to the 0.5815 low. However, it failed to surpass the 50-hour simple moving average at 0.5870.
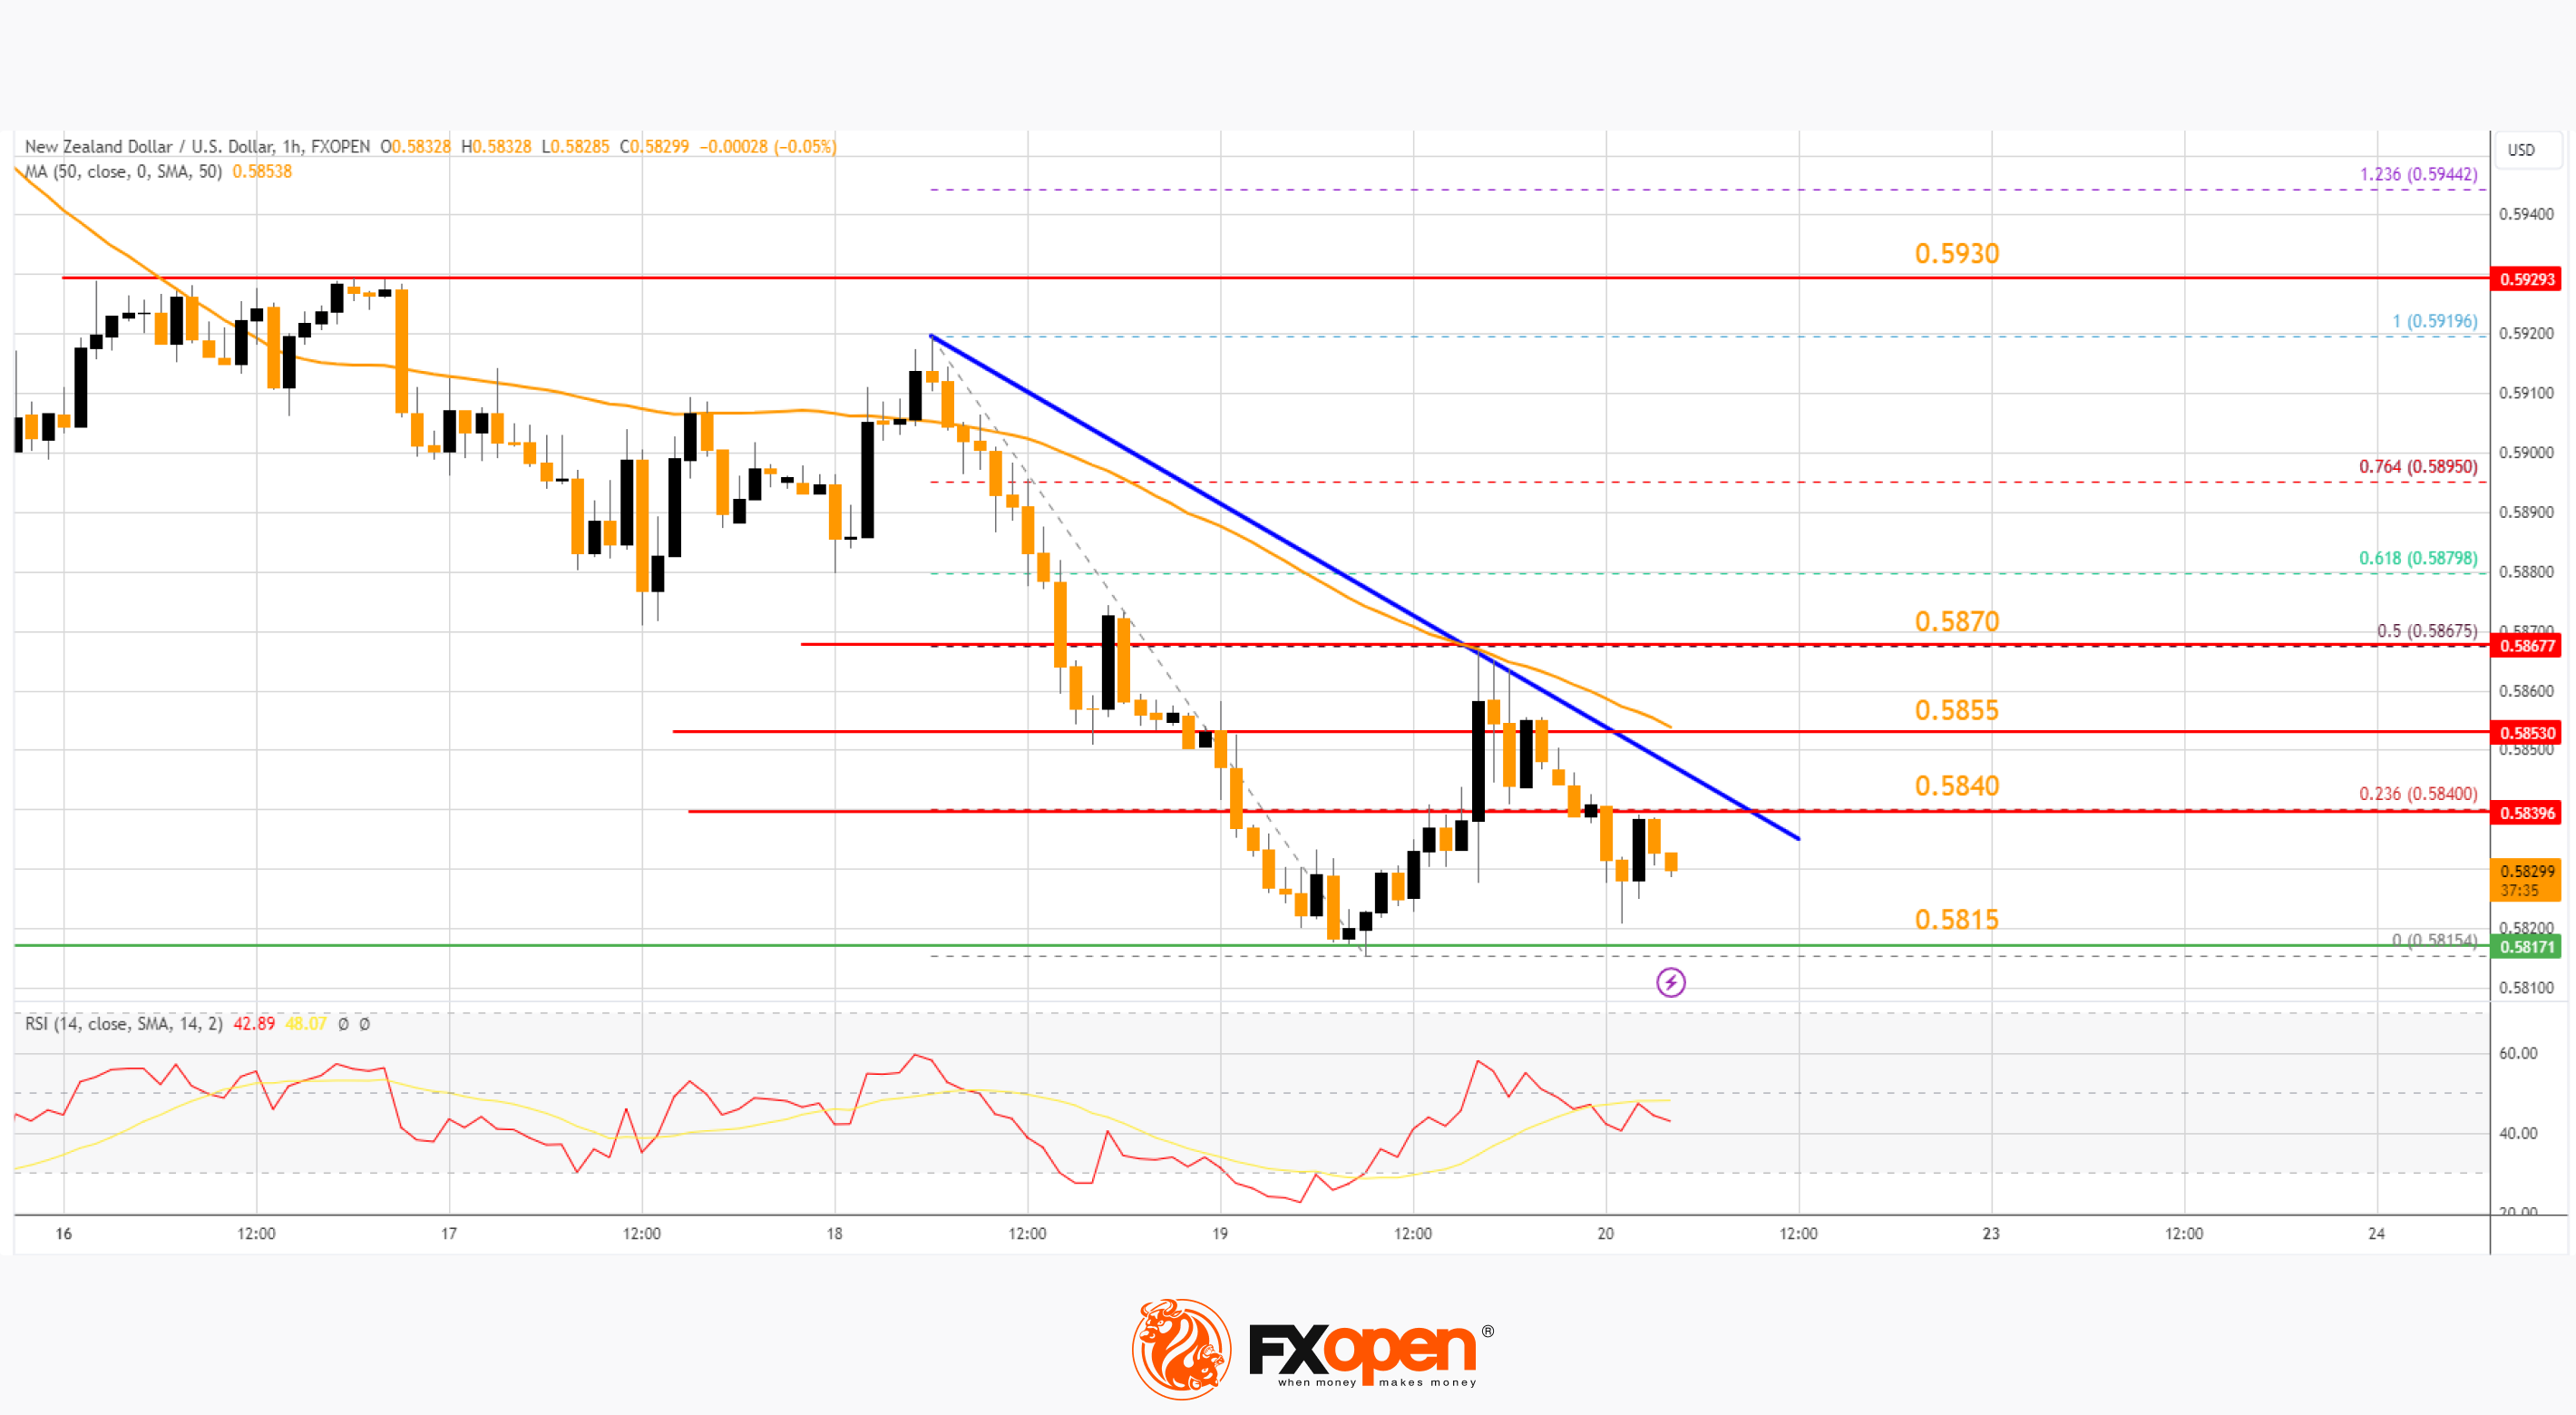
It is now moving lower and trading well below 0.5870. On the downside, immediate support on the NZD/USD chart is near the 0.5815 level.
The next major support is near the 0.5800 zone. If there is a downside break below 0.5800, the pair could extend its decline toward the 0.5740 level. The next key support is near 0.5700.
Immediate resistance on the upside is near a connecting bearish trend line at 0.5840. The next resistance is at 0.5855, followed by 0.5870. If there is a move above 0.5870, the pair could rise toward 0.5930. Any more gains might open the doors for a move toward the 0.5965 resistance zone in the coming days.
Trade over 50 forex markets 24 hours a day with FXOpen. Take advantage of low commissions, deep liquidity, and spreads from 0.0 pips (additional fees may apply). Open your FXOpen account now or learn more about trading forex with FXOpen.
This article represents the opinion of the Companies operating under the FXOpen brand only. It is not to be construed as an offer, solicitation, or recommendation with respect to products and services provided by the Companies operating under the FXOpen brand, nor is it to be considered financial advice.
Stay ahead of the market!
Subscribe now to our mailing list and receive the latest market news and insights delivered directly to your inbox.


Latest articles

Dow Jones (DJIA): Consolidation Beyond the Trend
Federal Reserve Chair Kevin Warsh testified before Congress on 14–15 July, reaffirming the Fed's commitment to bringing inflation back to target while providing no clear guidance on the future path of interest rates. Meanwhile, June inflation data came in

European Currencies Strengthen Ahead of Key Macroeconomic Releases
EUR/USD and GBP/USD continue to recover moderately following the recent weakening of the US dollar. European currencies have been supported by expectations that US inflationary pressures will continue to ease after softer-than-expected CPI and PPI data, reinforcing market

Brent Crude Oil: From Ceasefire to Crossfire — What's Next?
Just weeks ago, traders were pricing in peace. Now they're pricing in war again—and that reversal says everything about how fragile the current Middle East calm really is.
Brent crude has surged to $86 a barrel, its highest level