


FXOpen

AUD/USD is moving higher and might climb further higher above 0.6615. NZD/USD is also rising and might surge toward the 0.6145 resistance zone.
Important Takeaways for AUD USD and NZD USD Analysis Today
· The Aussie Dollar started a fresh increase above the 0.6520 and 0.6550 levels against the US Dollar.
· There was a break above a major bearish trend line with resistance near 0.6520 on the hourly chart of AUD/USD at FXOpen.
· NZD/USD is gaining bullish momentum above the 0.6060 support.
· There was a break above a key bearish trend line with resistance near 0.6020 on the hourly chart of NZD/USD at FXOpen.
AUD/USD Technical Analysis
On the hourly chart of AUD/USD at FXOpen, the pair started a fresh increase from the 0.6460 support. The Aussie Dollar was able to clear the 0.6500 resistance to start a steady uptrend against the US Dollar.
It cleared the 50-hour simple moving average and a major bearish trend line with resistance near 0.6520. The upward move was such that the bulls pumped the pair above the 61.8% Fib retracement level of the downward move from the 0.6660 swing high to the 0.6462 low.
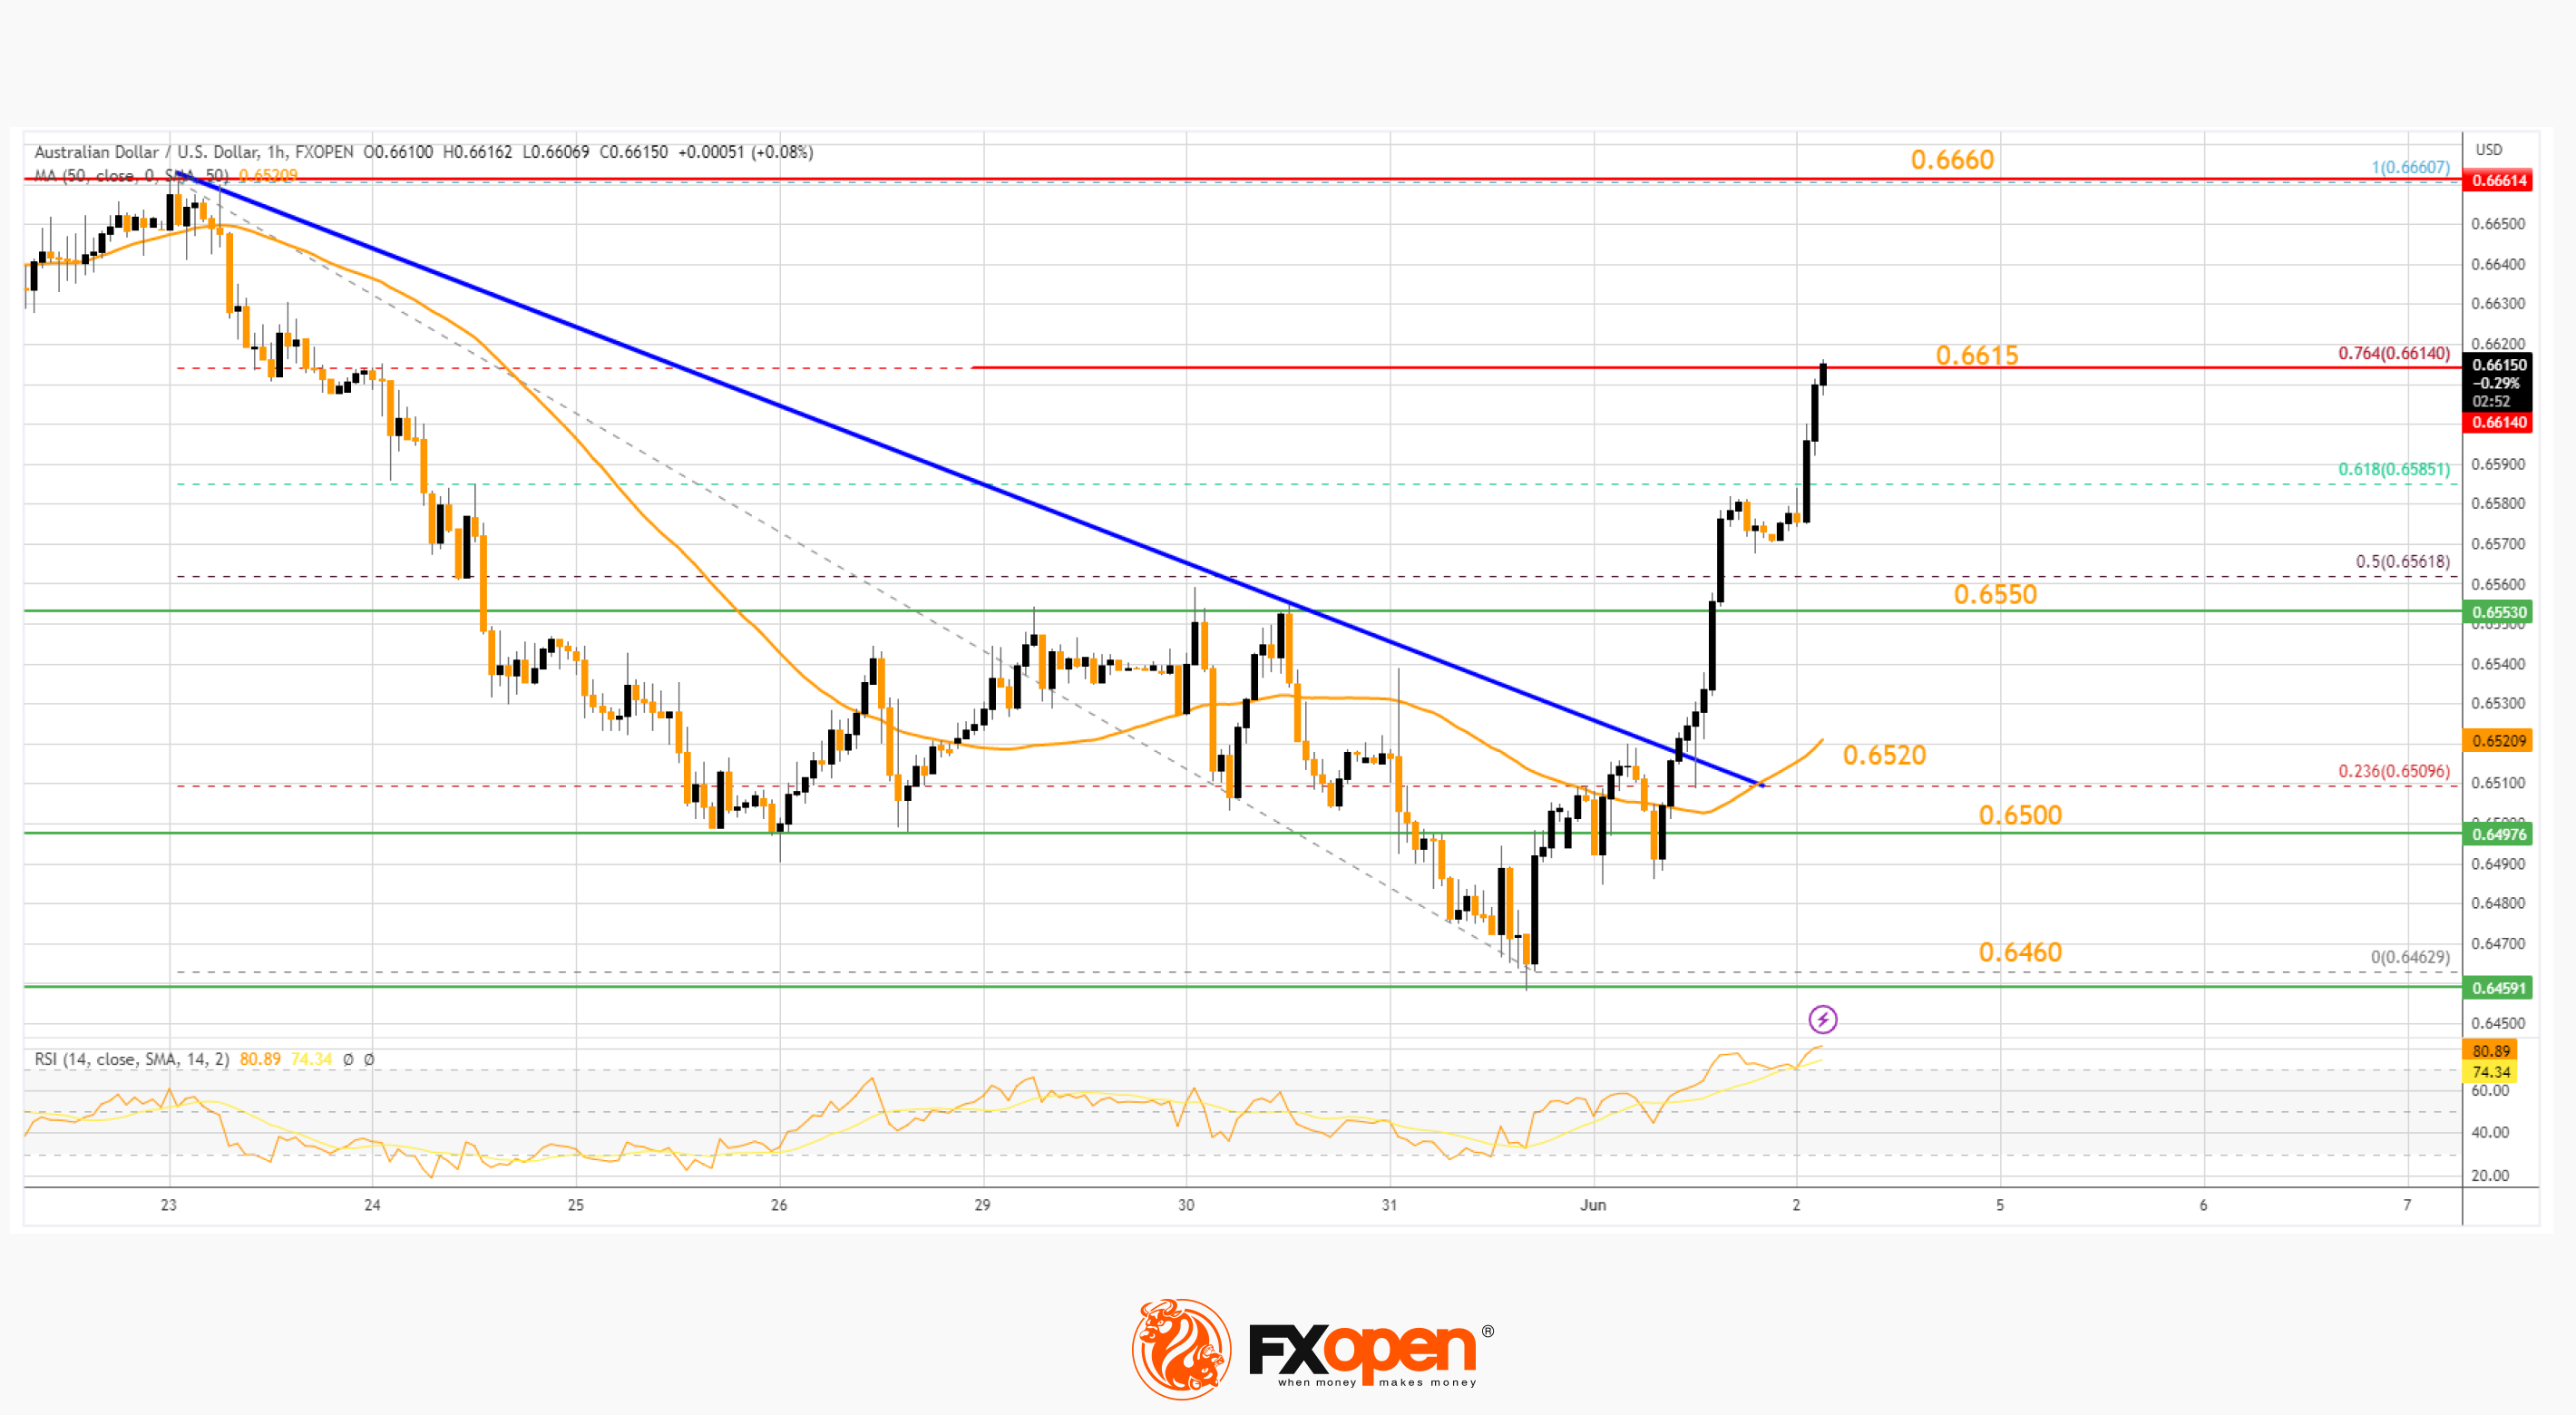
The AUD USD chart indicates that the pair is now facing resistance near 0.6615. It is close to the 76.4% Fib retracement level of the downward move from the 0.6660 swing high to the 0.6462 low.
An upside break above the 0.6615 resistance might send the pair further higher. The next major resistance is near the 0.6660 level. Any more gains could open the doors for a move toward the 0.6700 resistance zone.
On the downside, initial support is near 0.6550. The next support could be the 0.6520 level and the 50-hour simple moving average. If there is a downside break below the 0.6520 support, the pair could extend its decline toward the 0.6460 level. Any more losses might signal a move toward 0.6400.
NZD/USD Technical Analysis
On the hourly chart of AUD/USD on FXOpen, the pair formed a base above the 0.5990 level. The New Zealand Dollar started a decent upward move above the 0.6020 resistance against the US Dollar.
There was also a break above a key bearish trend line with resistance near 0.6020. The pair is now trading above the 50-hour simple moving average and the 23.6% Fib retracement level of the main decline from the 0.6302 swing high to the 0.5988 low.
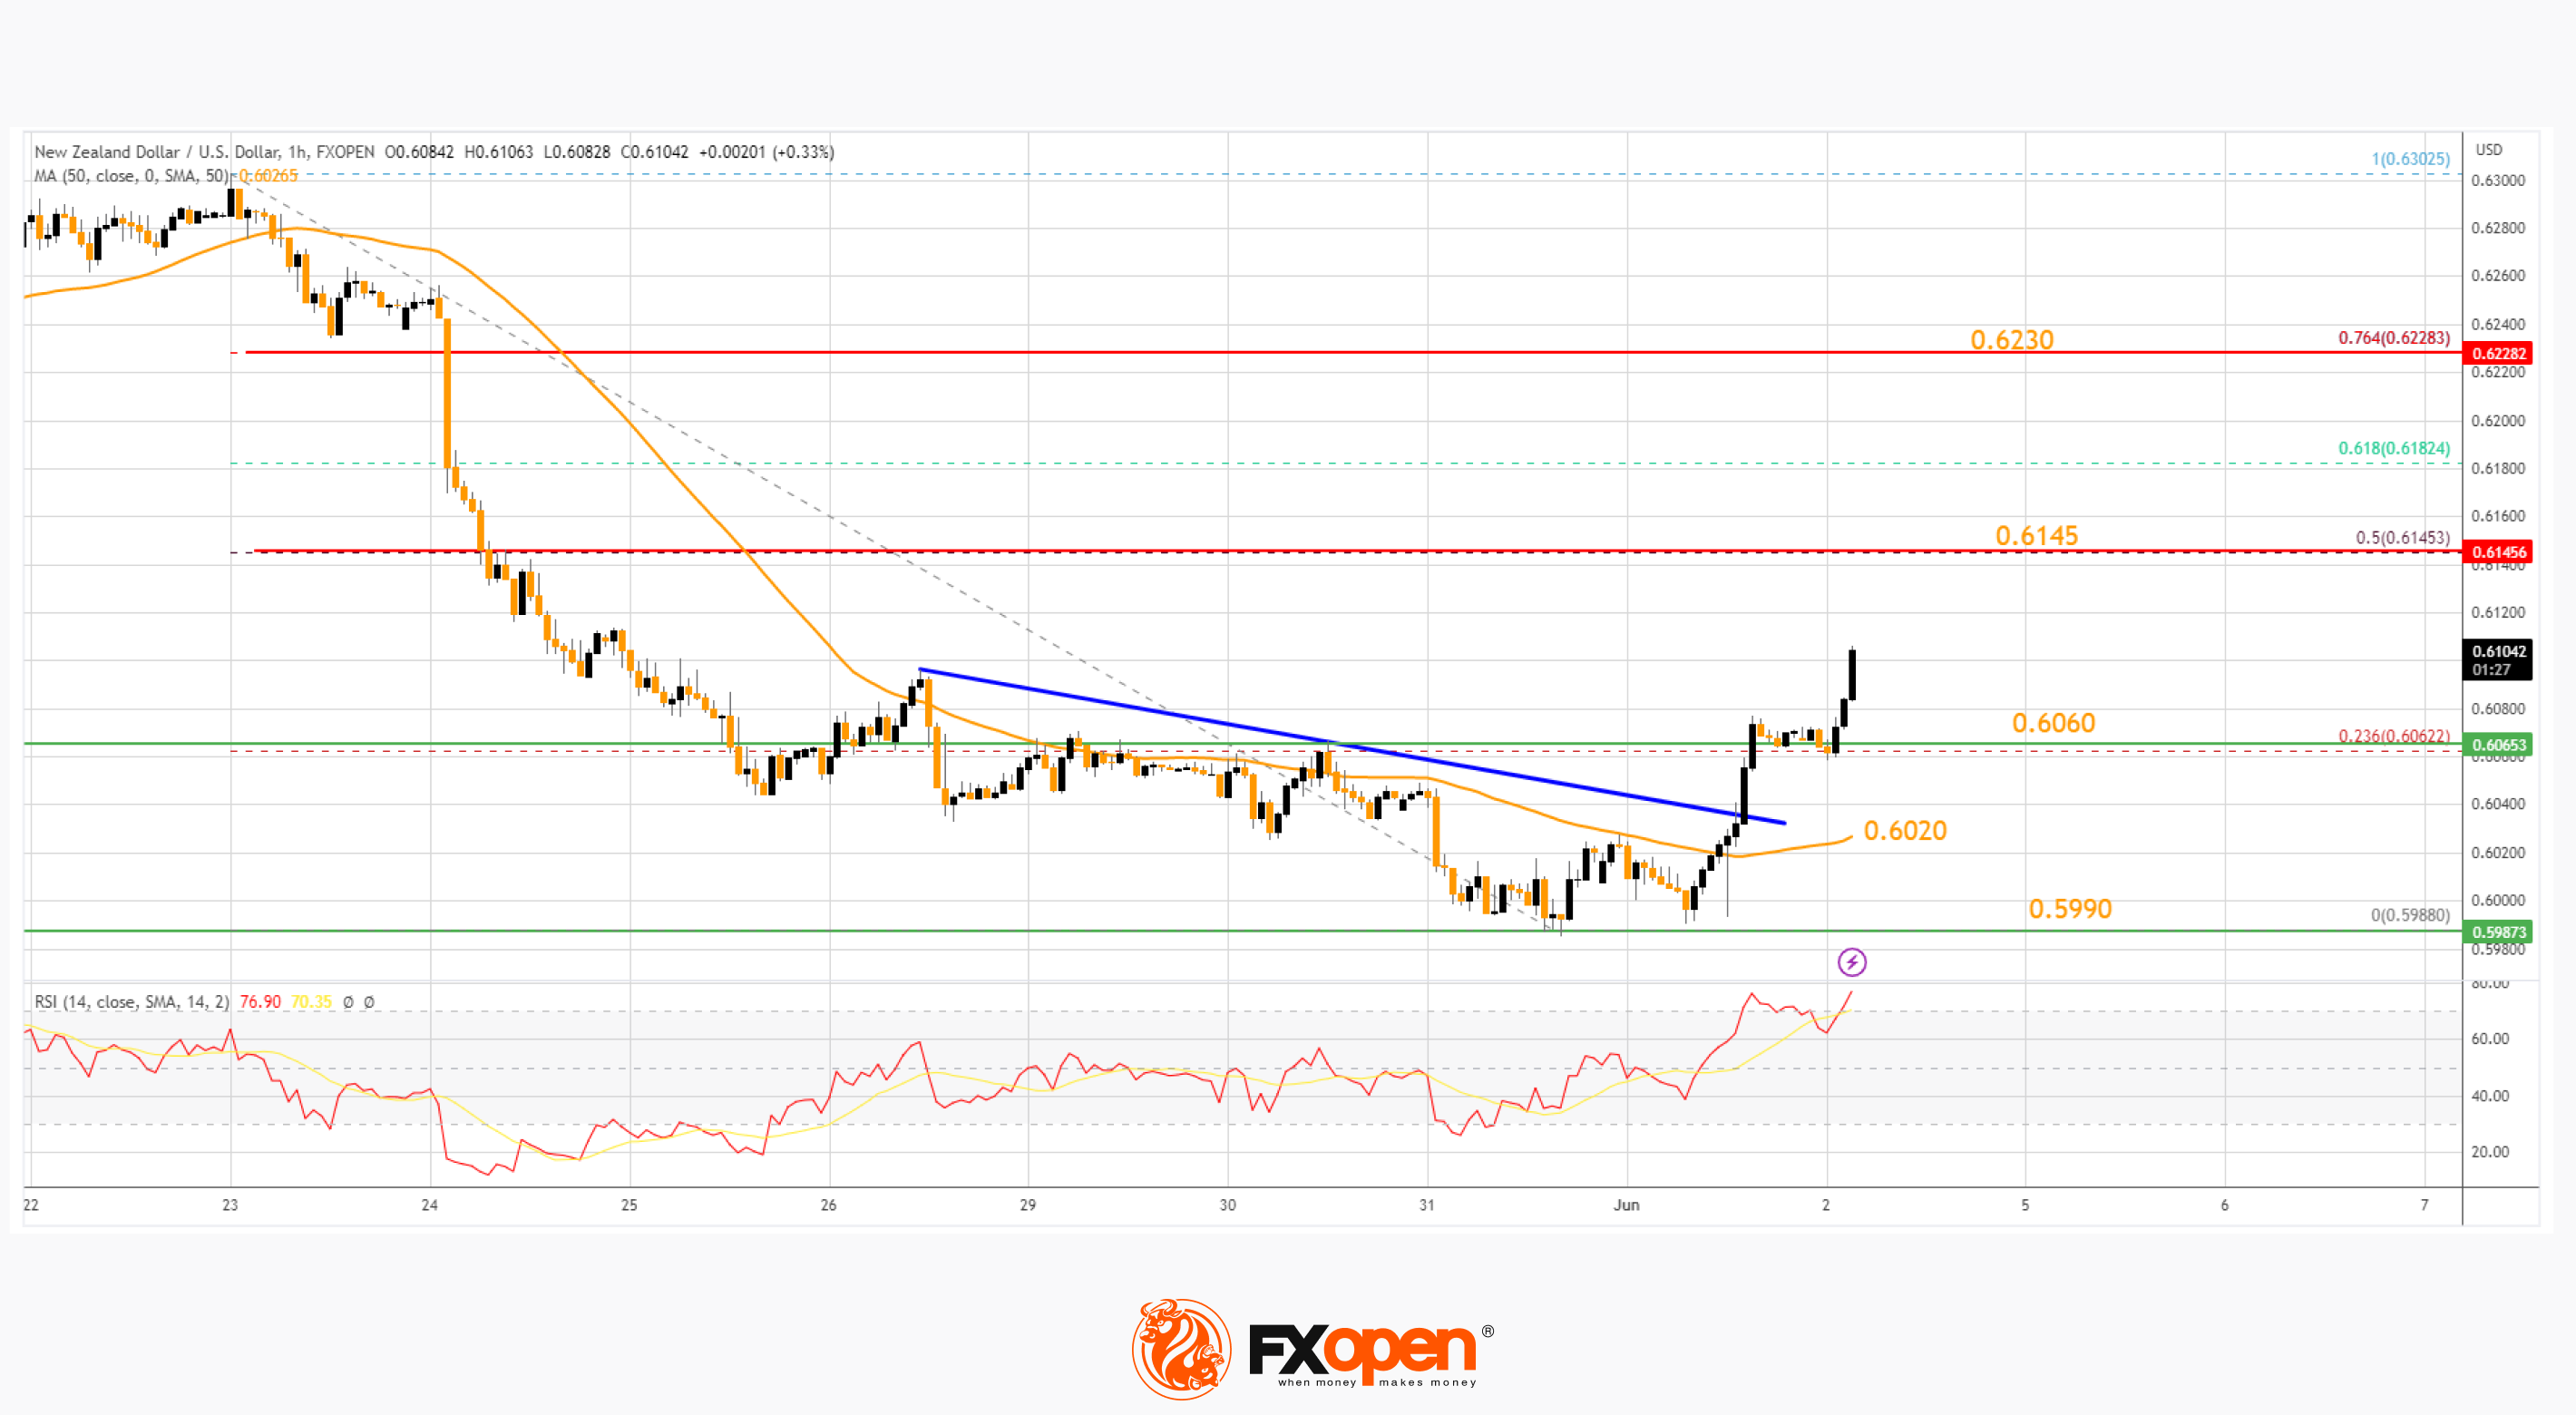
The NZD USD chart suggests that the RSI is rising and might lead the pair toward the 0.6145 resistance. It coincides with the 50% Fib retracement level of the main decline from the 0.6302 swing high to the 0.5988 low.
The next major resistance is near the 0.6230 level. A clear move above the 0.6230 level might even push the pair toward the 0.6300 level. Any more gains might open the doors for a move toward the 0.6350 resistance zone in the coming days
On the downside, there is a key support forming near 0.6060. The next major support is near the 50-hour simple moving average at 0.6020.
If there is a downside break below the 0.6020 support, the pair might slide toward the 0.5990 support. Any more losses could send NZD/USD toward 0.5950.
Trade over 50 forex markets 24 hours a day with FXOpen. Take advantage of low commissions, deep liquidity, and spreads from 0.0 pips (additional fees may apply). Open your FXOpen account now or learn more about trading forex with FXOpen.
This article represents the opinion of the Companies operating under the FXOpen brand only. It is not to be construed as an offer, solicitation, or recommendation with respect to products and services provided by the Companies operating under the FXOpen brand, nor is it to be considered financial advice.
Stay ahead of the market!
Subscribe now to our mailing list and receive the latest market news and insights delivered directly to your inbox.


Latest articles

Why the CPI Release Matters for the Price of Bitcoin
The previous Consumer Price Index (CPI) report was published on 13 January and had a significant impact on Bitcoin’s price. As the BTC/USD chart shows:
→ shortly after the release, the price surged aggressively to the 14 January peak;

Nasdaq 100 May Retest This Year’s Low
As the chart of the Nasdaq 100 index (US Tech 100 mini on FXOpen) shows, bearish sentiment currently dominates the equity market. Yesterday, the technology index fell by around 2%.
Why Is the Nasdaq 100 Declining?
According to media reports,

Euro And Sterling Rally Slows After Strong US Data
At the start of the week, the euro and sterling posted solid gains amid dollar weakness and expectations of a more accommodative Federal Reserve policy path, testing local highs. However, the release of the January US employment report shifted market