


FXOpen

AUD/USD declined below the 0.6320 and 0.6300 support levels. NZD/USD is also moving lower and might extend losses below 0.5700.
Important Takeaways for AUD/USD and NZD/USD Analysis Today
· The Aussie Dollar started a fresh decline from well above the 0.6320 level against the US Dollar.
· There is a connecting bearish trend line forming with resistance at 0.6300 on the hourly chart of AUD/USD at FXOpen.
· NZD/USD declined steadily from the 0.5760 resistance zone.
· There is a major bearish trend line forming with resistance at 0.5715 on the hourly chart of NZD/USD at FXOpen.
AUD/USD Technical Analysis
On the hourly chart of AUD/USD at FXOpen, the pair struggled to clear the 0.6330 zone. The Aussie Dollar started a fresh decline below the 0.6300 support against the US Dollar, as discussed in the previous analysis.
The pair even settled below 0.6280 and the 50-hour simple moving average. There was a clear move below 0.6270. A low was formed at 0.6269 and the pair is now consolidating losses.
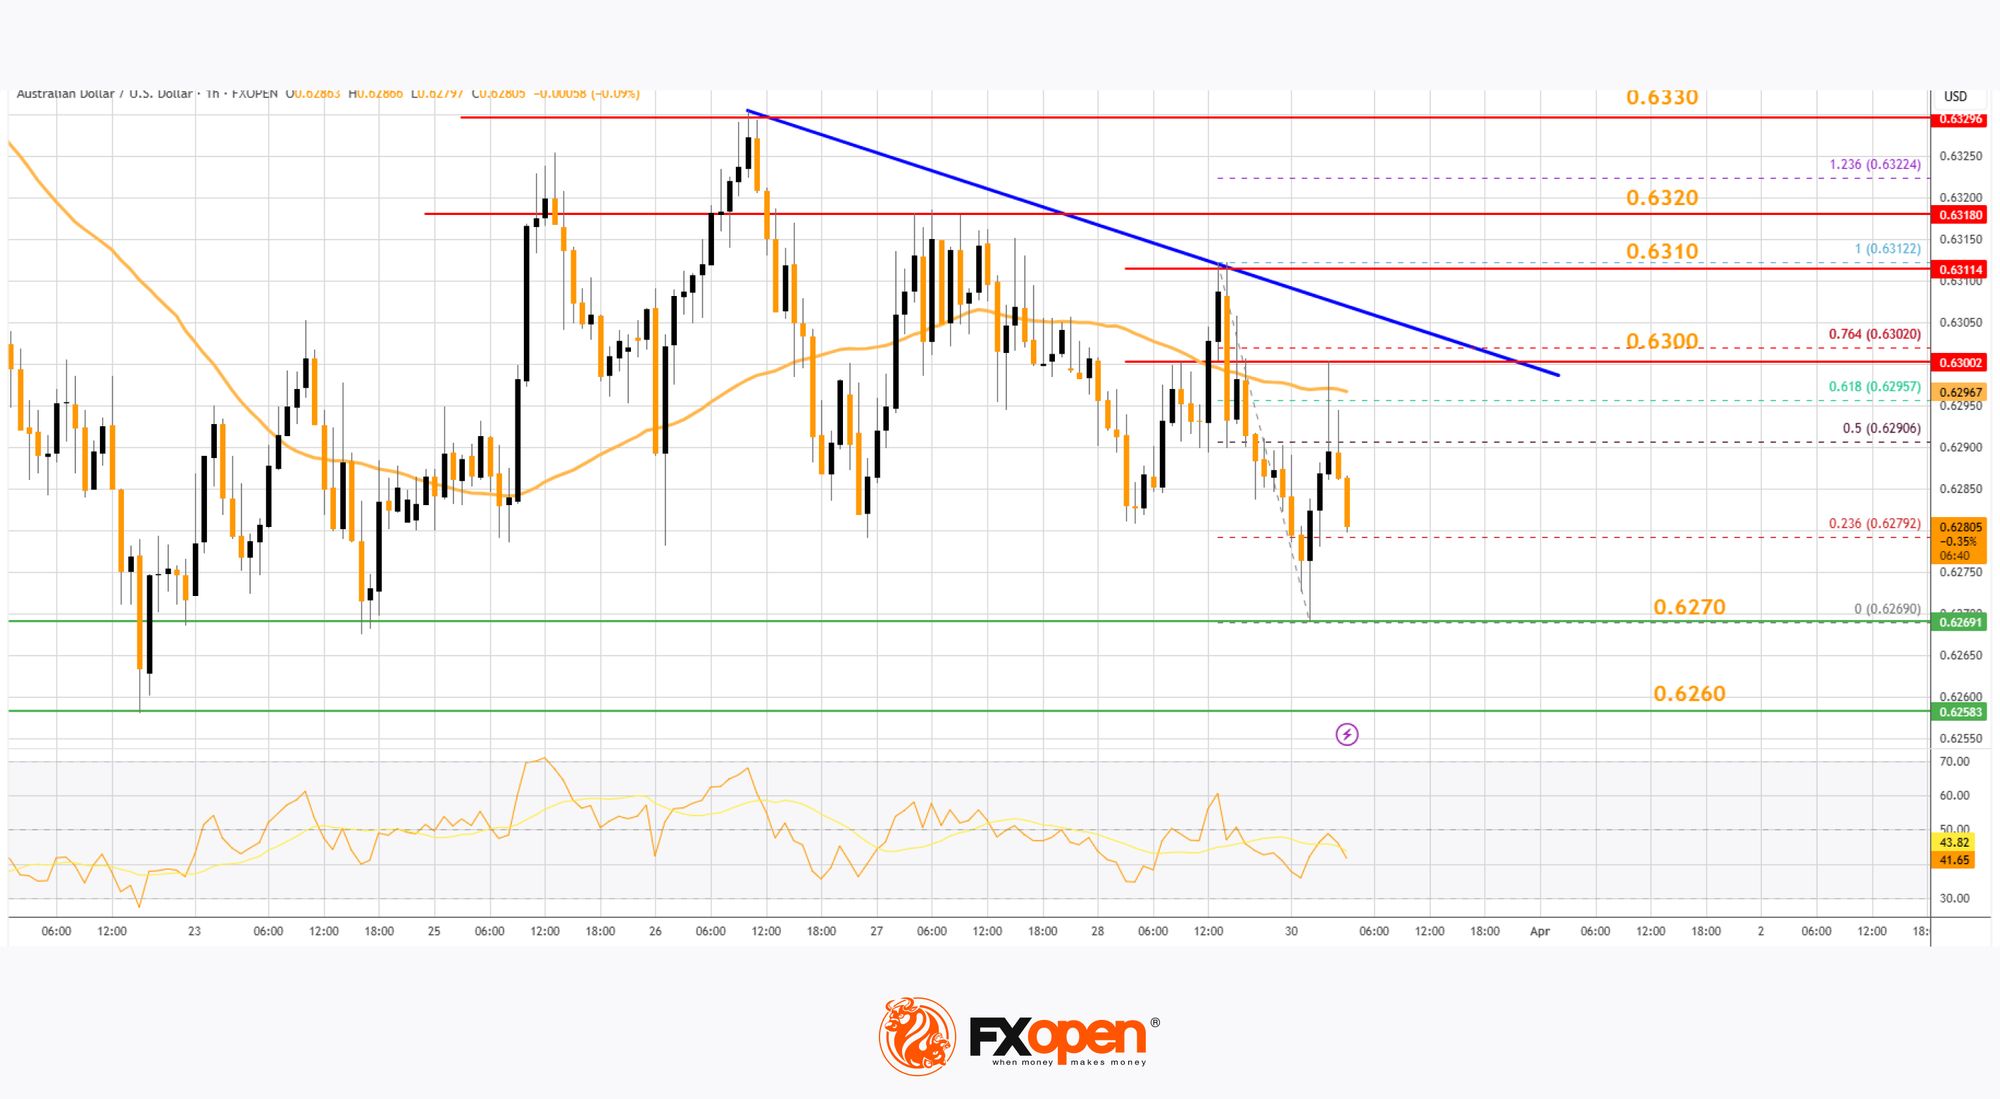
On the upside, an immediate resistance is near the 0.6295 level and the 61.8% Fib retracement level of the downward move from the 0.6312 swing high to the 0.6269 low.
There is also a connecting bearish trend line forming with resistance at 0.6300. It is close to the 76.4% Fib retracement level of the downward move from the 0.6312 swing high to the 0.6269 low. The next major resistance is near the 0.6310 zone, above which the price could rise toward 0.6320.
Any more gains might send the pair toward the 0.6330 resistance. A close above the 0.6330 level could start another steady increase in the near term. The next major resistance on the AUD/USD chart could be 0.6380.
On the downside, initial support is near the 0.6270 zone. The next support sits at 0.6260. If there is a downside break below 0.6260, the pair could extend its decline. The next support could be 0.6200. Any more losses might send the pair toward the 0.6165 support.
NZD/USD Technical Analysis
On the hourly chart of NZD/USD on FXOpen, the pair also followed a similar pattern and declined from the 0.5760 zone. The New Zealand Dollar gained bearish momentum and traded below 0.5725 against the US Dollar.
The pair settled below the 0.5720 level and the 50-hour simple moving average. Finally, it tested the 0.5695 zone and is currently consolidating losses.
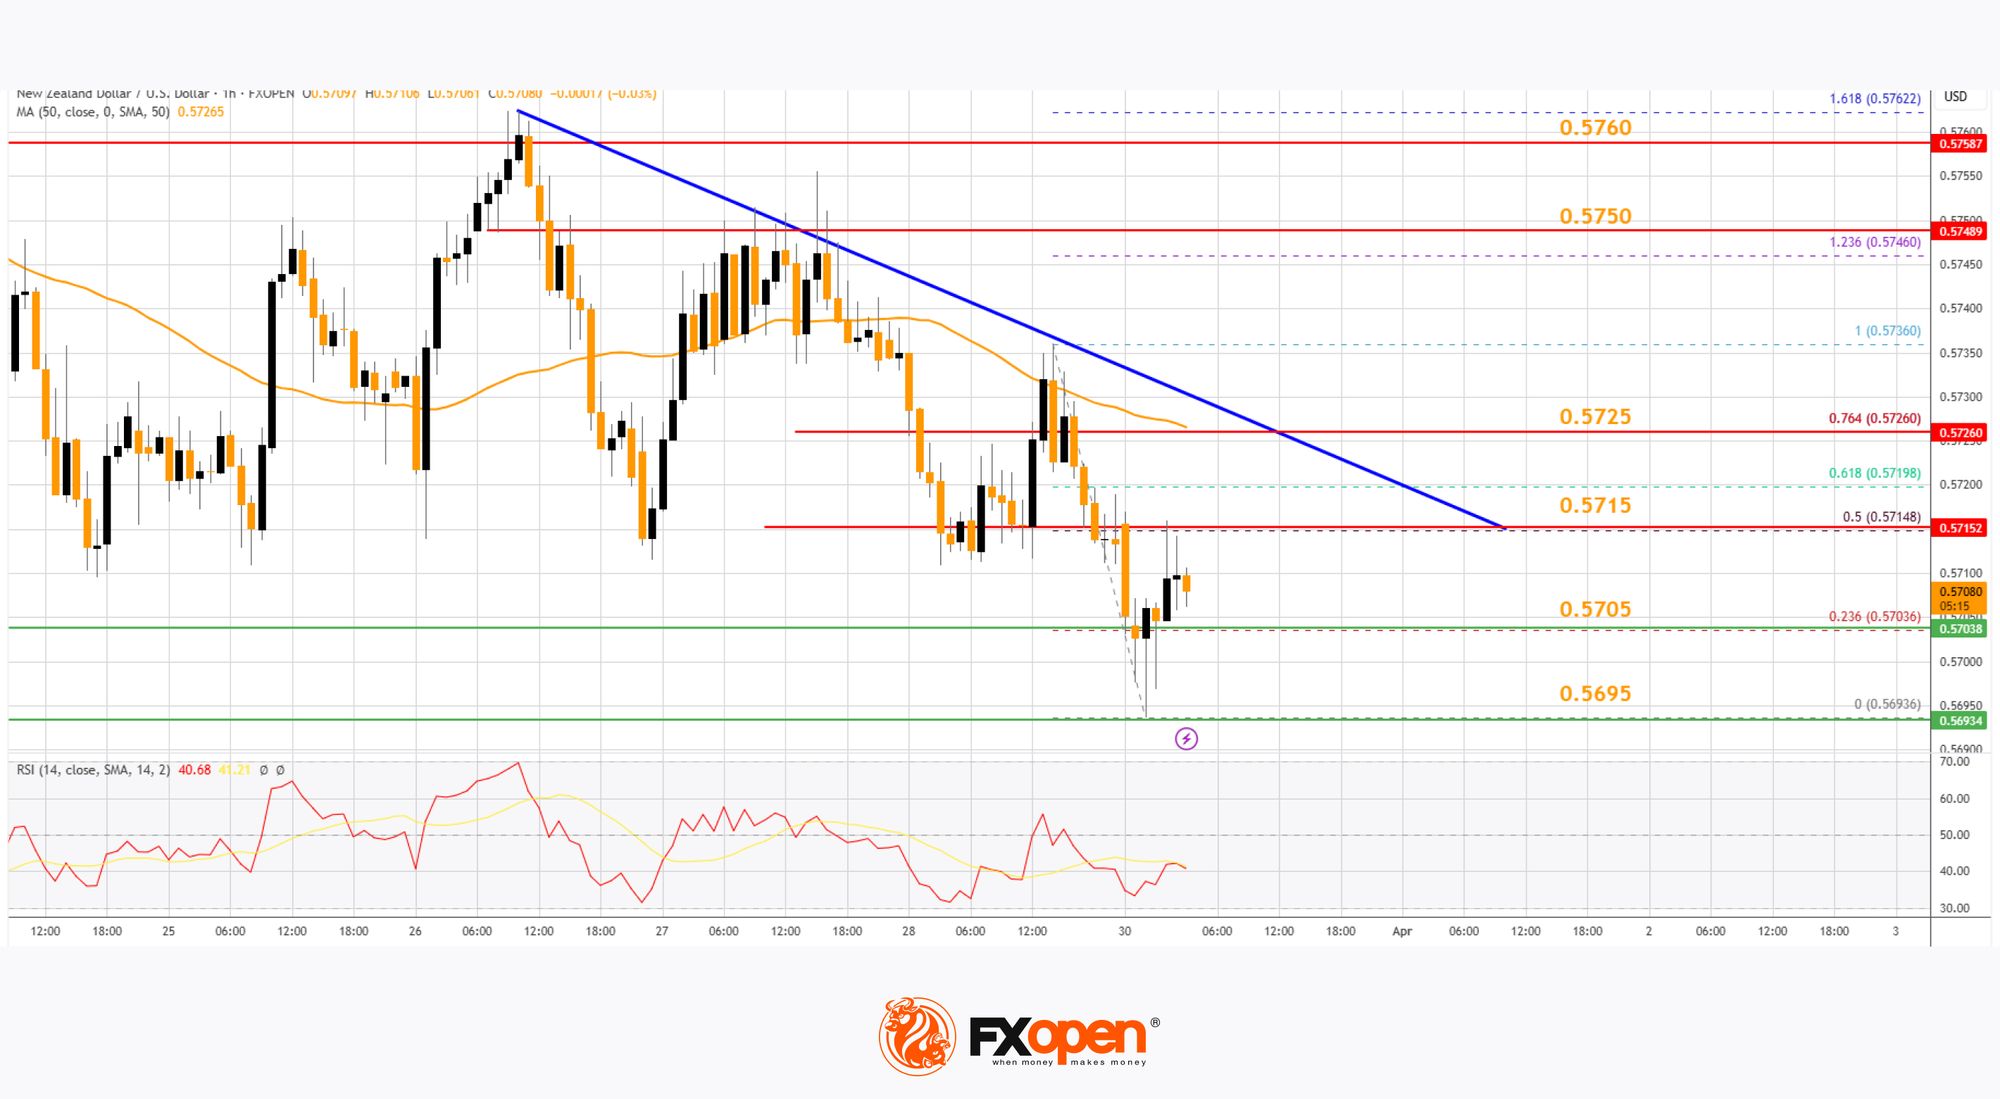
Immediate resistance on the upside is near the 50% Fib retracement level of the downward move from the 0.5736 swing high to the 0.5693 low at 0.5715. There is also a major bearish trend line forming with resistance at 0.5715.
The next resistance is the 0.5725 level or the 76.4% Fib retracement level of the downward move from the 0.5736 swing high to the 0.5693 low. If there is a move above 0.5725, the pair could rise toward 0.5750.
Any more gains might open the doors for a move toward the 0.5800 resistance zone in the coming days. On the downside, immediate support on the NZD/USD chart is near the 0.5705 level.
The next major support is near the 0.5695 zone. If there is a downside break below 0.5695, the pair could extend its decline toward the 0.5665 level. The next key support is near 0.5640.
Trade over 50 forex markets 24 hours a day with FXOpen. Take advantage of low commissions, deep liquidity, and spreads from 0.0 pips (additional fees may apply). Open your FXOpen account now or learn more about trading forex with FXOpen.
This article represents the opinion of the Companies operating under the FXOpen brand only. It is not to be construed as an offer, solicitation, or recommendation with respect to products and services provided by the Companies operating under the FXOpen brand, nor is it to be considered financial advice.
Stay ahead of the market!
Subscribe now to our mailing list and receive the latest market news and insights delivered directly to your inbox.


Latest articles

Weekend Trading: Market Access, Liquidity, and Trading Conditions
Weekend trading refers to market activity outside

AUD/USD Falls Below Key Support
As the AUD/USD chart indicates, the Australian dollar is showing weakness against the US dollar at the start of the week. Notably, we are seeing a bearish breakout below the lower boundary of an important ascending channel that had

Gold Price Falls to 2026 Low
As the XAU/USD chart indicates, today, shortly after the start of the trading week, gold fell below $4,150 (the low of the year). The last time prices were at this level was in early December 2025, before the