


FXOpen

AUD/USD declined below the 0.6855 and 0.6830 support levels. NZD/USD is also moving lower and might struggle to recover above 0.6225.
Important Takeaways for AUD/USD and NZD/USD Analysis Today
· The Aussie Dollar started a fresh decline from well above the 0.6900 level against the US Dollar.
· There is a connecting bearish trend line forming with resistance at 0.6755 on the hourly chart of AUD/USD at FXOpen.
· NZD/USD declined steadily from the 0.6380 resistance zone.
· There is a key bearish trend line forming with resistance at 0.6145 on the hourly chart of NZD/USD at FXOpen.
AUD/USD Technical Analysis
On the hourly chart of AUD/USD at FXOpen, the pair struggled to clear the 0.6950 zone. The Aussie Dollar started a fresh decline below the 0.6855 support against the US Dollar.
The pair even settled below 0.6800 and the 50-hour simple moving average. There was a clear move below 0.6750. A low was formed at 0.6715 and the pair is now consolidating losses. On the upside, an immediate resistance is near the 0.6755 level.
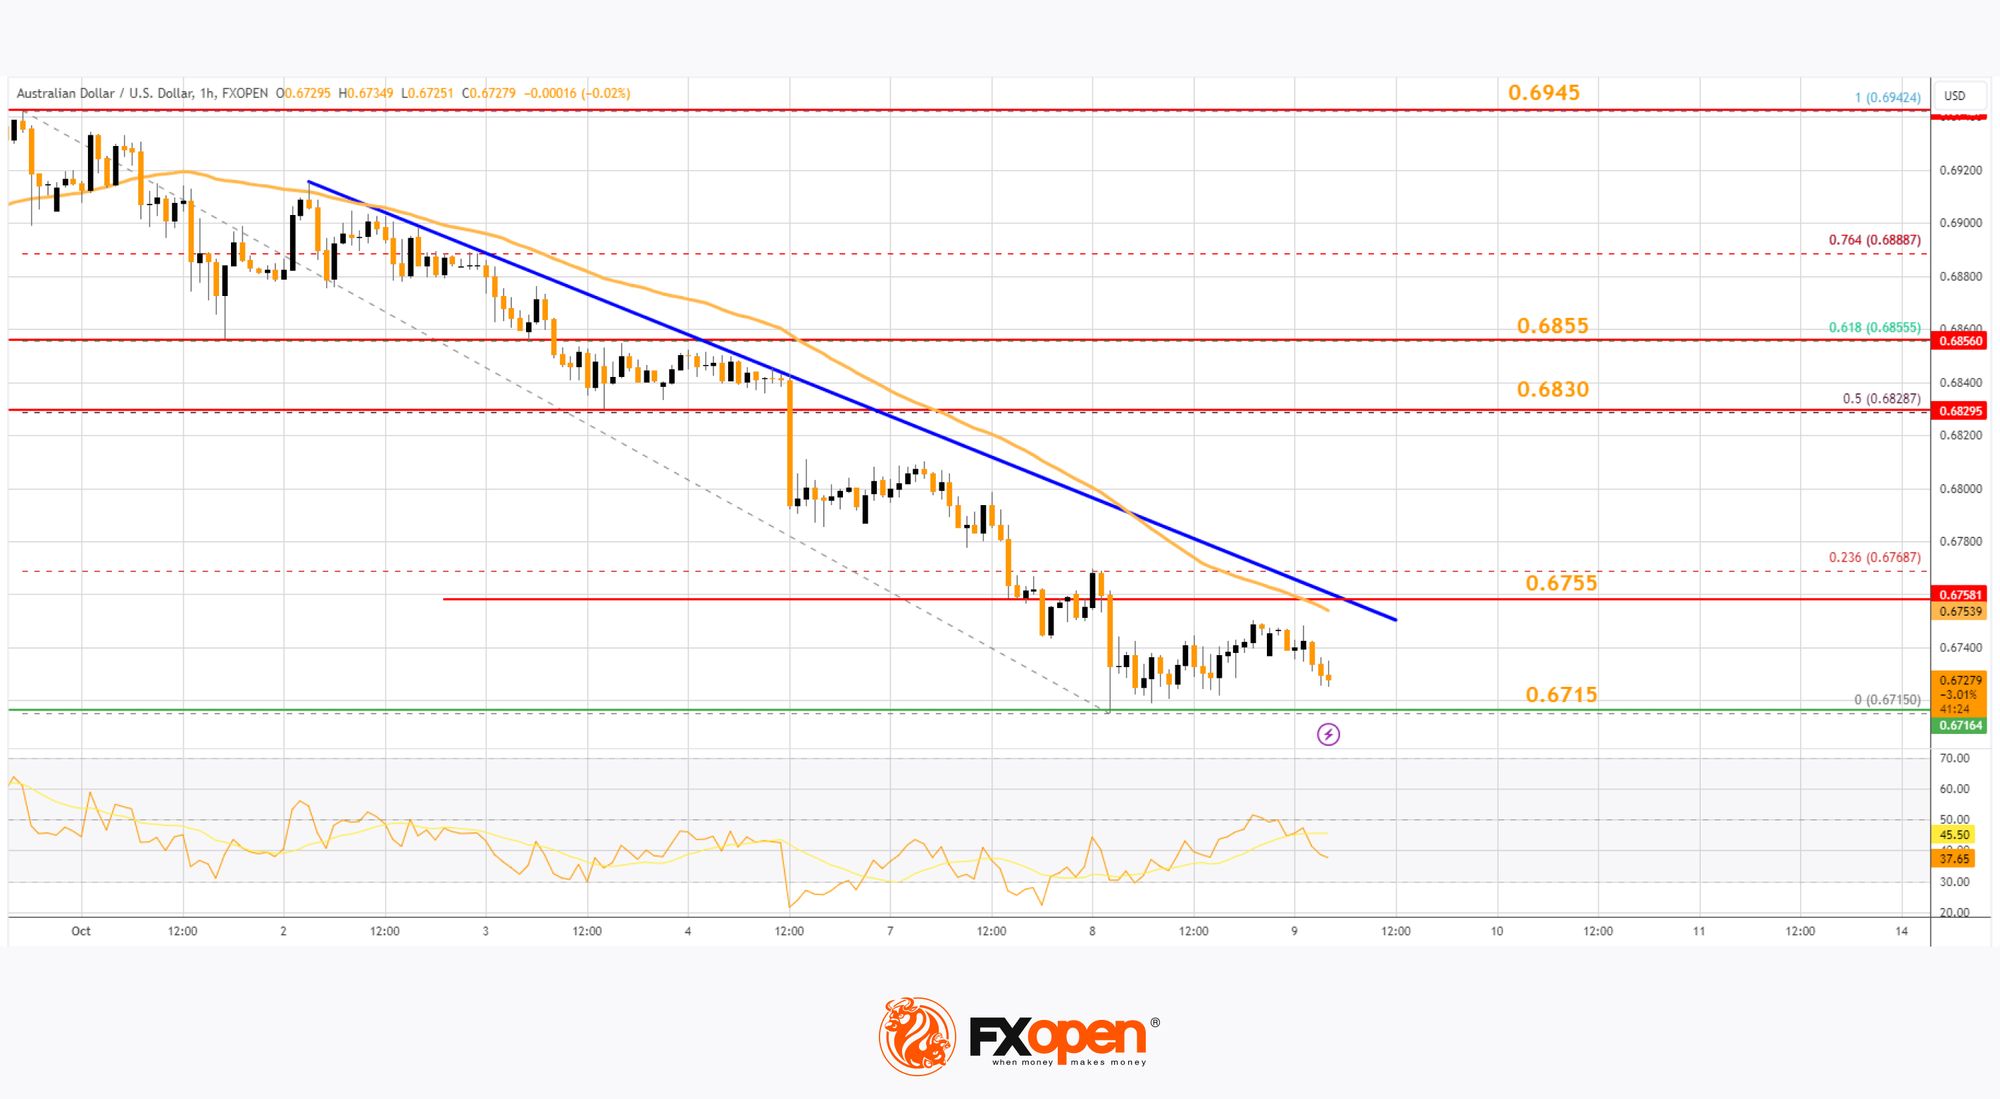
There is also a connecting bearish trend line with resistance at 0.6755. The 23.6% Fib retracement level of the downward move from the 0.6942 swing high to the 0.6715 low sits above the trend line.
The next major resistance is near the 0.6830 zone or the 50% Fib retracement level of the downward move from the 0.6942 swing high to the 0.6715 low, above which the price could rise toward 0.6855.
Any more gains might send the pair toward the 0.6900 handle. A close above the 0.6900 level could start another steady increase in the near term. The next major resistance on the AUD/USD chart could be 0.6945.
On the downside, initial support is near the 0.6715 zone. The next support sits at 0.6700. If there is a downside break below 0.6700, the pair could extend its decline. The next support could be 0.6650. Any more losses might send the pair toward the 0.6620 support.
NZD/USD Technical Analysis
On the hourly chart of NZD/USD on FXOpen, the pair also followed a similar pattern and declined from the 0.6380 zone. The New Zealand Dollar gained bearish momentum and traded below 0.6265 against the US Dollar.
The pair settled below the 0.6150 level and the 50-hour simple moving average. Finally, it tested the 0.6075 zone and is currently consolidating losses. Immediate resistance on the upside is near 0.6145.
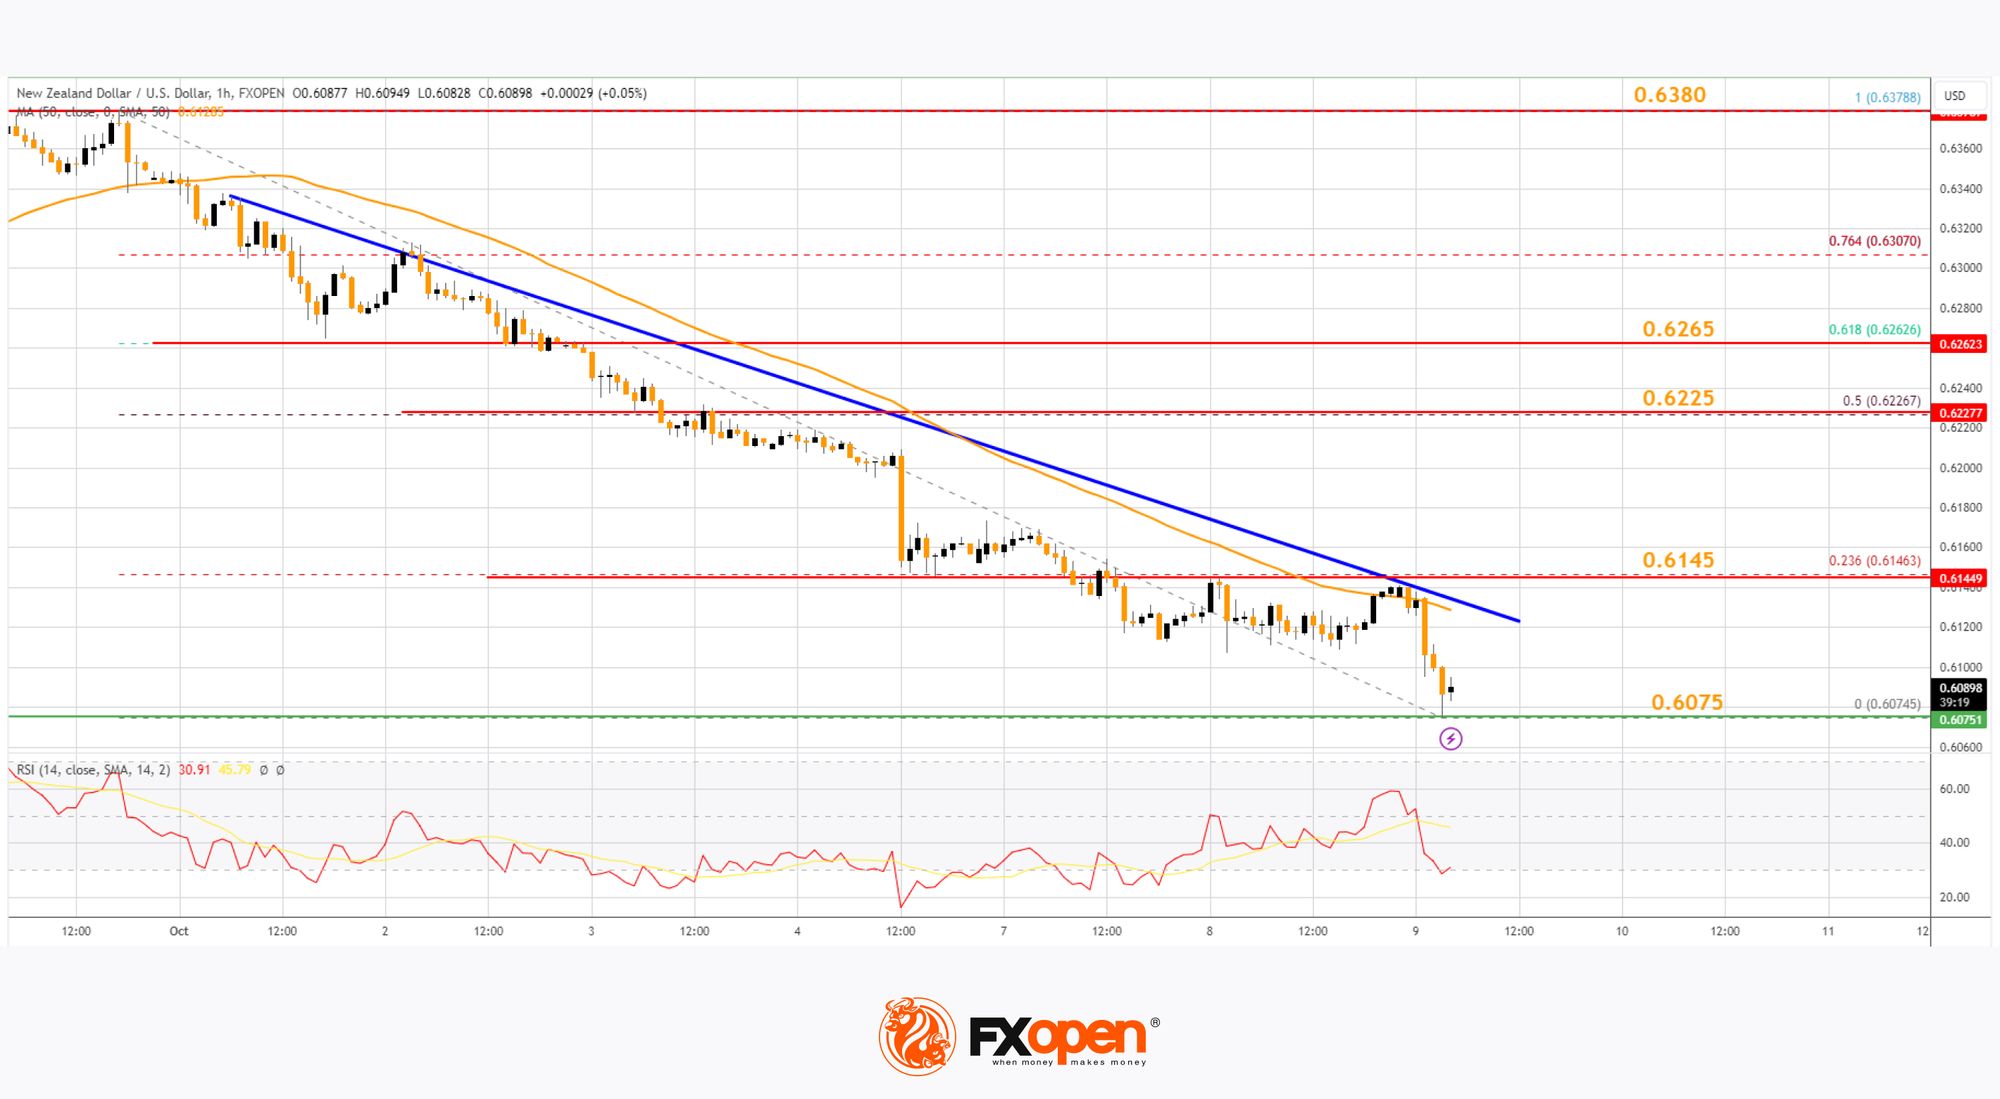
There is also a key bearish trend line forming with resistance at 0.6145 and the 23.6% Fib retracement level of the downward move from the 0.6378 swing high to the 0.6074 low. The next resistance is the 0.6225 level.
The 50% Fib retracement level of the downward move from the 0.6378 swing high to the 0.6074 low is also at 0.6225. If there is a move above 0.6225, the pair could rise toward 0.6265.
Any more gains might open the doors for a move toward the 0.6380 resistance zone in the coming days. On the downside, immediate support on the NZD/USD chart is near the 0.6075 level.
The next major support is near the 0.6040 zone. If there is a downside break below 0.6040, the pair could extend its decline toward the 0.6020 level. The next key support is near 0.6000.
Trade over 50 forex markets 24 hours a day with FXOpen. Take advantage of low commissions, deep liquidity, and spreads from 0.0 pips (additional fees may apply). Open your FXOpen account now or learn more about trading forex with FXOpen.
This article represents the opinion of the Companies operating under the FXOpen brand only. It is not to be construed as an offer, solicitation, or recommendation with respect to products and services provided by the Companies operating under the FXOpen brand, nor is it to be considered financial advice.
Stay ahead of the market!
Subscribe now to our mailing list and receive the latest market news and insights delivered directly to your inbox.


Latest articles

Weak Data Weigh on the Dollar: Market Awaits Trend Confirmation
The US dollar is retreating from recent highs, moving into a moderate correction after a prolonged period of gains. Pressure on the currency is building amid weaker-than-expected macroeconomic data, while market participants adopt a wait-and-see approach ahead of key labour

Market Analysis: EUR/USD Aims Recovery While USD/JPY Gives Back Recent Gains
EUR/USD is recovering losses from 1.1450. USD/JPY is correcting gains from 160.50 and might decline further below 158.00.
Important Takeaways for EUR/USD and USD/JPY Analysis Today
· The Euro struggled to stay in a

European Currencies Decline: Pound Hits New Lows, Euro Under Pressure
European currencies continue to weaken against the US dollar amid rising geopolitical tensions and increased demand for safe-haven and liquid assets. Market participants are reducing exposure to riskier instruments, putting pressure on both the euro and the pound. Additional support