


FXOpen

AUD/USD failed to stay in a positive zone and declined below 0.6650. NZD/USD is also moving lower and might extend losses below 0.5845.
Important Takeaways for AUD/USD and NZD/USD Analysis Today
- The Aussie Dollar started a fresh decline from well above 0.6680 against the US Dollar.
- There is a connecting bearish trend line forming with resistance at 0.6610 on the hourly chart of AUD/USD at FXOpen.
- NZD/USD declined steadily from 0.6000 and traded below 0.5900.
- There was a break above a connecting bearish trend line with resistance at 0.5860 on the hourly chart of NZD/USD at FXOpen.
AUD/USD Technical Analysis
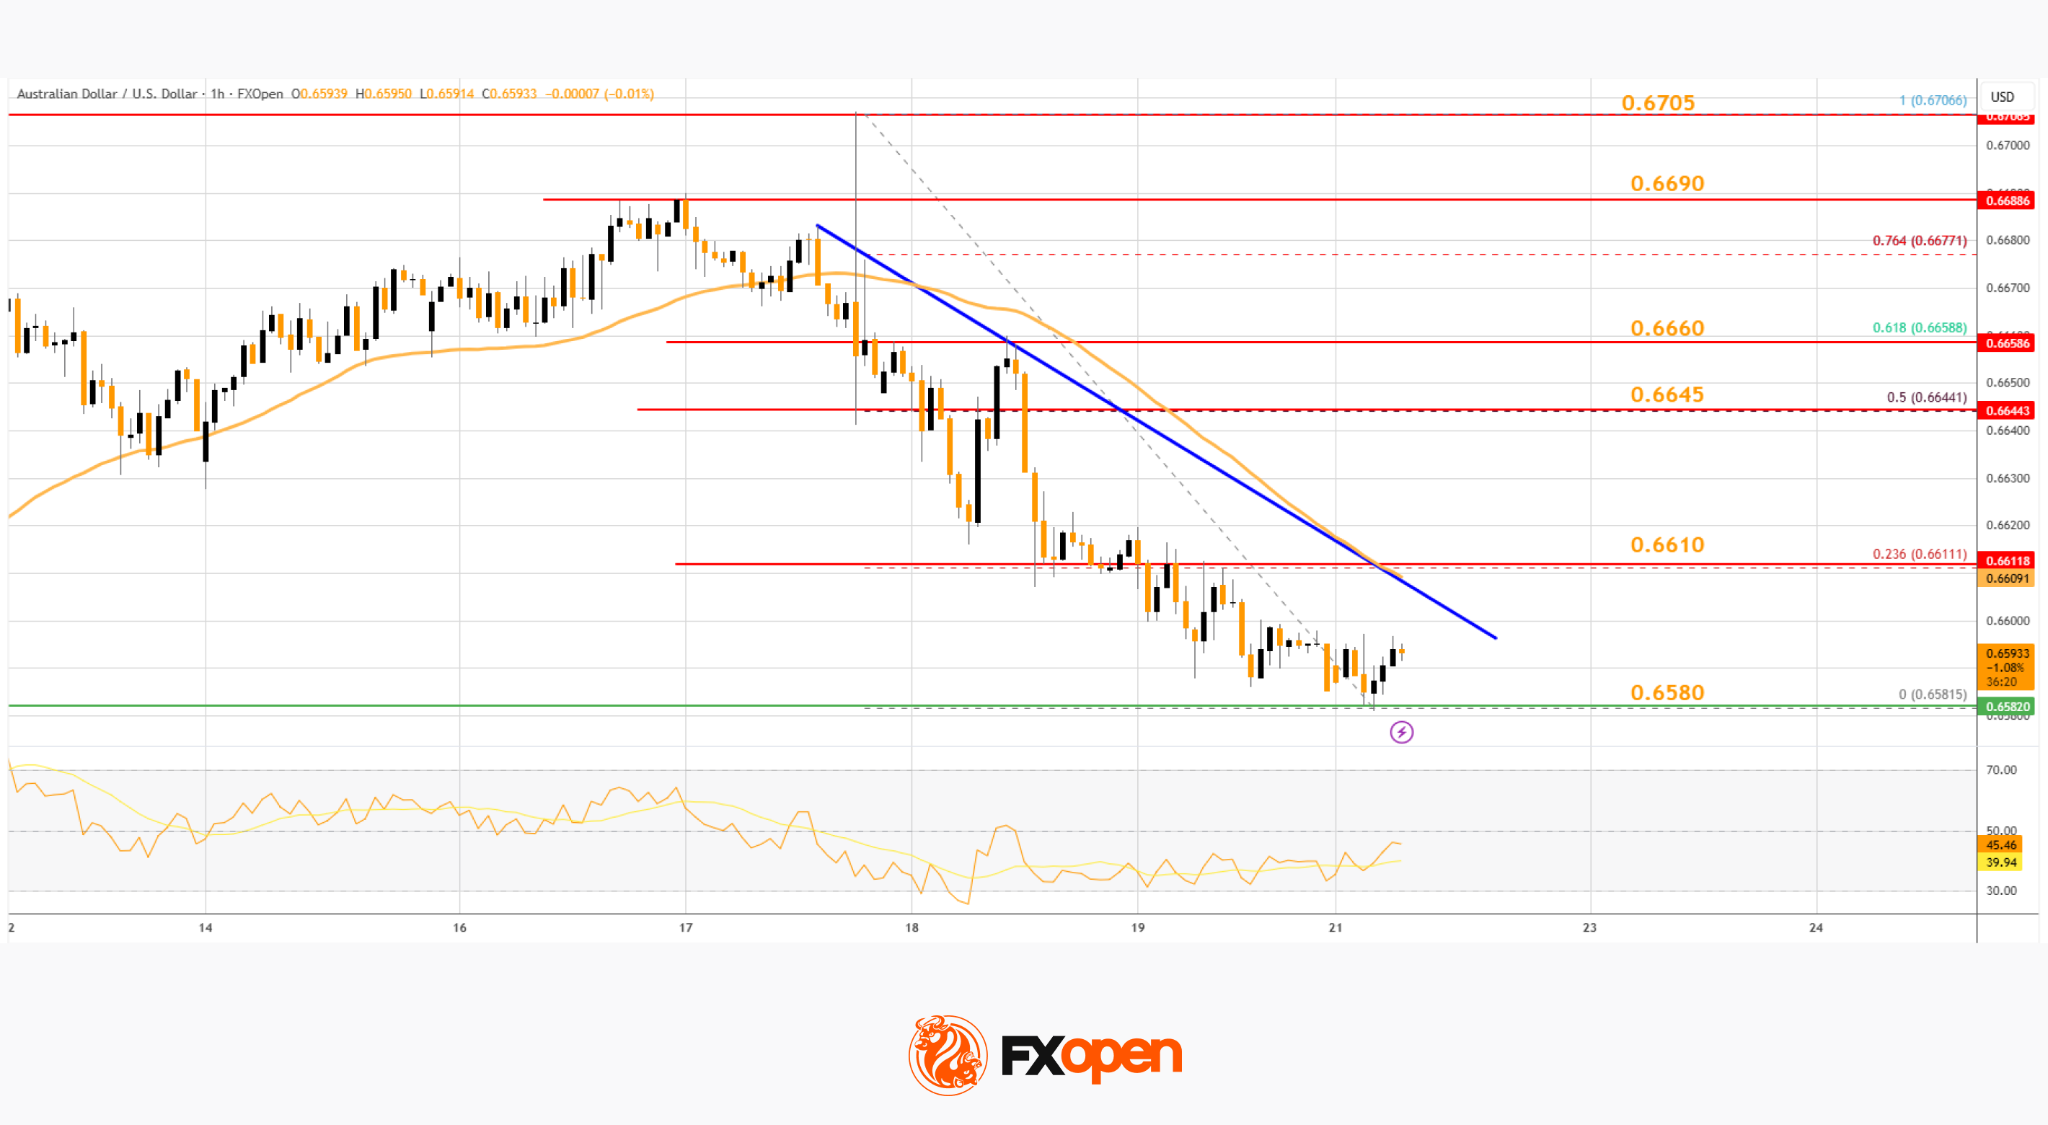
On the hourly chart of AUD/USD at FXOpen, the pair struggled to clear 0.6700. The Aussie Dollar started a fresh decline below 0.6650 against the US Dollar.
The pair even settled below 0.6620 and the 50-hour simple moving average. There was a clear move below 0.6600. A low was formed at 0.6581 and the pair is now consolidating losses below the 23.6% Fib retracement level of the downward move from the 0.6706 swing high to the 0.6581 low.
On the upside, immediate resistance is near a connecting bearish trend line at 0.6610 and the 50-hour simple moving average. The next major hurdle for the bulls could be near 0.6645 and the 50% Fib retracement.
The main selling point could be 0.6660, above which the price could rise toward 0.6690. Any more gains might send the pair toward 0.6700. A close above 0.6700 could start another steady increase in the near term. In the stated case, the next key resistance on the AUD/USD chart could be 0.6750.
On the downside, initial support is near 0.6580. The next area of interest might be 0.6550. If there is a downside break below 0.6550, the pair could extend its decline. The next target for the bears might be 0.6500. Any more losses might send the pair toward 0.6420.
NZD/USD Technical Analysis
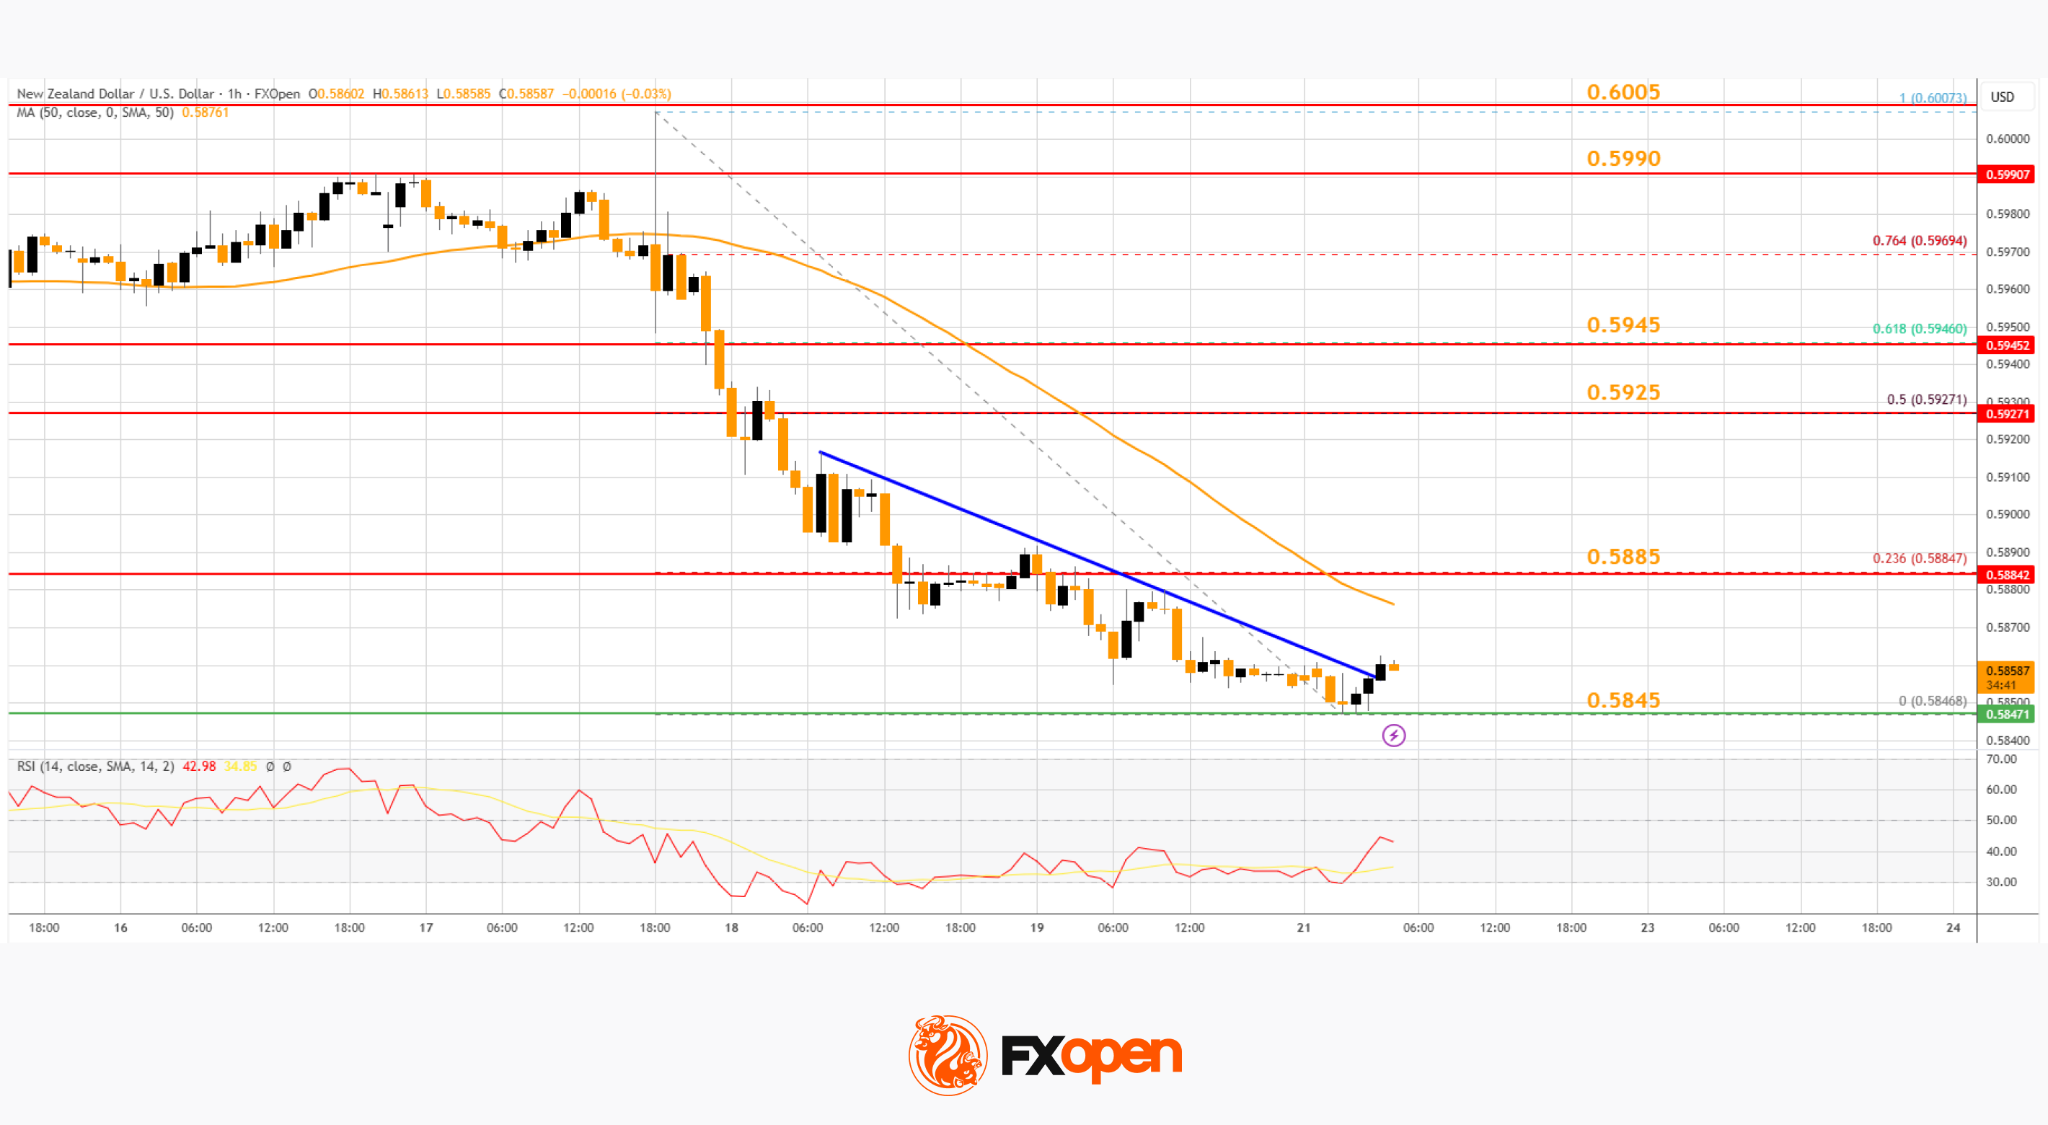
On the hourly chart of NZD/USD on FXOpen, the pair also followed a similar pattern and declined from the 0.6000 zone. The New Zealand Dollar moved down and traded below 0.5950 against the US Dollar.
The pair settled below 0.5920 and the 50-hour simple moving average. Finally, it tested 0.5845 and is currently consolidating losses. There was a minor increase above a connecting bearish trend line with resistance at 0.5860.
If the pair recovers, it could face hurdles near the 23.6% Fib retracement level of the downward move from the 0.6007 swing high to the 0.5846 low at 0.5885 and the 50-hour simple moving average.
The next major barrier is at 0.5925 since it coincides with the 50% Fib retracement. If there is a move above 0.5925, the pair could rise toward 0.5945. Any more gains might open the doors for a move toward 0.5990 in the coming days.
On the downside, immediate support on the NZD/USD chart is near the 0.5845 level. The next major stop for the bears might be 0.5800. If there is a downside break below 0.5800, the pair could extend its decline toward 0.5750. The main target for the bears could be 0.5720.
Trade over 50 forex markets 24 hours a day with FXOpen. Take advantage of low commissions, deep liquidity, and spreads from 0.0 pips (additional fees may apply). Open your FXOpen account now or learn more about trading forex with FXOpen.
This article represents the opinion of the Companies operating under the FXOpen brand only. It is not to be construed as an offer, solicitation, or recommendation with respect to products and services provided by the Companies operating under the FXOpen brand, nor is it to be considered financial advice.
Stay ahead of the market!
Subscribe now to our mailing list and receive the latest market news and insights delivered directly to your inbox.


Latest articles

Tesla (TSLA) Shares Surge Following Musk’s Announcements
According to the chart, Tesla (TSLA) shares had been under significant pressure since the start of 2026: from their December high, they had lost around 25% of their value. The main bearish drivers included:
→ Intense competition from Chinese automakers, particularly

XTI/USD Analysis: WTI Oil Prices Under Pressure from Trump’s Statements
Yesterday, following a false bullish breakout above the psychological $100 level, WTI crude prices fell sharply towards the $85 area. The primary driver of this rapid decline was comments made by the US President.
According to Donald Trump:
→ the United
