


FXOpen

AUD/USD started a fresh increase above 0.6970 and 0.7000. NZD/USD is also rising and might aim for more gains above 0.5850.
Important Takeaways for AUD USD and NZD USD Analysis Today
· The Aussie Dollar started a steady increase above 0.7000 against the US Dollar.
· There was a break above a rising channel with resistance at 0.6960 on the hourly chart of AUD/USD at FXOpen.
· NZD/USD is consolidating gains above the 0.5755 pivot zone.
· There was a break above a key contracting triangle with resistance at 0.5710 on the hourly chart of NZD/USD at FXOpen.
AUD/USD Technical Analysis
On the hourly chart of AUD/USD at FXOpen, the pair started a fresh increase from 0.6860. The Aussie Dollar was able to clear 0.6900 to move into a positive zone against the US Dollar.
There was a break above a rising channel with resistance at 0.6960. There was a close above 0.7000 and the 50-hour simple moving average. Finally, the pair tested 0.7080. A high was formed near 0.7084 and the pair recently started a consolidation phase. There was a minor decline below 0.7075.
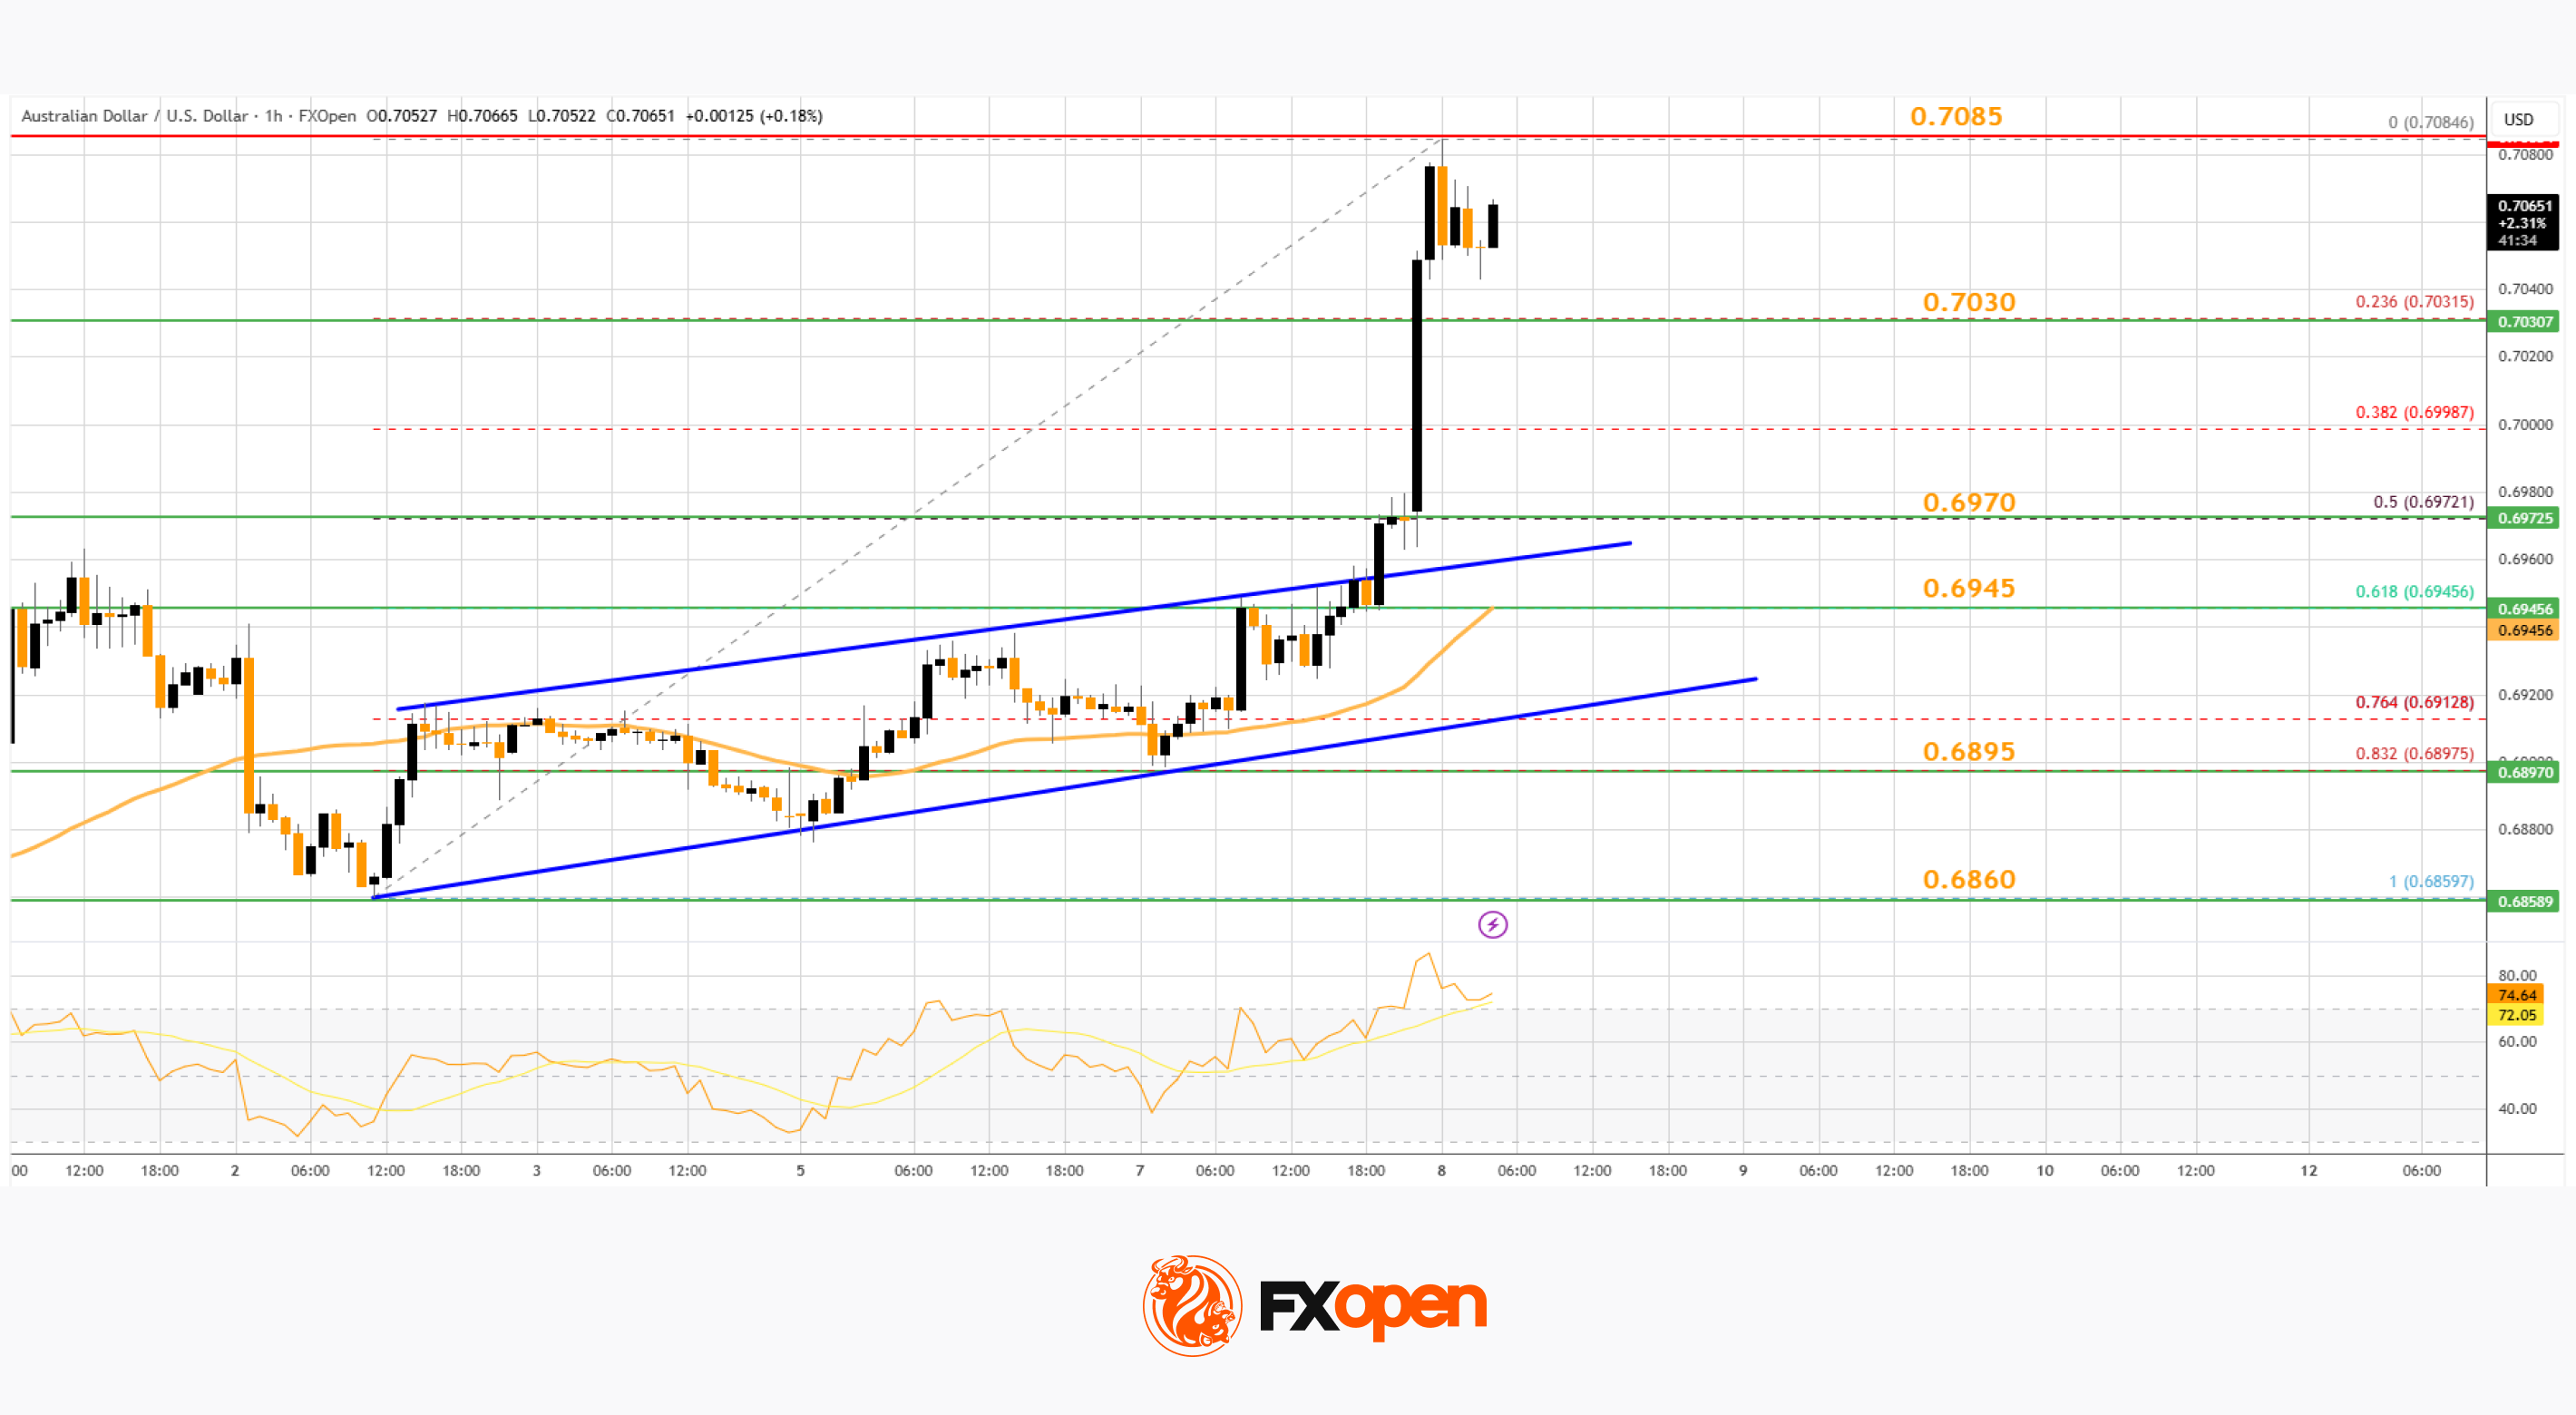
On the downside, initial support is near the 23.6% Fib retracement level of the upward move from the 0.6859 swing low to the 0.7084 high. The next area of interest could be near 0.6970 and the 50% Fib retracement.
If there is a downside break below 0.6970, the pair could extend its decline toward the 0.6945 zone and the 50-hour simple moving average. Any more losses might signal a move toward 0.6895.
On the upside, the AUD/USD chart indicates that the pair is now facing resistance near 0.7085. The first major hurdle for the bulls might be 0.7120. An upside break above 0.7120 might send the pair further higher. The next stop is near 0.7200. Any more gains could clear the path for a move toward 0.7320.
NZD/USD Technical Analysis
On the hourly chart of NZD/USD on FXOpen, the pair started a fresh increase from 0.5675. The New Zealand Dollar broke the 0.5720 barrier to start the recent rally against the US Dollar.
More importantly, there was a break above a key contracting triangle with resistance at 0.5710. The pair settled above 0.5755 and the 50-hour simple moving average.
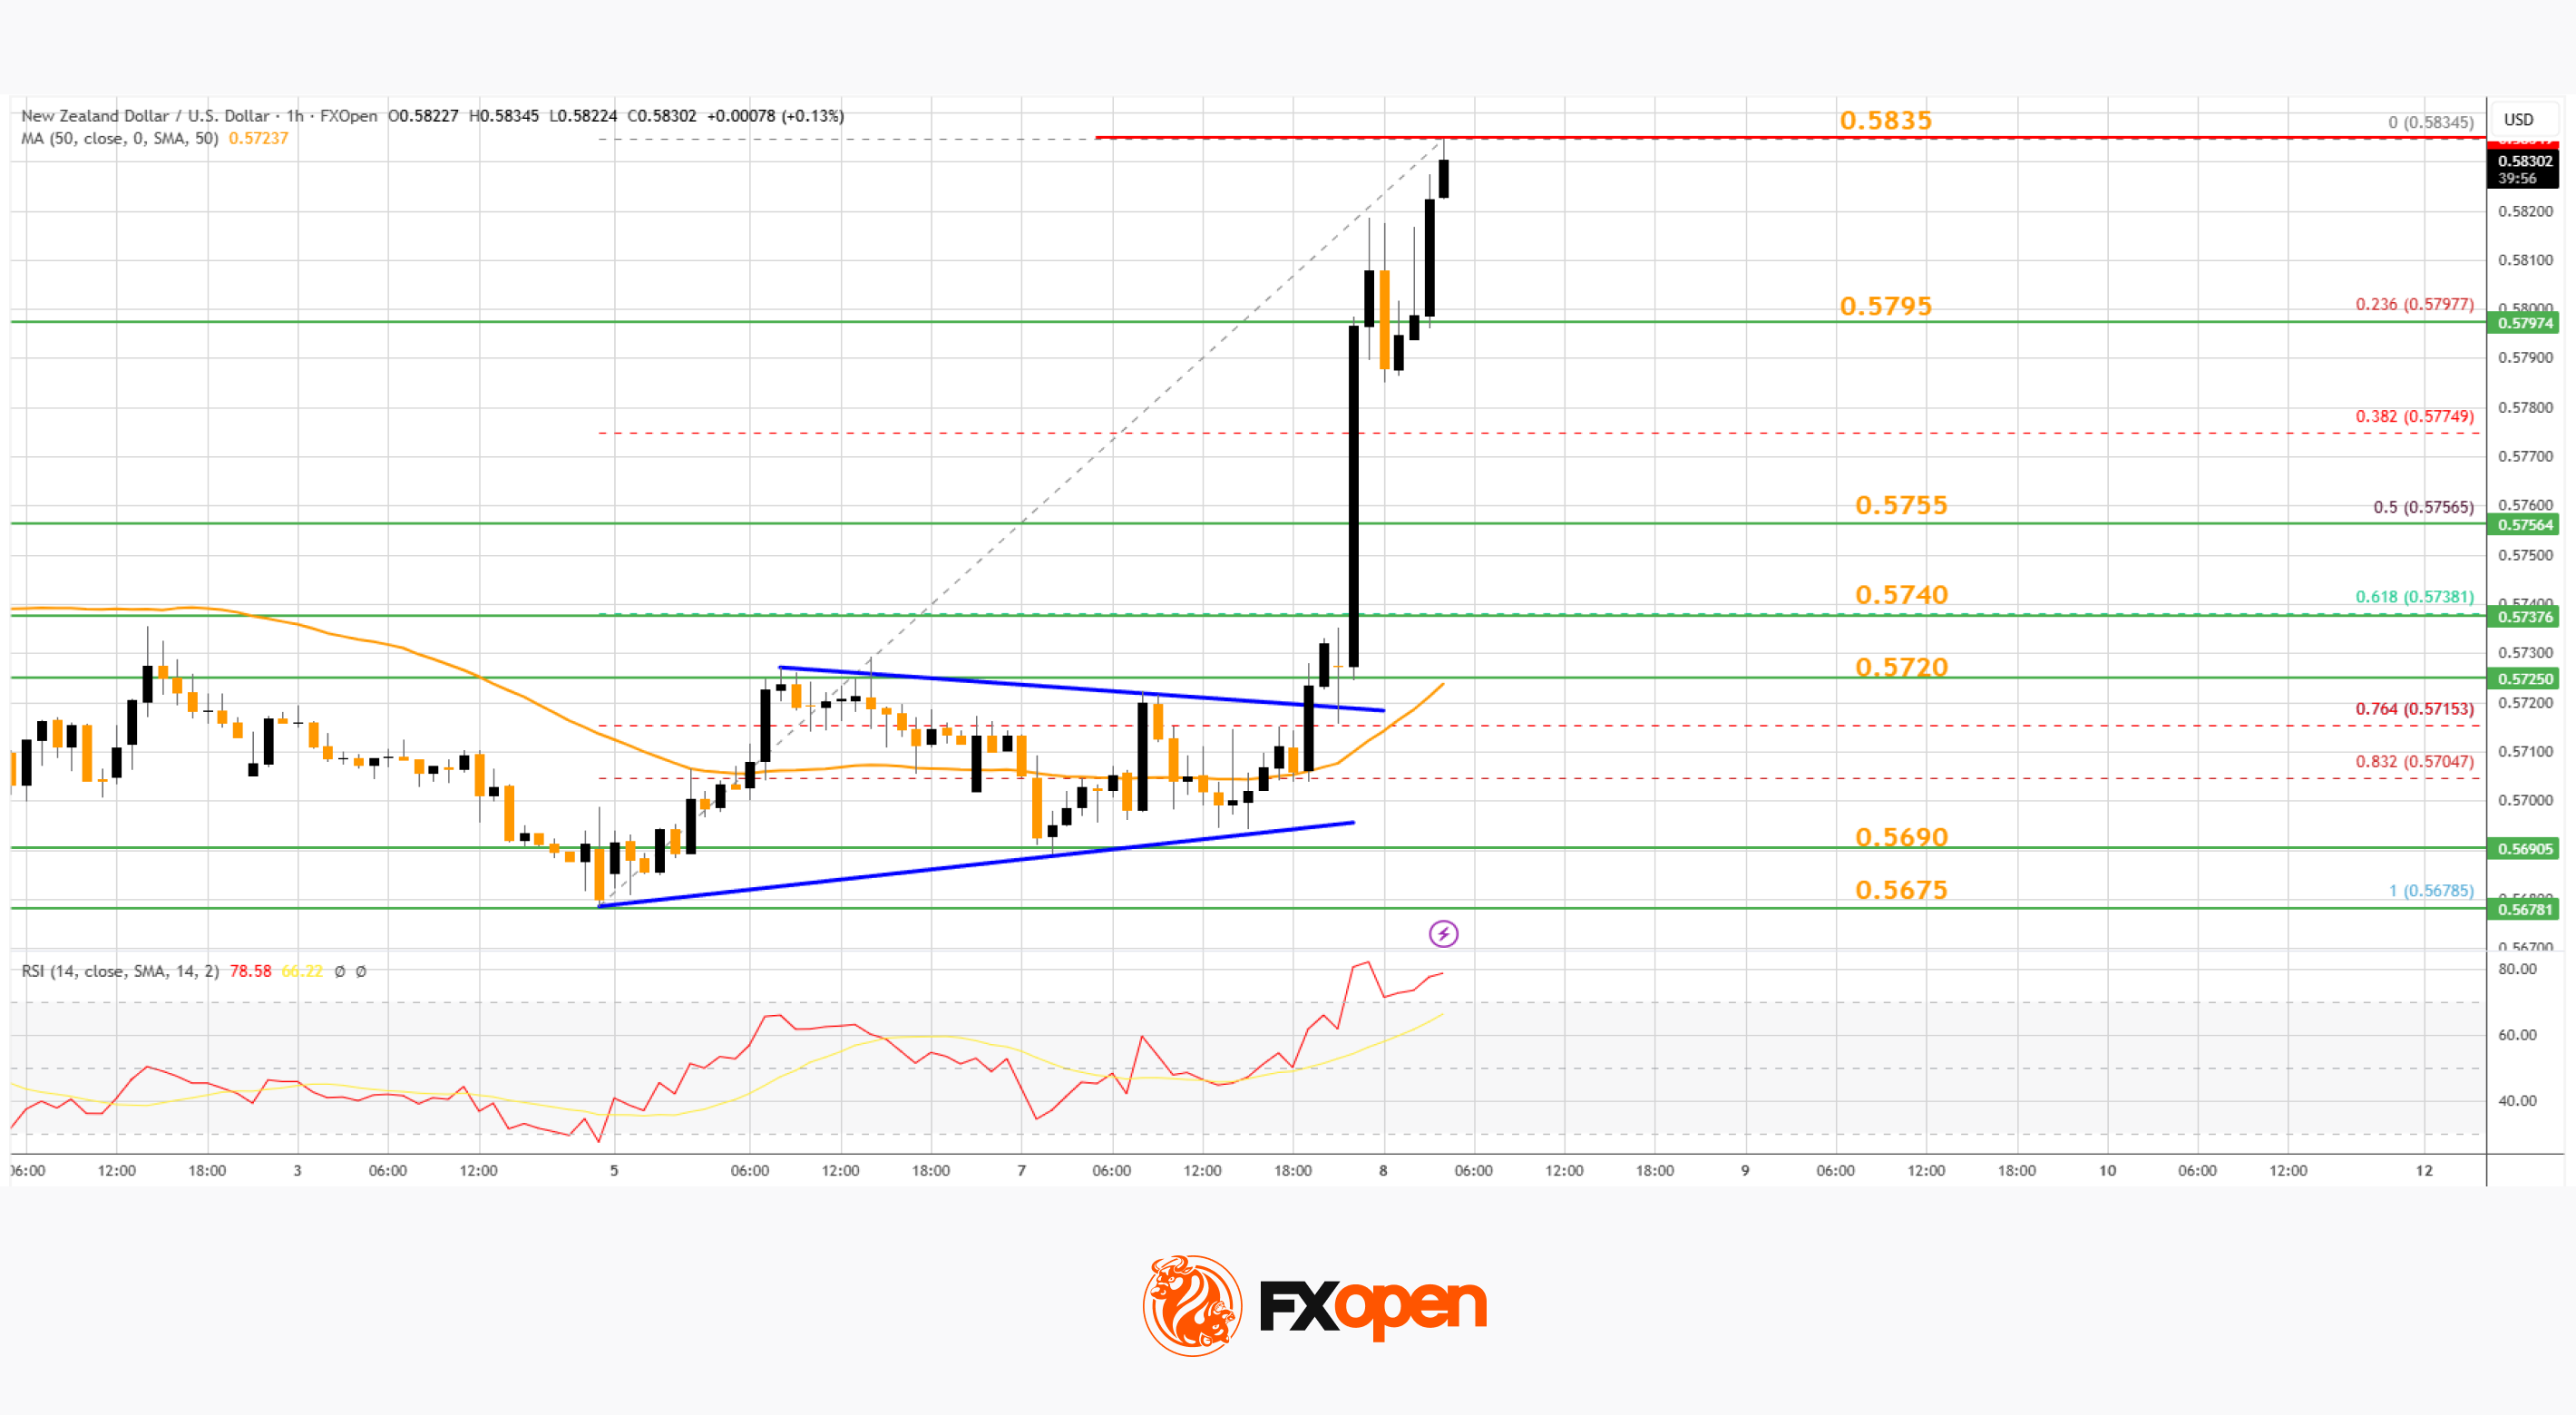
It tested 0.5835 and is currently consolidating gains. There was a minor pullback below 0.5820. The NZD/USD chart suggests that the RSI is now just above 70. On the upside, the pair might struggle near 0.5835. The next major hurdle is near the 0.5880 pivot level.
A clear move above 0.5880 might even push the pair toward 0.6950. Any more gains might clear the path for a move toward the 0.7000 zone in the coming days.
On the downside, immediate support is near the 0.5795 level and the 23.6% Fib retracement level of the upward move from the 0.5678 swing low to the 0.5834 high.
The first key zone for the bulls sits at 0.5755 and the 50% Fib retracement. The next important level is 0.5720 and the 50-hour simple moving average. If there is a downside break below 0.5720, the pair might slide toward 0.5690. Any more losses could lead NZD/USD into a bearish zone to 0.5650.
Trade over 50 forex markets 24 hours a day with FXOpen. Take advantage of low commissions, deep liquidity, and spreads from 0.0 pips (additional fees may apply). Open your FXOpen account now or learn more about trading forex with FXOpen.
This article represents the opinion of the Companies operating under the FXOpen brand only. It is not to be construed as an offer, solicitation, or recommendation with respect to products and services provided by the Companies operating under the FXOpen brand, nor is it to be considered financial advice.
Stay ahead of the market!
Subscribe now to our mailing list and receive the latest market news and insights delivered directly to your inbox.


Latest articles


FOMC Minutes in Focus: USD/JPY and USD/CAD Pull Back from Highs
The US dollar has shifted into a corrective phase following its previous rally, while market participants adopt a wait-and-see approach ahead of the release of the Federal Reserve’s meeting minutes. The weakening of the dollar has already led to

NVDA Shares Approach Key Resistance
Nvidia’s chip production is concentrated with Taiwanese contractor TSMC, increasing the company’s exposure to geopolitical risks and US export policy. Restrictions on shipments to China, including decisions related to H20-series chips, have led to significant financial adjustments, which