


FXOpen

AUD/USD is consolidating gains near the 0.6620 zone. NZD/USD is trimming gains and struggling to stay above the 0.6000 pivot zone.
Important Takeaways for AUD/USD and NZD/USD Analysis Today
· The Aussie Dollar started a downside correction from 0.6640 against the US Dollar.
· There is a key bullish trend line forming with support at 0.6610 on the hourly chart of AUD/USD at FXOpen.
· NZD/USD is declining from the 0.6080 resistance zone.
· There is a major bullish trend line forming with support at 0.6010 on the hourly chart of NZD/USD at FXOpen.
AUD/USD Technical Analysis
On the hourly chart of AUD/USD at FXOpen, the pair started a fresh increase from the 0.6500 support. The Aussie Dollar was able to clear the 0.6580 resistance to move into a positive zone against the US Dollar.
There was a close above the 0.6600 resistance and the 50-hour simple moving average. Finally, the pair tested the 0.6640 zone. A high was formed near 0.6642 and the pair is now correcting gains.
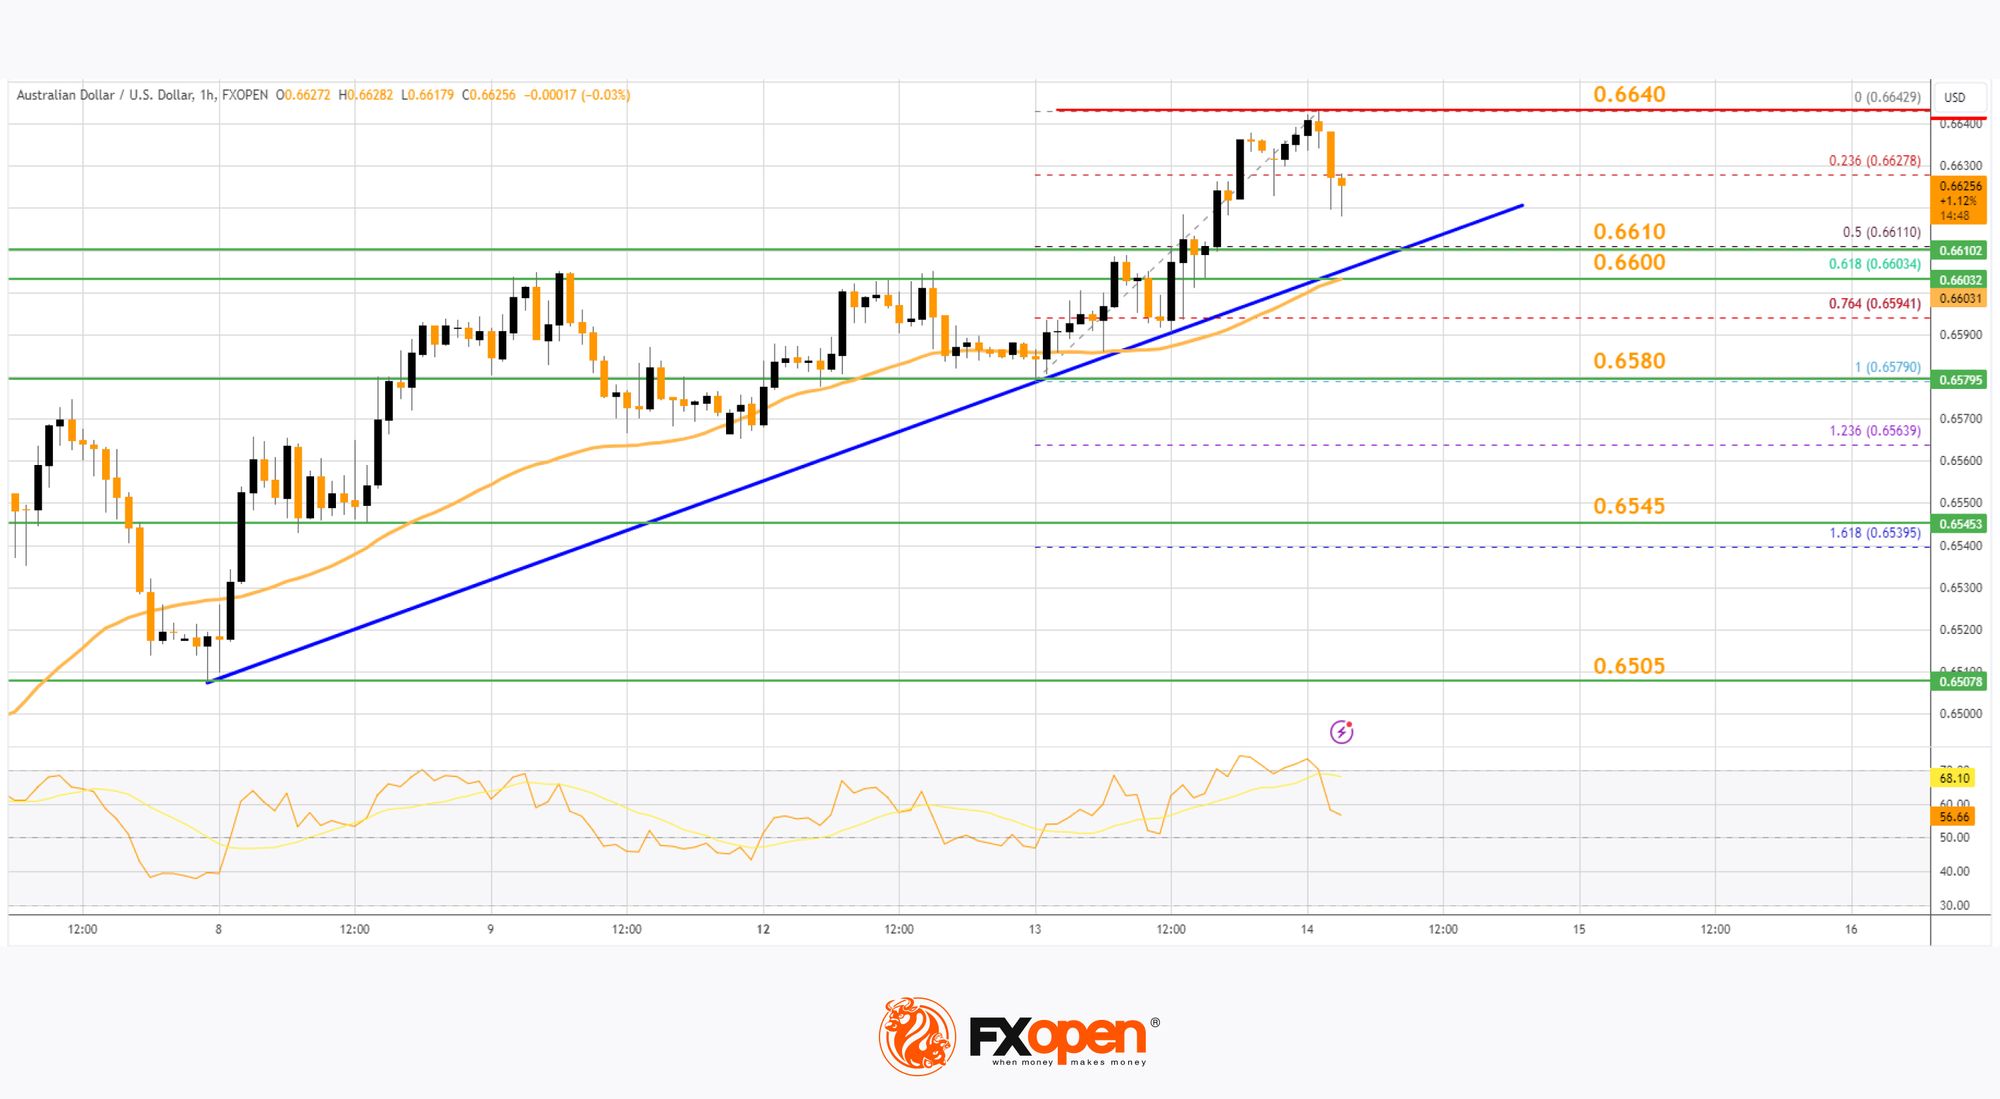
There was a move below the 0.6630 level. The pair declined below the 23.6% Fib retracement level of the upward move from the 0.6579 swing low to the 0.6642 high. On the downside, initial support is near a key bullish trend line at 0.6610.
The next major support is near the 61.8% Fib retracement level of the upward move from the 0.6579 swing low to the 0.6642 high at 0.6600.
If there is a downside break below the 0.6600 support, the pair could extend its decline toward the 0.6580 level. Any more losses might signal a move toward 0.6545.
On the upside, the AUD/USD chart indicates that the pair is now facing resistance near 0.6640. The first major resistance might be 0.6650. An upside break above the 0.6650 resistance might send the pair further higher.
The next major resistance is near the 0.6700 level. Any more gains could clear the path for a move toward the 0.6740 resistance zone.
NZD/USD Technical Analysis
On the hourly chart of NZD/USD on FXOpen, the pair started a steady increase from the 0.6000 zone. The New Zealand Dollar broke the 0.6035 resistance to start the recent increase against the US Dollar.
The pair climbed above 0.6060 and the 50-hour simple moving average. It tested the 0.6080 zone and is currently correcting gains. The pair corrected lower below the 0.6060 level. The pair also traded below the 50% Fib retracement level of the upward wave from the 0.5988 swing low to the 0.6081 high.
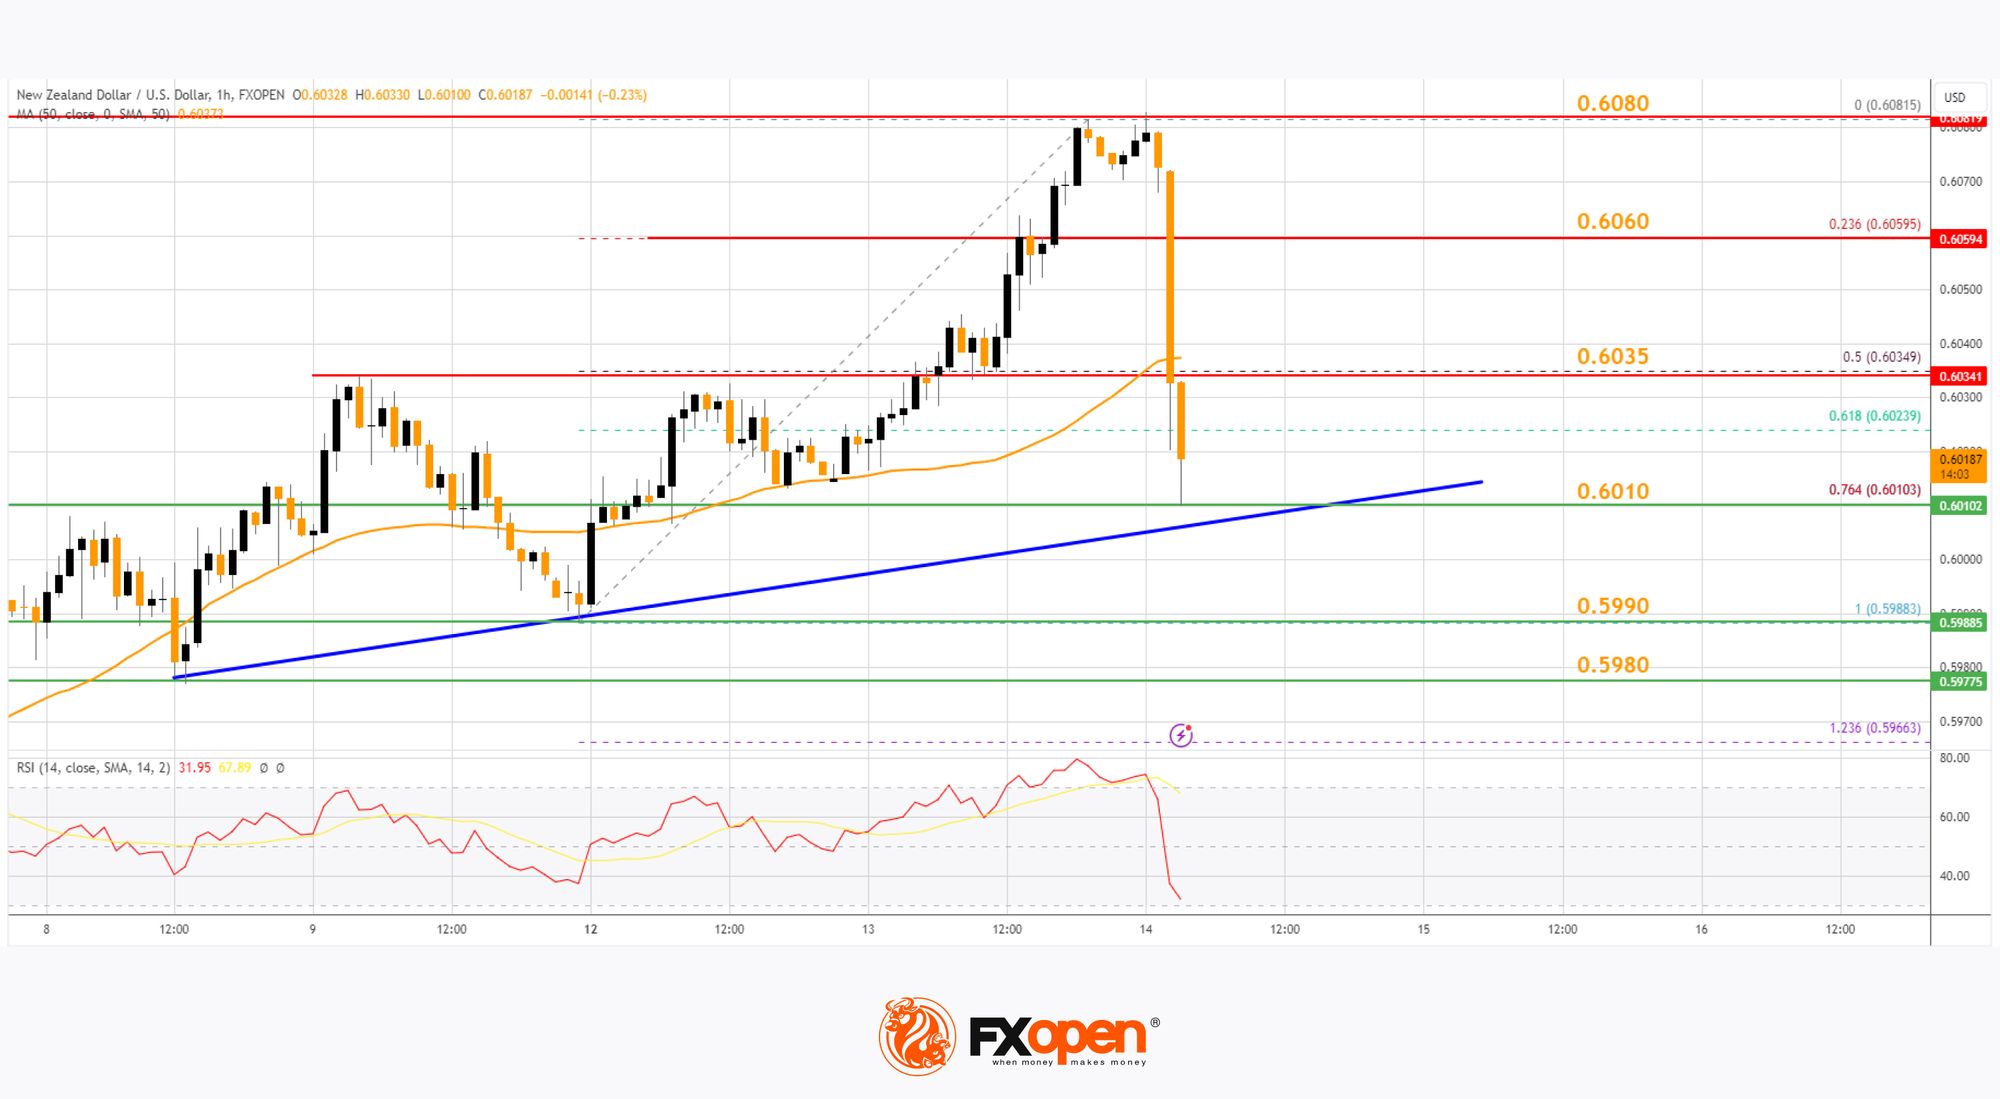
The NZD/USD chart suggests that the RSI is now well below 50 and signaling more downsides. On the downside, there is major support forming near 0.6010 and a trend line.
The trend line is close to the 76.4% Fib retracement level of the upward wave from the 0.5988 swing low to the 0.6081 high. The next major support is near the 0.5990 level.
If there is a downside break below the 0.5990 support, the pair might slide toward the 0.5980 support. Any more losses could lead NZD/USD in a bearish zone to 0.5950.
On the upside, the pair might struggle near 0.6035. The next major resistance is near the 0.6060 level. A clear move above the 0.6060 level might even push the pair toward the 0.6080 level. Any more gains might clear the path for a move toward the 0.6200 resistance zone in the coming days.
Trade over 50 forex markets 24 hours a day with FXOpen. Take advantage of low commissions, deep liquidity, and spreads from 0.0 pips (additional fees may apply). Open your FXOpen account now or learn more about trading forex with FXOpen.
This article represents the opinion of the Companies operating under the FXOpen brand only. It is not to be construed as an offer, solicitation, or recommendation with respect to products and services provided by the Companies operating under the FXOpen brand, nor is it to be considered financial advice.
Stay ahead of the market!
Subscribe now to our mailing list and receive the latest market news and insights delivered directly to your inbox.


Latest articles

European Currencies Decline: Pound Hits New Lows, Euro Under Pressure
European currencies continue to weaken against the US dollar amid rising geopolitical tensions and increased demand for safe-haven and liquid assets. Market participants are reducing exposure to riskier instruments, putting pressure on both the euro and the pound. Additional support

Market Analysis: GBP/USD Dips Further As EUR/GBP Regains Traction
GBP/USD failed to climb above 1.3500 and corrected some gains. EUR/GBP started a decent increase and might aim for more gains above 0.8700.
Important Takeaways for GBP/USD and EUR/GBP Analysis Today
· The British Pound
