


FXOpen

AUD/USD is consolidating gains near 0.6550. NZD/USD is trimming gains and struggling to stay above the 0.5700 pivot zone.
Important Takeaways for AUD/USD and NZD/USD Analysis Today
· The Aussie Dollar started a downside correction from 0.6620 against the US Dollar.
· There was a break below a key bullish trend line with support at 0.6570 on the hourly chart of AUD/USD at FXOpen.
· NZD/USD is declining from the 0.5800 resistance zone.
· There is a short-term declining channel forming with resistance near 0.5730 on the hourly chart of NZD/USD at FXOpen.
AUD/USD Technical Analysis
On the hourly chart of AUD/USD at FXOpen, the pair started a fresh increase from 0.6480. The Aussie Dollar was able to clear 0.6550 to move into a positive zone against the US Dollar.
There was also a move above 0.6580 and the 50-hour simple moving average. Finally, the pair tested 0.6600. A high was formed near 0.6617 and the pair is now correcting gains. There was a move below 0.6600 and a key bullish trend line with support at 0.6570.
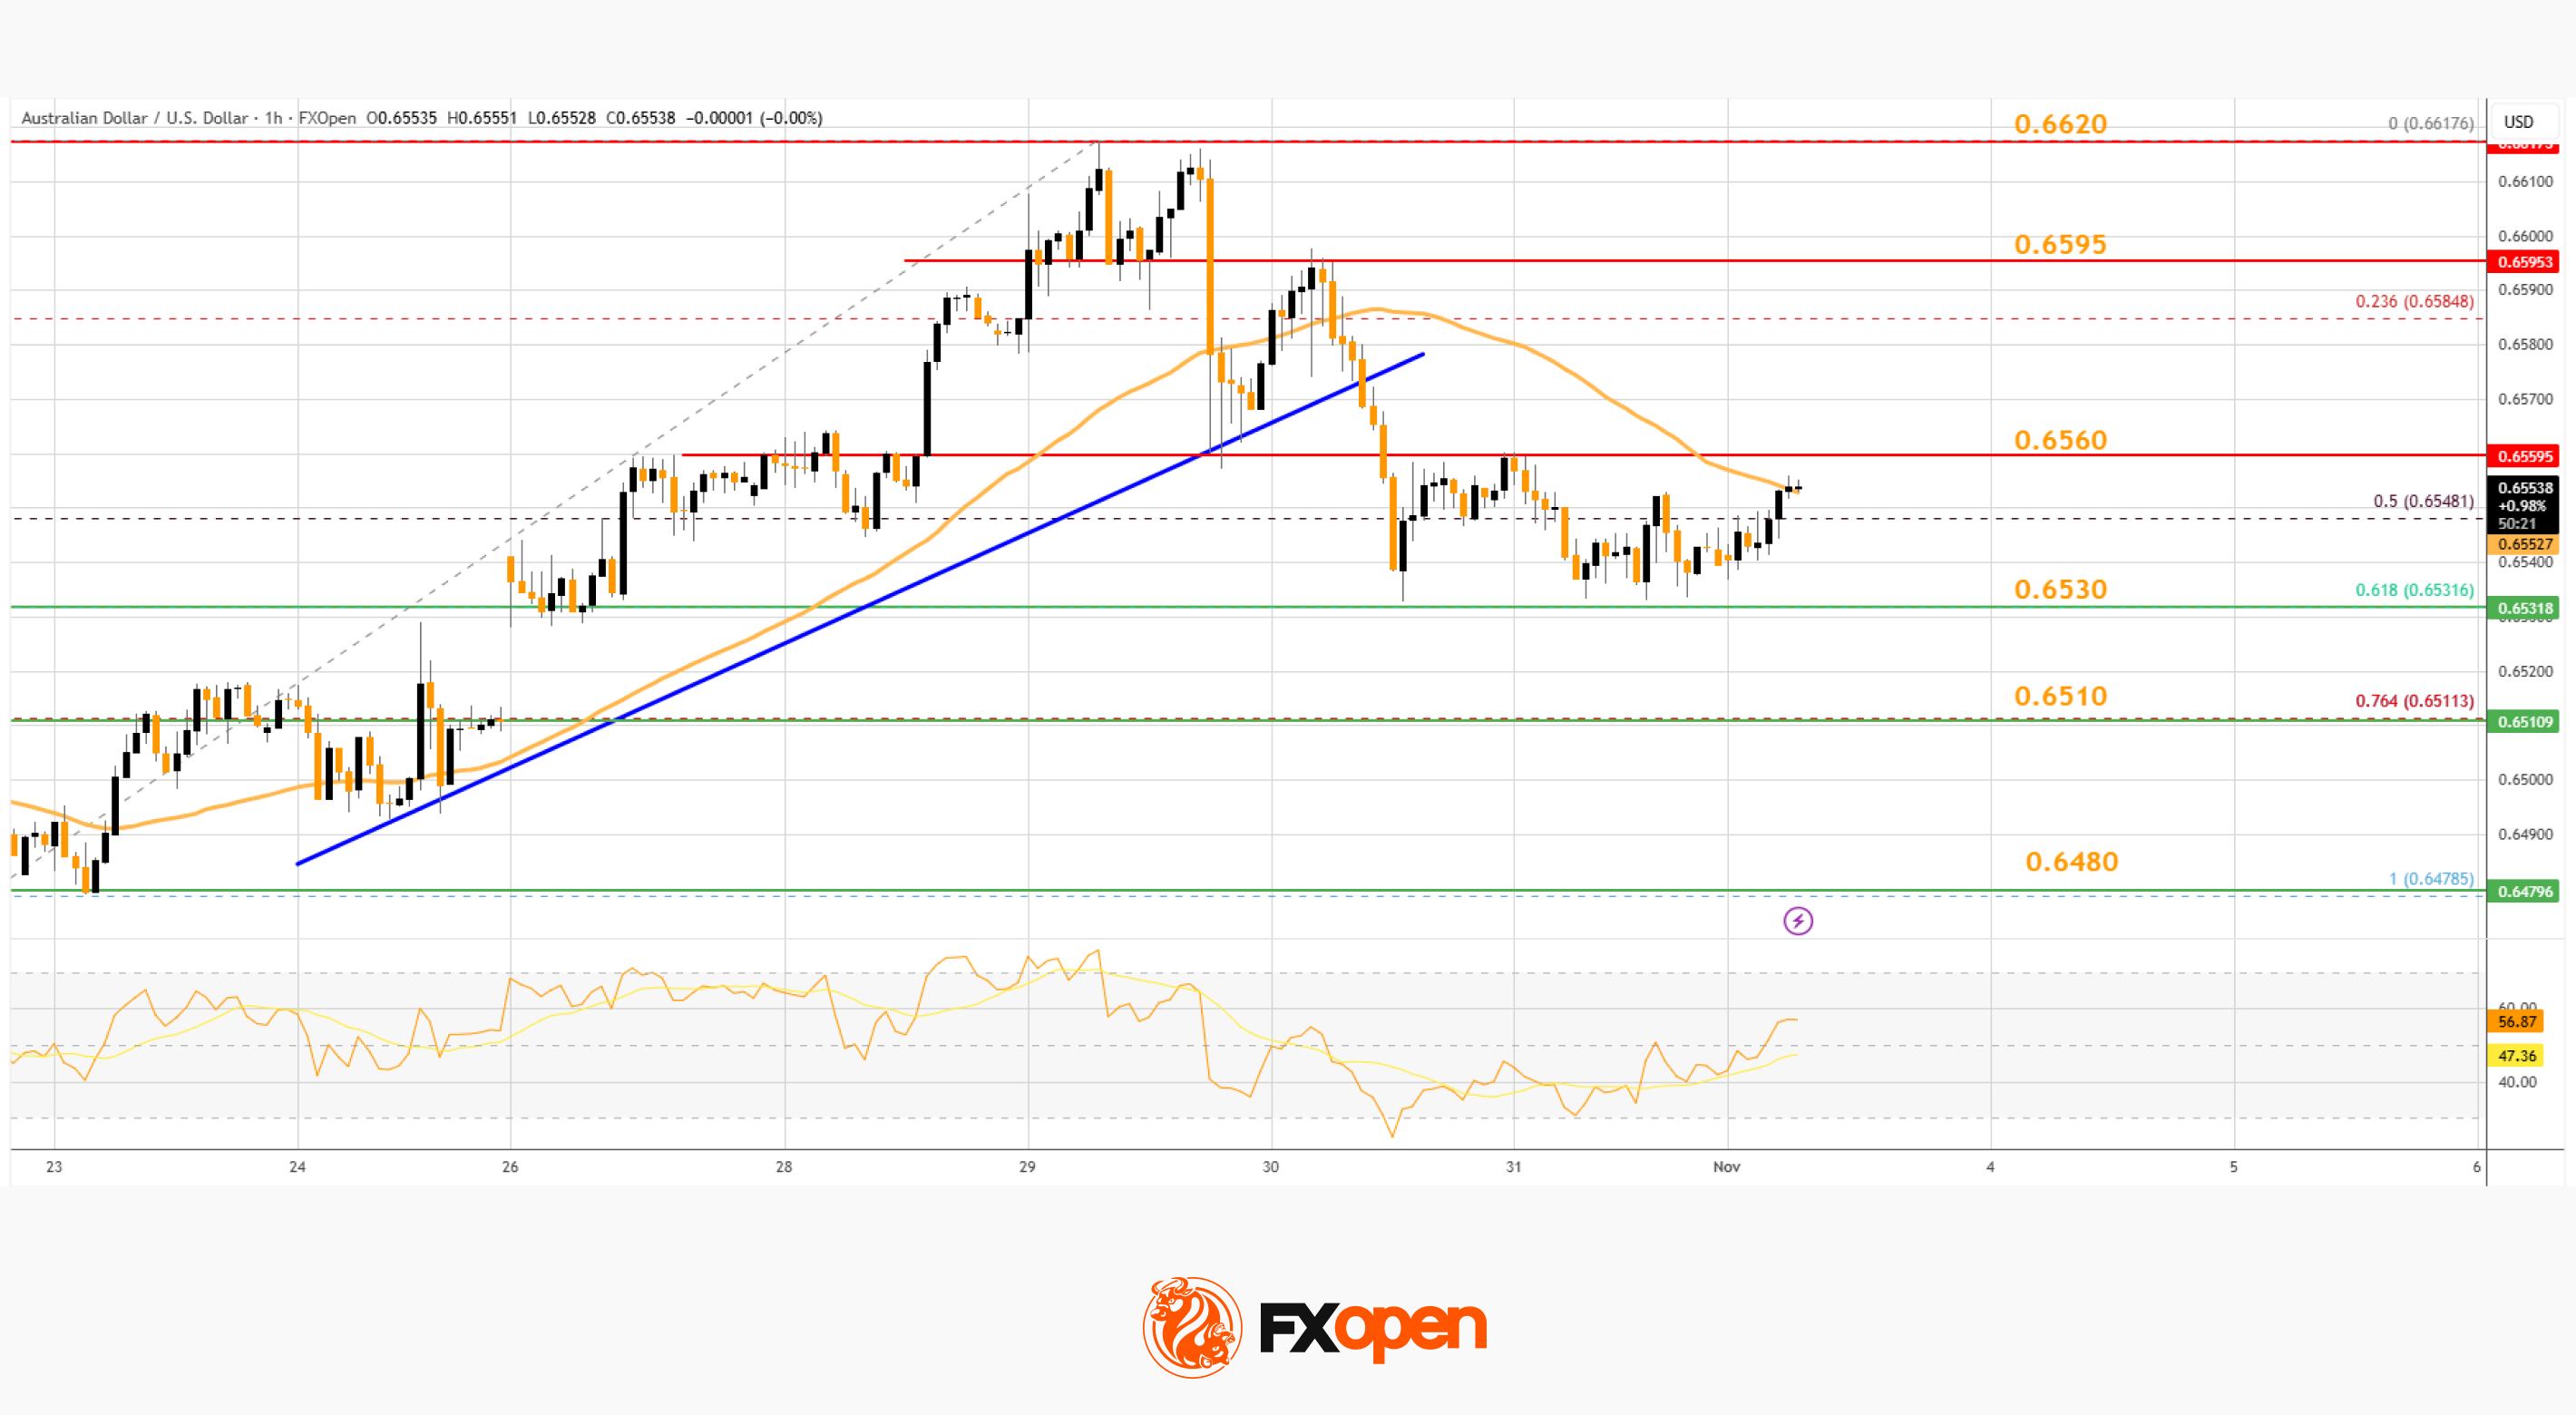
The pair declined below the 50% Fib retracement level of the upward move from the 0.6478 swing low to the 0.6617 high. On the downside, initial support is near the 61.8% Fib retracement at 0.6530.
The next key area to watch could be 0.6510. If there is a downside break below 0.6510, the pair could extend its decline toward 0.6480. Any more losses might signal a move toward 0.6420.
On the upside, the AUD/USD chart indicates that the pair is now facing hurdles near 0.6560. The first key breakout zone might be 0.6595. An upside break above 0.6595 might send the pair further higher. The next stop for the bulls could be 0.6620. Any more gains could clear the path for a move toward 0.6720.
NZD/USD Technical Analysis
On the hourly chart of NZD/USD on FXOpen, the pair attempted another wave above 0.5800 but failed. The New Zealand Dollar started another downward move from 0.5800 and dipped below 0.5750 against the US Dollar.
The pair settled below 0.5730 and the 50-hour simple moving average. It tested the 0.5710 zone and is currently consolidating losses below the 23.6% Fib retracement level of the downward move from the 0.5801 swing high to the 0.5711 low.
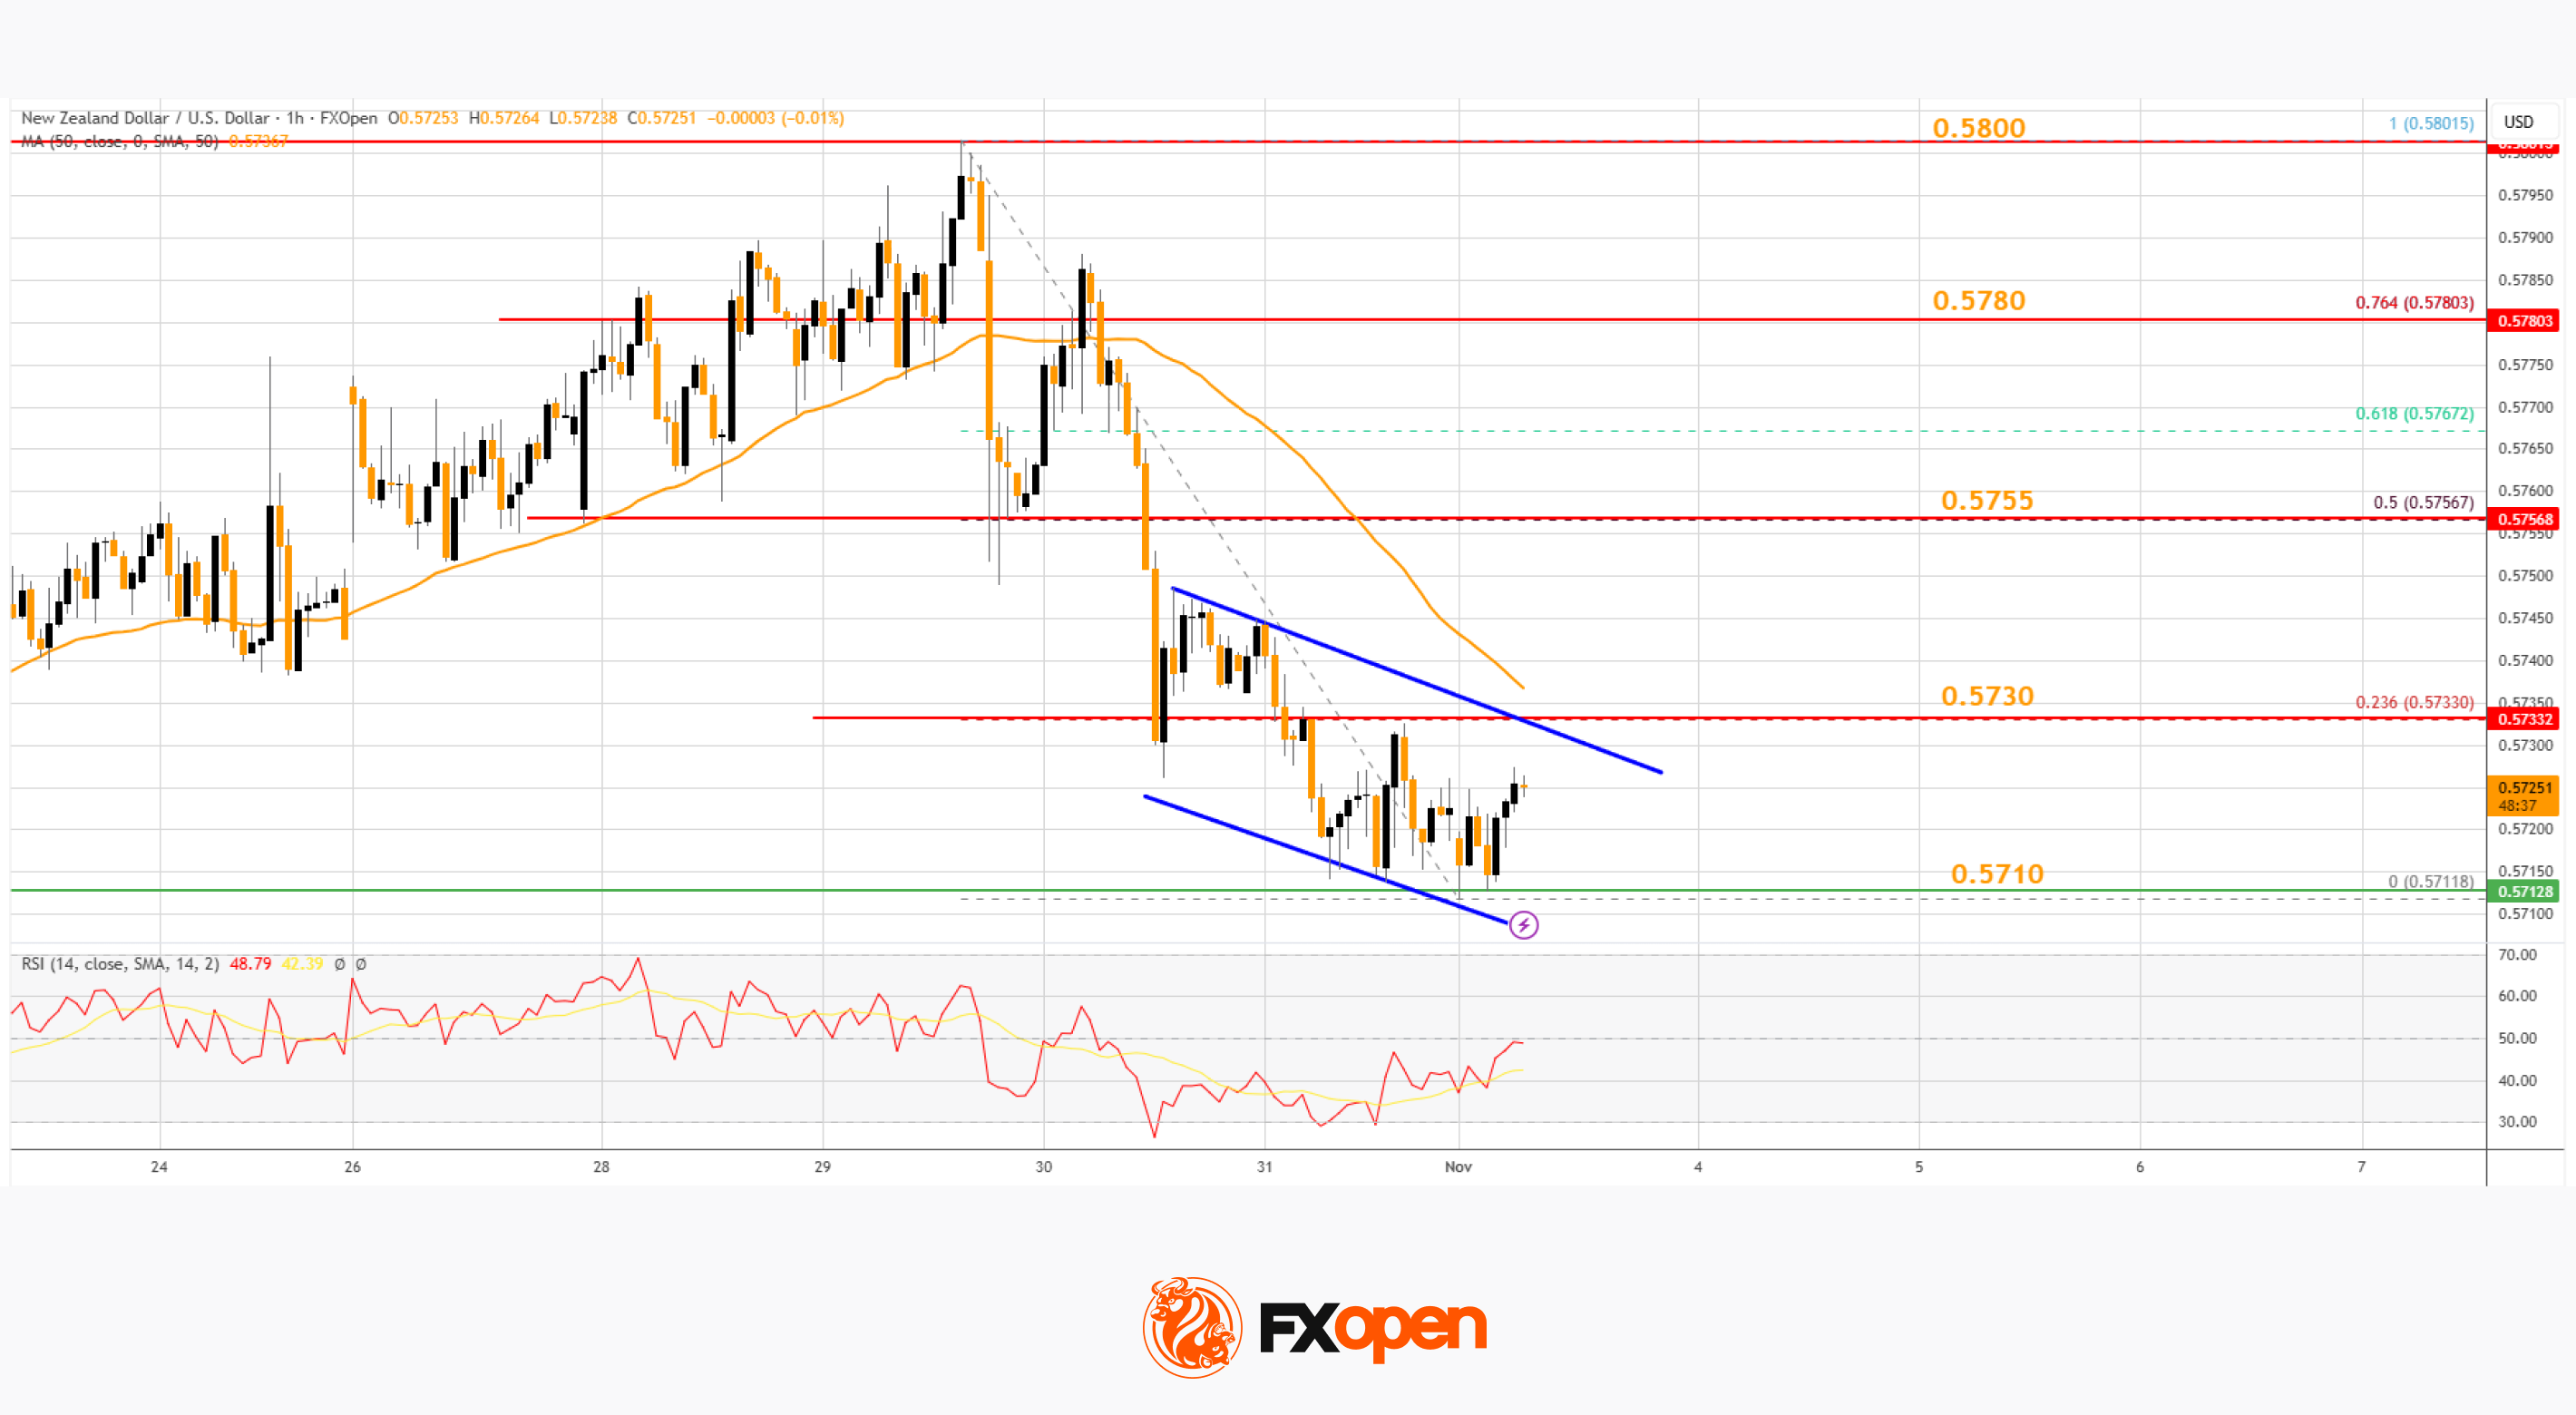
The NZD/USD chart suggests that the RSI is now near 50 and the pair is attempting to recover. On the upside, the pair might struggle near 0.5730, the 50-hour simple moving average, and a short-term declining channel.
A clear move above 0.5730 might even push the pair toward the 50% Fib retracement at 0.5755. Any more gains might clear the path for a move toward 0.5800 in the coming days.
On the downside, there is major support forming near 0.5710 and 0.5700. The next key area of interest might be 0.5650. If there is a downside break below 0.5650, the pair might slide toward 0.5620. Any more losses could lead NZD/USD into a bearish zone to 0.5580.
Trade over 50 forex markets 24 hours a day with FXOpen. Take advantage of low commissions, deep liquidity, and spreads from 0.0 pips (additional fees may apply). Open your FXOpen account now or learn more about trading forex with FXOpen.
This article represents the opinion of the Companies operating under the FXOpen brand only. It is not to be construed as an offer, solicitation, or recommendation with respect to products and services provided by the Companies operating under the FXOpen brand, nor is it to be considered financial advice.
Stay ahead of the market!
Subscribe now to our mailing list and receive the latest market news and insights delivered directly to your inbox.


Latest articles

Tesla (TSLA) Shares Surge Following Musk’s Announcements
According to the chart, Tesla (TSLA) shares had been under significant pressure since the start of 2026: from their December high, they had lost around 25% of their value. The main bearish drivers included:
→ Intense competition from Chinese automakers, particularly

XTI/USD Analysis: WTI Oil Prices Under Pressure from Trump’s Statements
Yesterday, following a false bullish breakout above the psychological $100 level, WTI crude prices fell sharply towards the $85 area. The primary driver of this rapid decline was comments made by the US President.
According to Donald Trump:
→ the United
