


Market Analysis: EUR/USD Corrects Gains While USD/CHF Signals Upside Break
FXOpen
EUR/USD started a downside correction from the 1.1070 resistance. USD/CHF is rising and might aim for more gains above the 0.8930 resistance.
Important Takeaways for EUR/USD and USD/CHF
· The Euro started a fresh decline from the 1.1070 resistance against the US Dollar.
· There is a key bullish trend line forming with support near 1.0970 on the hourly chart of EUR/USD at FXOpen.
· USD/CHF started a fresh increase above the 0.8900 resistance zone.
· There was a break above a major bearish trend line with resistance near 0.8895 on the hourly chart at FXOpen.
EUR/USD Technical Analysis
On the hourly chart of EUR/USD at FXOpen, the pair faced rejection near the 1.1070 level. The Euro started a downside correction from the 1.1072 resistance against the US Dollar.
There was a move below the 50-hour simple moving average at 1.1015. The pair dipped below the 1.1000 support before the bulls appeared near 1.0970 when the RSI reached oversold conditions. There is also a key bullish trend line forming with support near 1.0970.
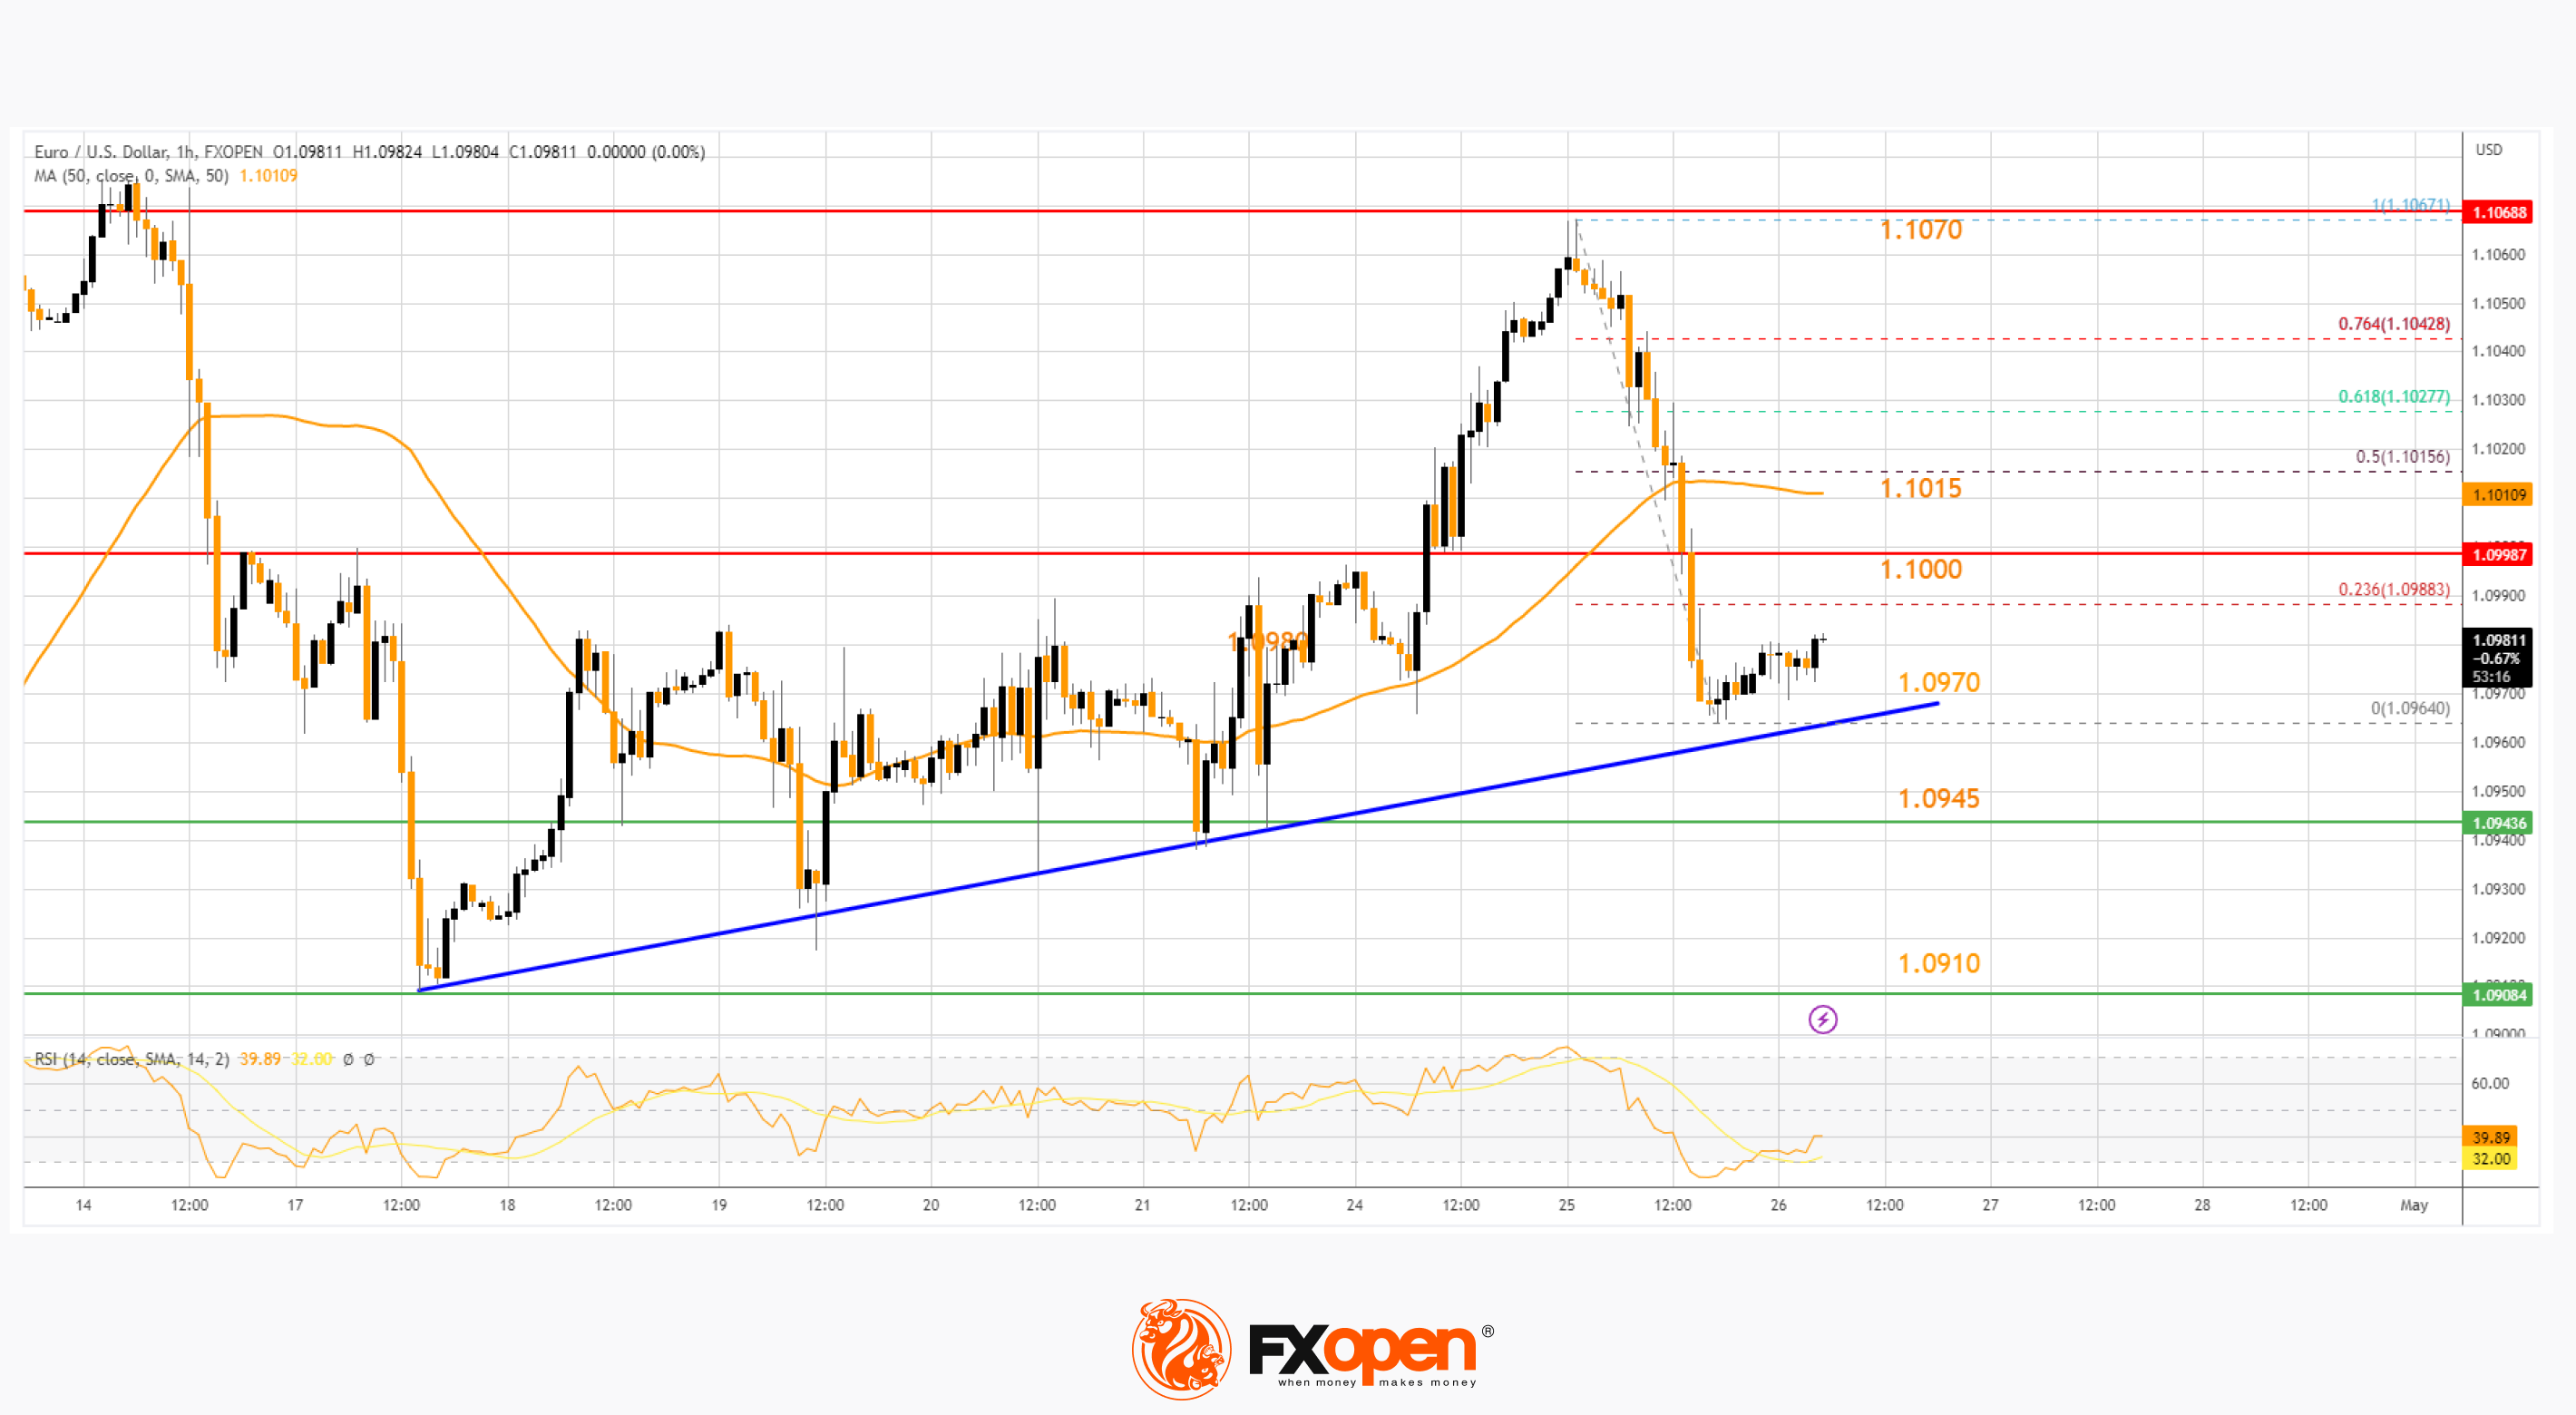
The pair is now consolidating and facing resistance near the 1.1000 level. The first major resistance is near the 50-hour simple moving average at 1.1015. It coincides with the 50% Fib retracement level of the downward move from the 1.1067 swing high to the 1.0964 low.
An upside break above the 1.1015 level might send the pair toward the 76.4% Fib retracement level of the downward move from the 1.1067 swing high to the 1.0964 low.
The next major resistance is near the 1.1070 level. Any more gains might open the doors for a move toward the 1.1120 level. If there is no move above 1.1015, the pair might start a fresh decline. On the downside, immediate support is near the trend line at 1.0970.
The next major support is near the 1.0945 level. A downside break below the 1.0945 support could start a steady decline toward the 1.0910 level.
USD/CHF Technical Analysis
On the hourly chart of USD/CHF at FXOpen, the pair declined heavily below the 0.8960 support. The US Dollar gained bearish momentum below the 0.8930 level.
Finally, it tested the 0.8860 support. The pair is now attempting a recovery wave from 0.8860. There was a break above a major bearish trend line with resistance near 0.8895, the 23.6% Fib retracement level of the downward move from the 0.9003 swing high to the 0.8860 low, and the 50-hour simple moving average.
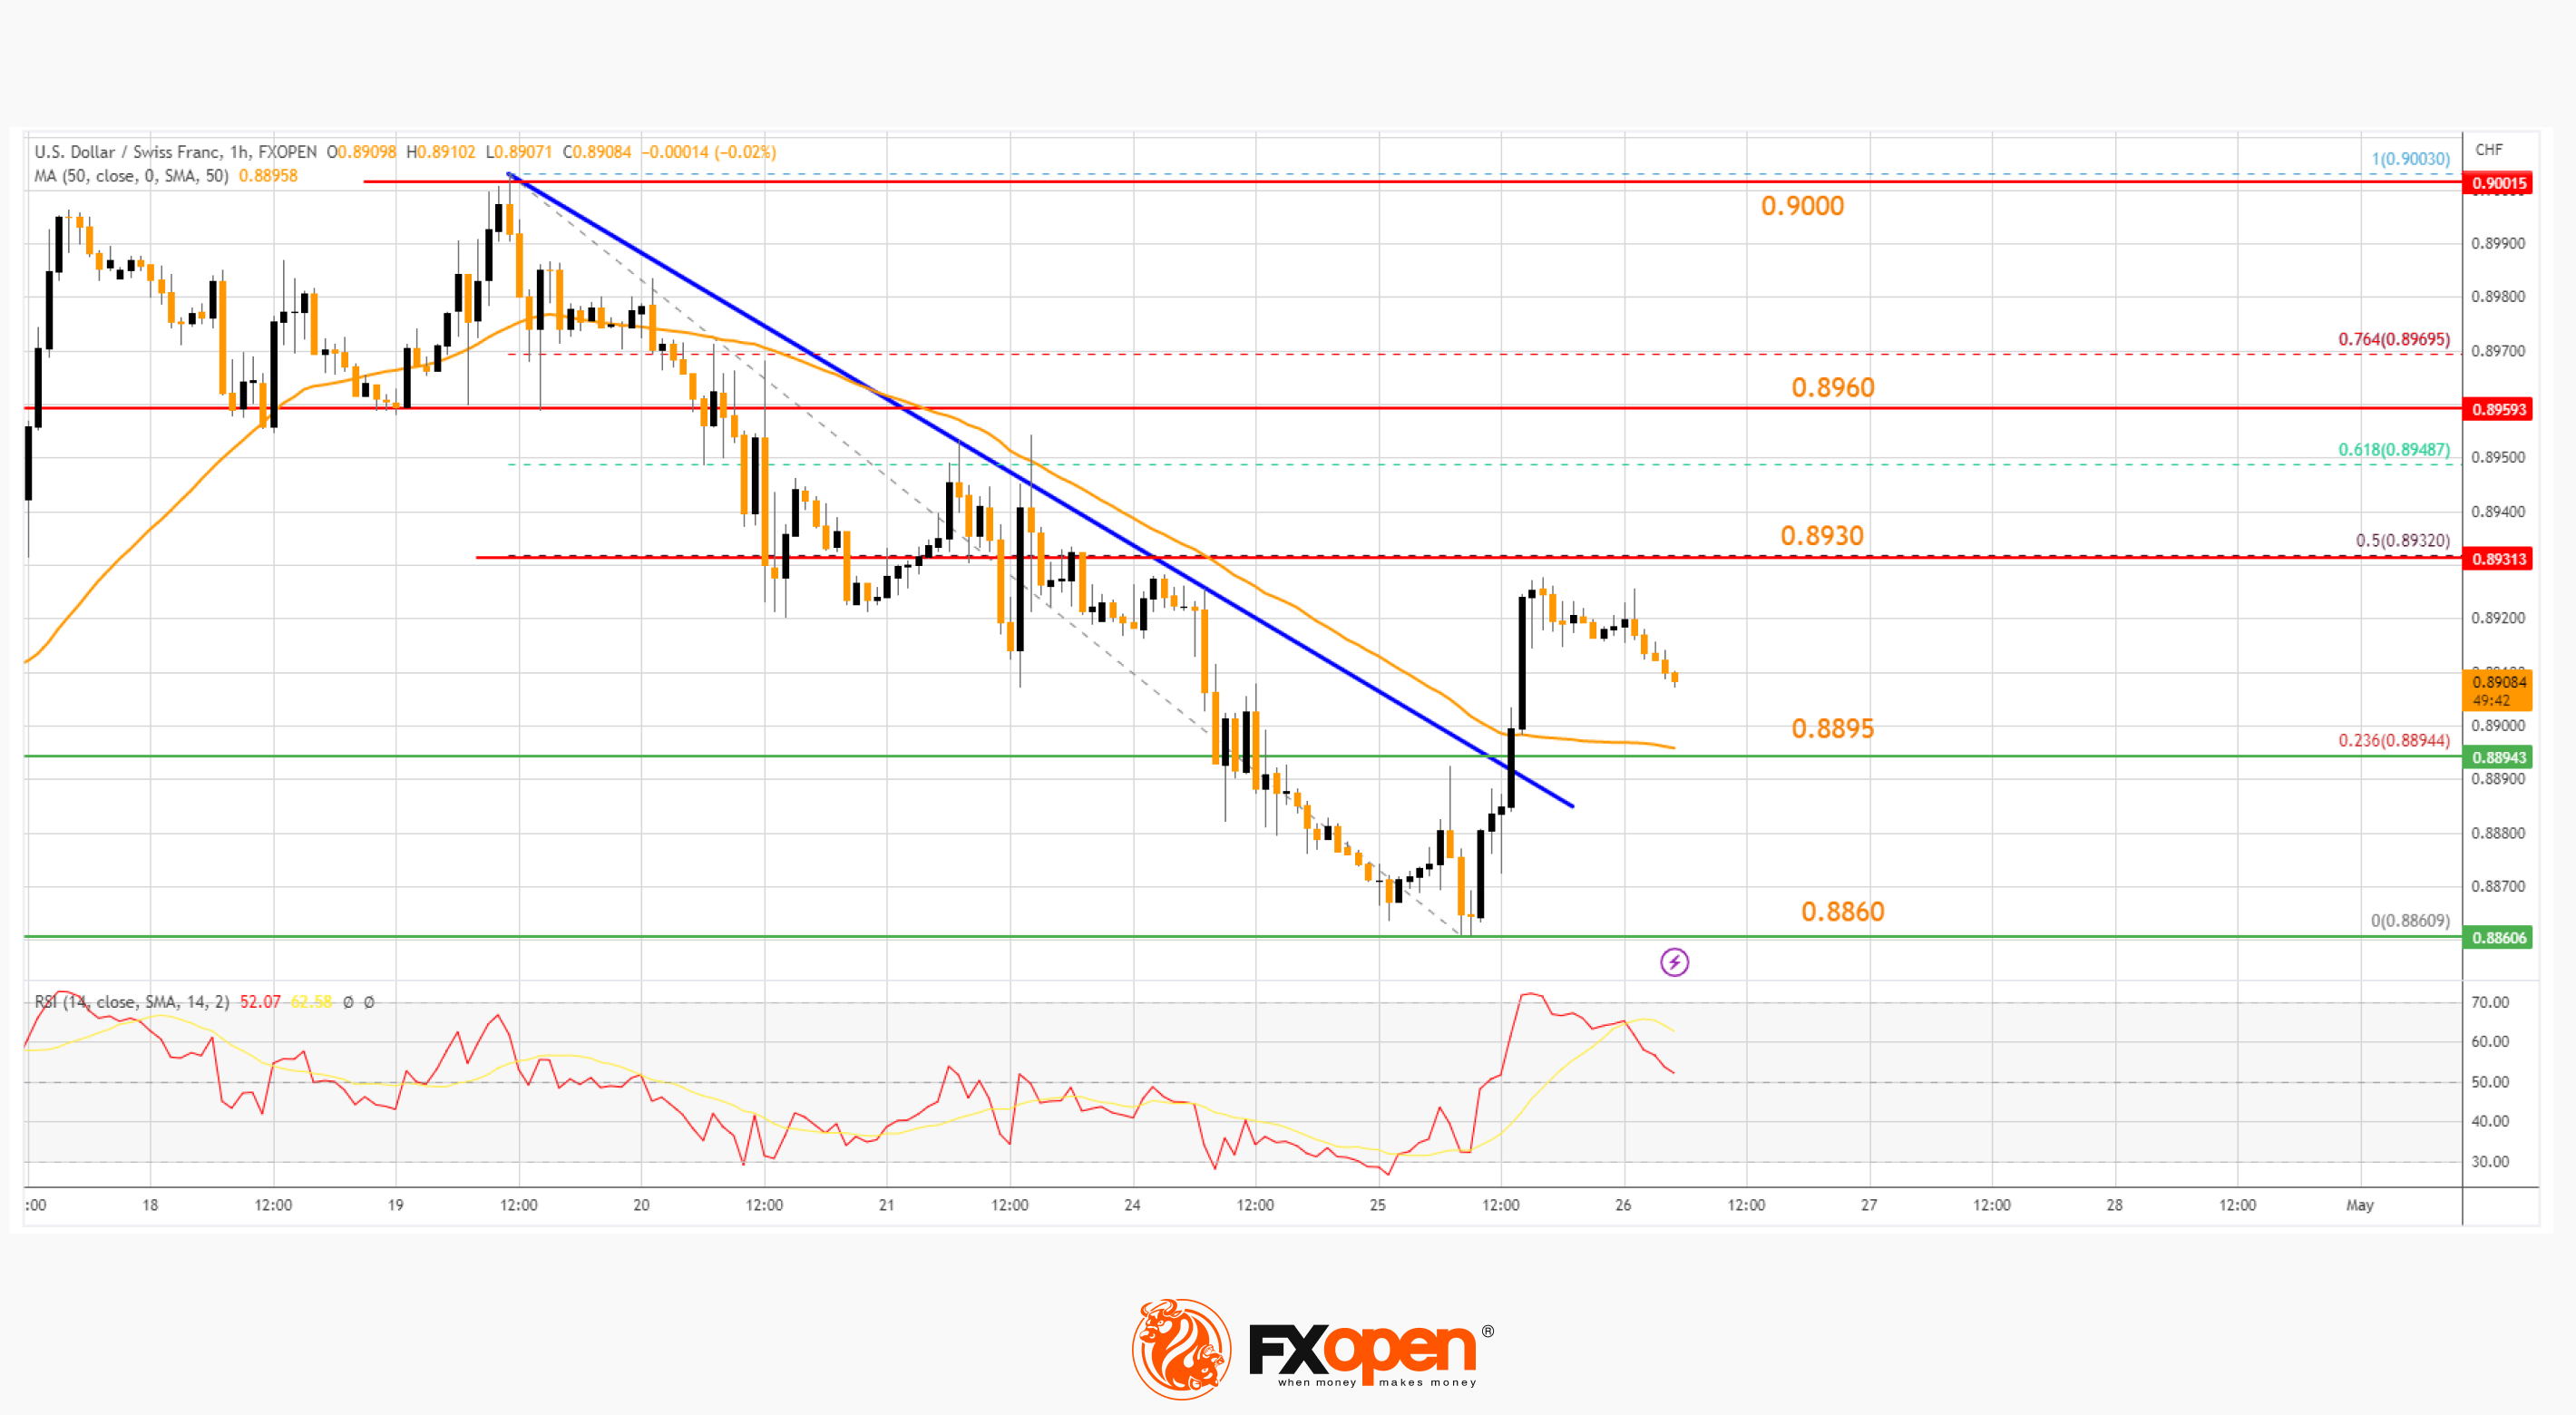
The pair is now facing resistance near the 50% Fib retracement level of the downward move from the 0.9003 swing high to the 0.8860 low at 0.8930.
The next major resistance is near the 0.8960 level. If there is a clear break above the 0.8960 resistance zone, the pair could start another increase. In the stated case, it could test 0.9000.
On the downside, immediate support is near the 50-hour simple moving average at 0.8895. The next major support is near the 0.8860 level. Any more losses may possibly open the doors for a move toward the 0.8825 level or even 0.8800 in the coming days.
This article represents FXOpen Companies’ opinion only, it should not be construed as an offer, invitation, or recommendation with respect to FXOpen Companies’ products and services or as financial advice.
Trade over 50 forex markets 24 hours a day with FXOpen. Take advantage of low commissions, deep liquidity, and spreads from 0.0 pips (additional fees may apply). Open your FXOpen account now or learn more about trading forex with FXOpen.
This article represents the opinion of the Companies operating under the FXOpen brand only. It is not to be construed as an offer, solicitation, or recommendation with respect to products and services provided by the Companies operating under the FXOpen brand, nor is it to be considered financial advice.
Stay ahead of the market!
Subscribe now to our mailing list and receive the latest market news and insights delivered directly to your inbox.


Latest articles

AUD/CAD: Months of Indecision — Is a Breakout Finally Coming?
The Australian dollar has clawed back most of its end-of-June losses, when it touched three-month lows against the greenback amid escalating Middle East tensions. Since then, sentiment has improved: the RBA's Assistant Governor Sarah Hunter signalled the board stands ready

USD/JPY: Battling at the Top of the Triangle
On 3 July, Japan's Finance Minister, Satsuki Katayama, stated that the Ministry of Finance remains in close contact with US authorities regarding developments in USD/JPY as the yen traded near its weakest level in almost 40 years. Similar verbal

Dow Jones (DJIA): Consolidation Beyond the Trend
Federal Reserve Chair Kevin Warsh testified before Congress on 14–15 July, reaffirming the Fed's commitment to bringing inflation back to target while providing no clear guidance on the future path of interest rates. Meanwhile, June inflation data came in