


Market Analysis: EUR/USD Faces Hurdles While USD/JPY Eyes Breakout
FXOpen
EUR/USD started a fresh decline below 1.0715. USD/JPY is rising and might climb further if it clears the 148.00 resistance zone.
Important Takeaways for EUR/USD and USD/JPY Analysis Today
· The Euro started a fresh decline below the 1.0715 support zone.
· There is a key bearish trend line forming with resistance near 1.0715 on the hourly chart of EUR/USD at FXOpen.
· USD/JPY climbed higher above the 147.20 and 147.50 levels.
· There is a connecting bullish trend line forming with support near 147.70 on the hourly chart at FXOpen.
EUR/USD Technical Analysis
On the hourly chart of EUR/USD at FXOpen, the pair started a fresh decline from the 1.0760 zone. The Euro declined below the 1.0715 support zone against the US Dollar.
The pair even settled below the 1.0680 zone and the 50-hour simple moving average. A low is formed near 1.0632 and the pair is now attempting a recovery wave above the 50% Fib retracement level of the downward move from the 1.0764 swing high to the 1.0632 low.
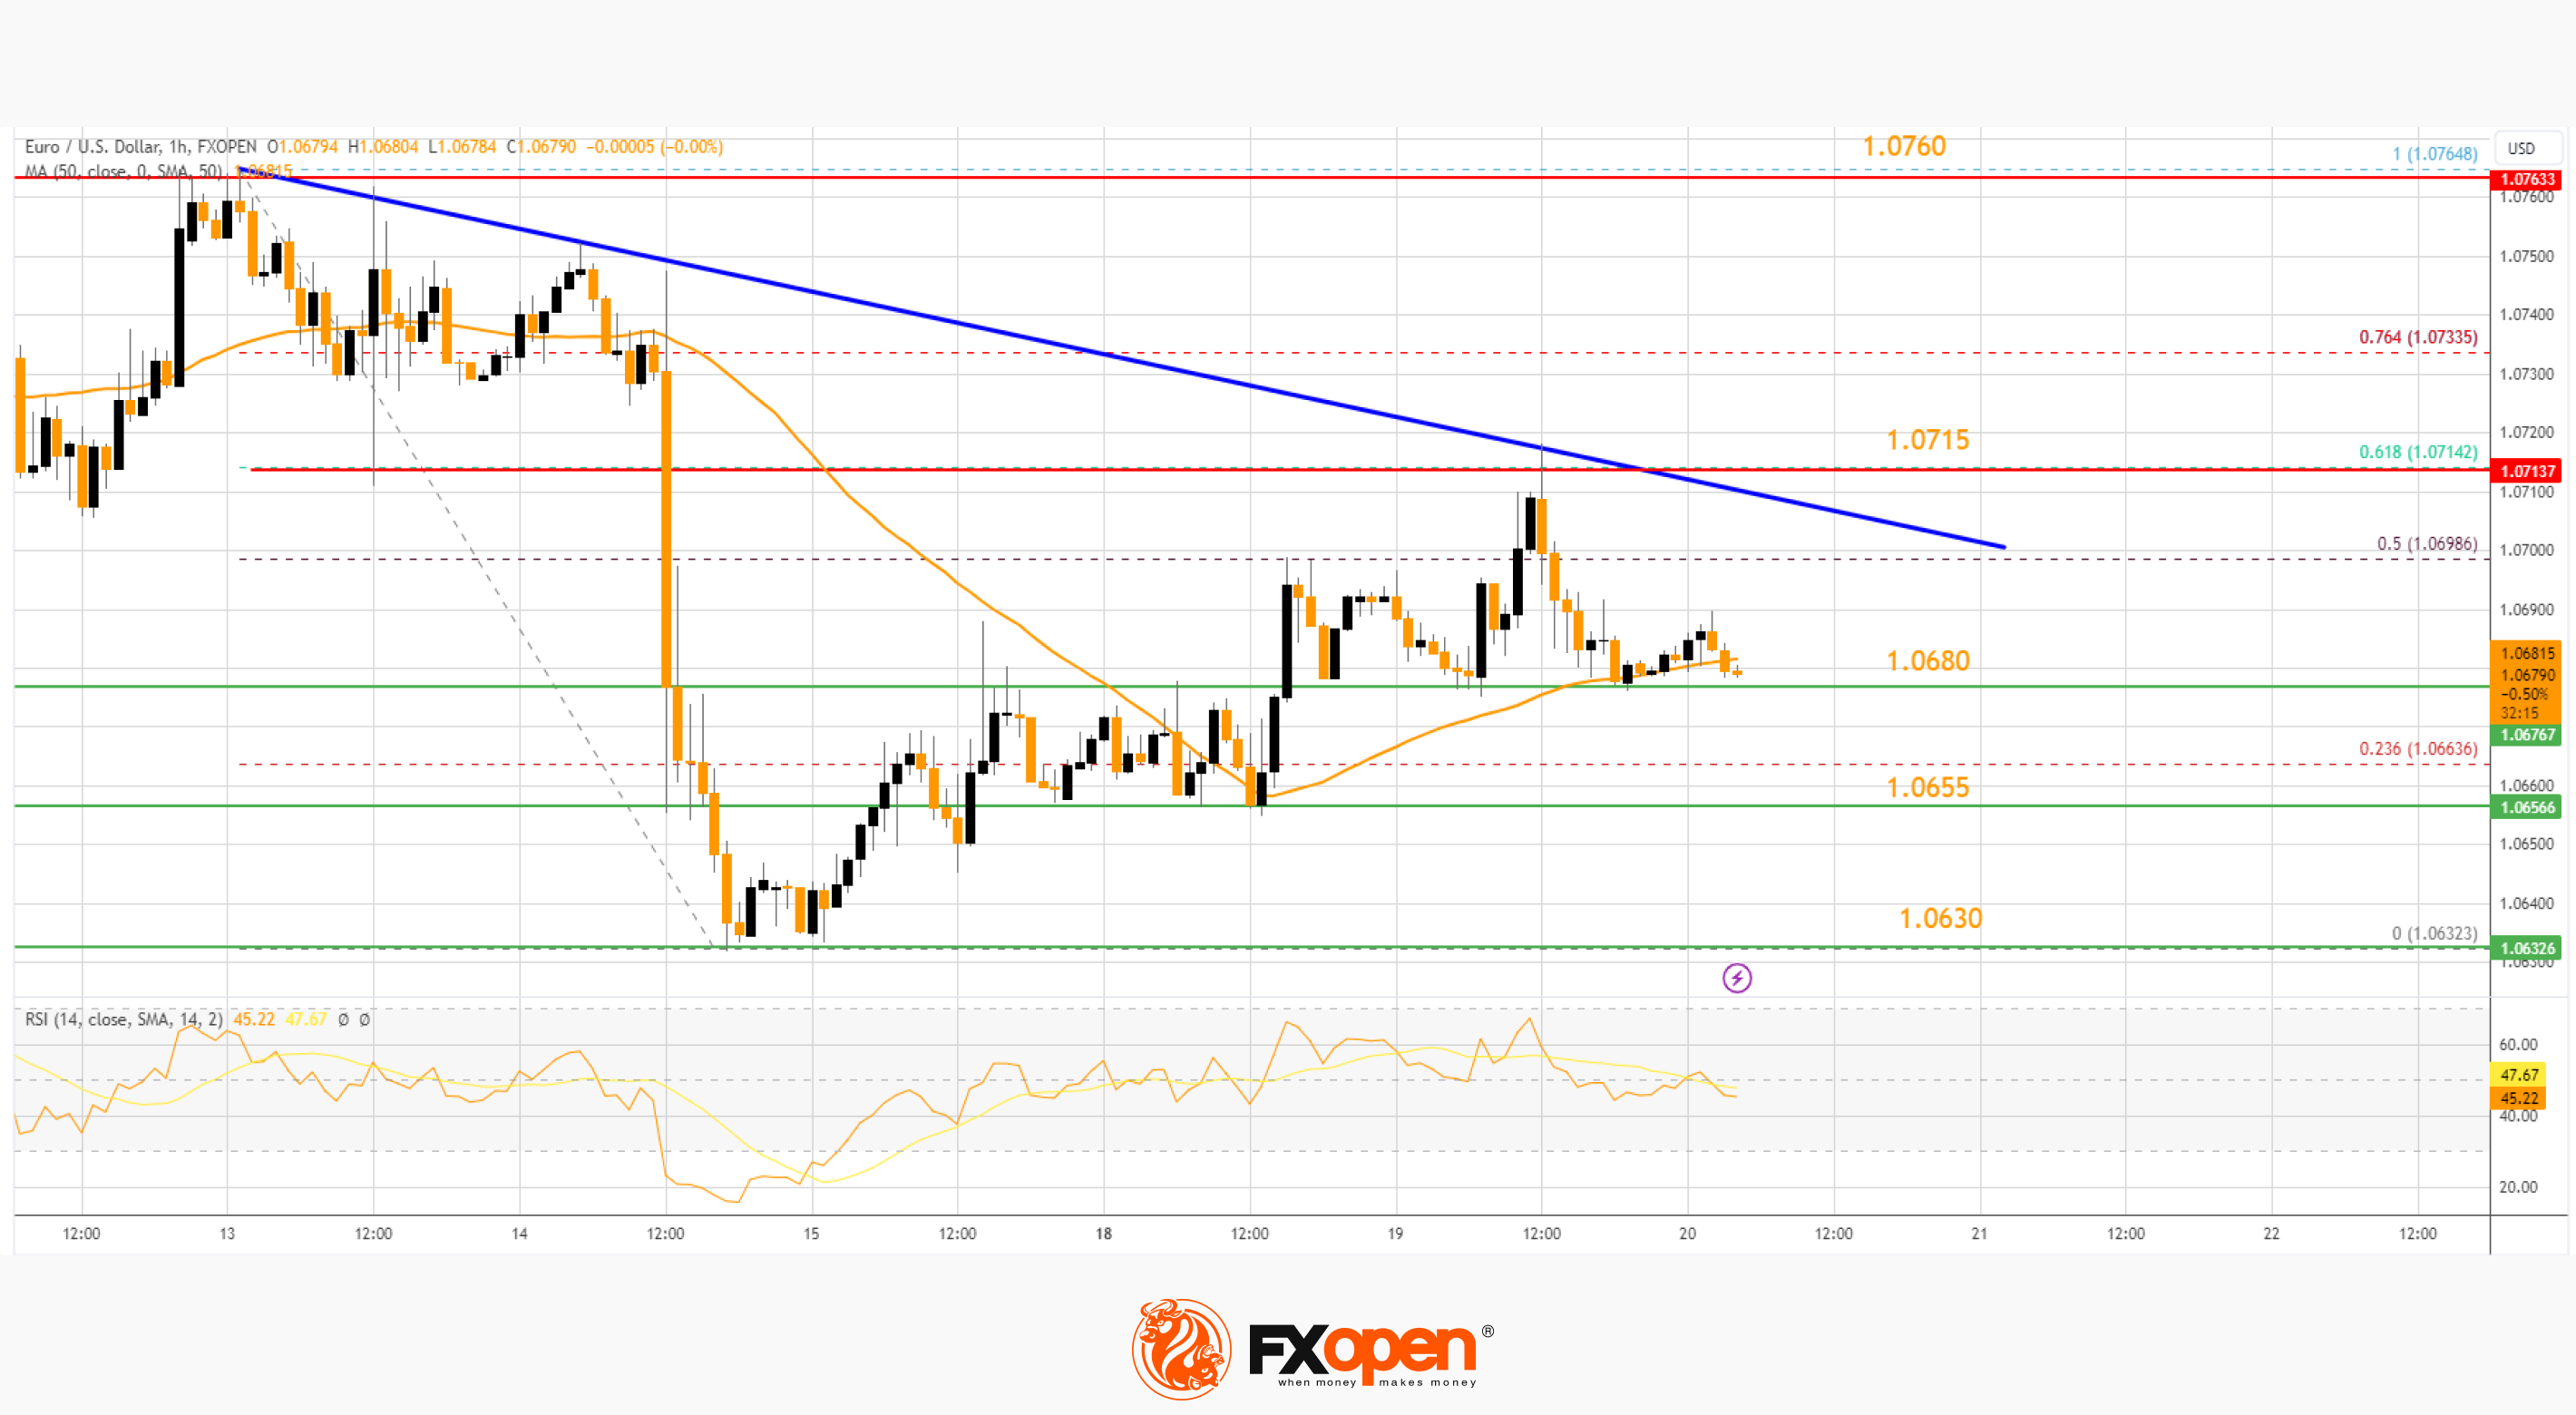
On the upside, the pair is now facing resistance near 1.0715 and a key bearish trend line. It is close to the 61.8% Fib retracement level of the downward move from the 1.0764 swing high to the 1.0632 low.
The next major resistance is near 1.0760. The main resistance is now near 1.0780. An upside break above 1.0780 could set the pace for another increase. In the stated case, the pair might rise toward 1.0840.
If not, the pair might resume its decline. The first major support on the EUR/USD chart is near 1.0680. The next key support is at 1.0655. If there is a downside break below 1.0655, the pair could drop toward 1.0630. The next support is near 1.0600, below which the pair could start a major decline.
USD/JPY Technical Analysis
On the hourly chart of USD/JPY at FXOpen, the pair started a decent increase from the 147.00 zone. The US Dollar gained bullish momentum above 147.50 against the Japanese Yen.
It settled above the 50-hour simple moving average and 147.70. A high is formed near 147.94 and the pair is now consolidating gains. On the downside, the first major support is near the trend line at 147.70 and the 50-hour simple moving average.
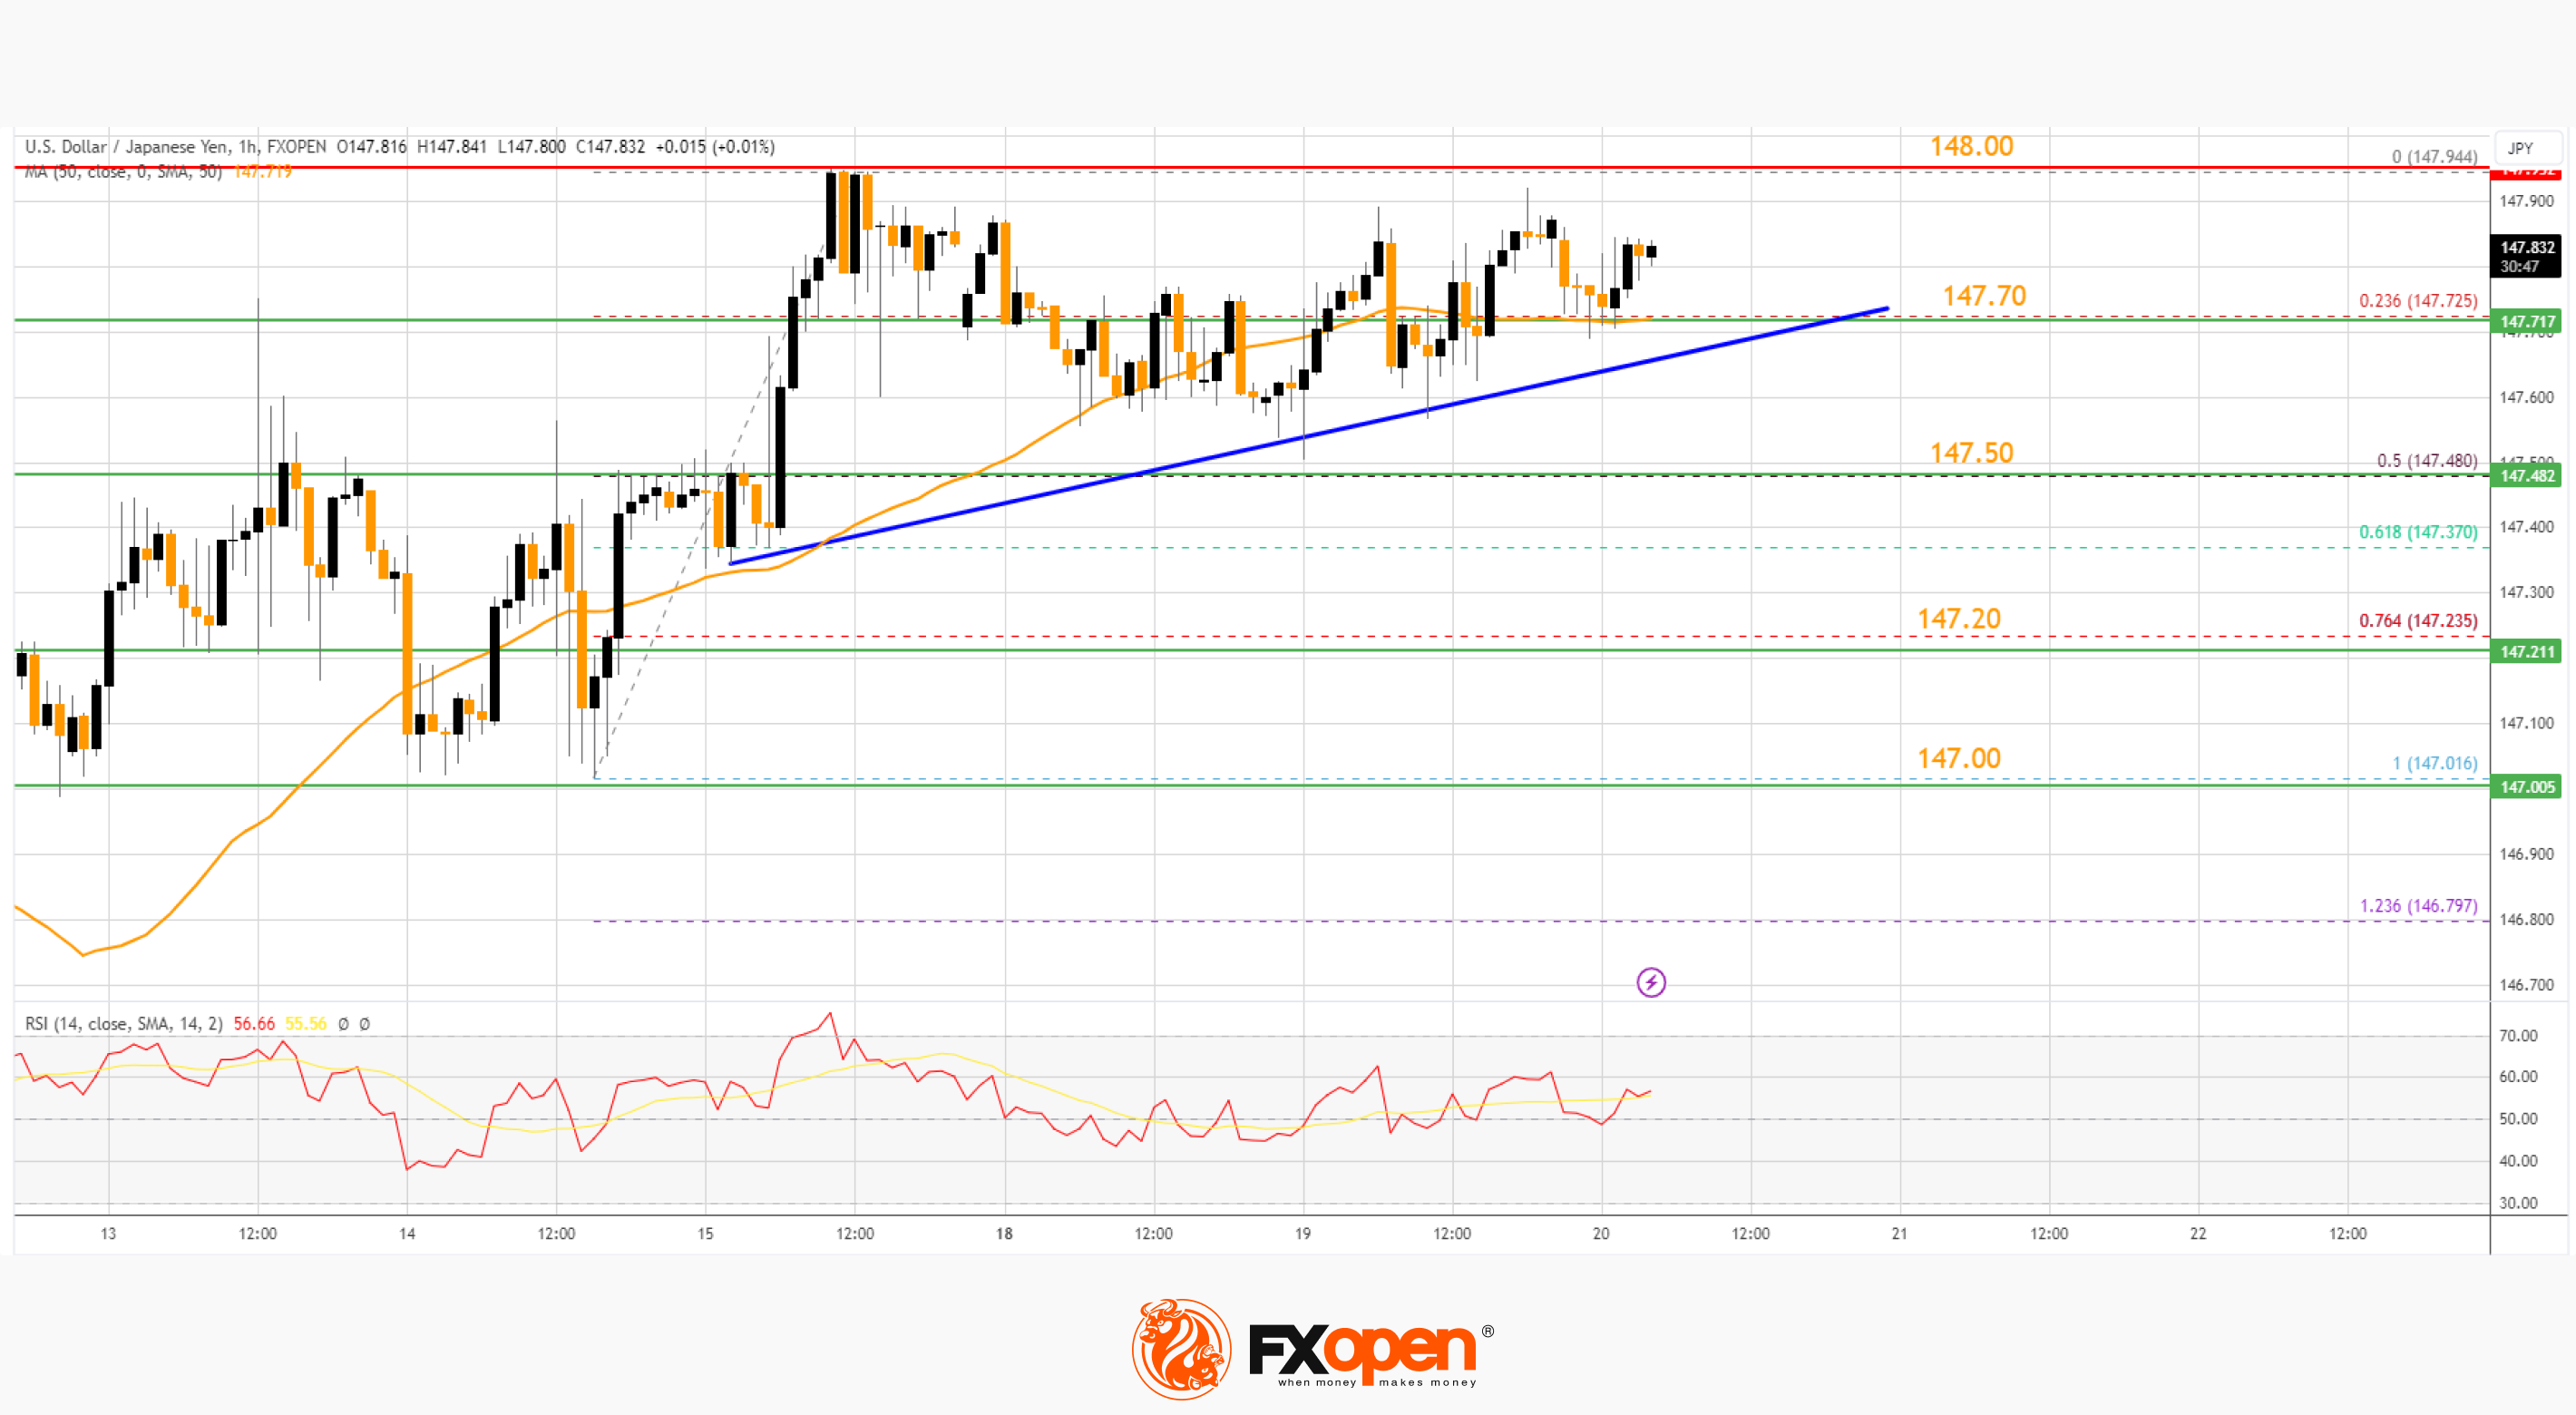
The trend line is close to the 23.6% Fib retracement level of the upward move from the 147.01 swing low to the 147.94 high. The next major support is near 147.50.
If there is a close below 147.50, the pair could decline steadily toward the 76.4% Fib retracement level of the upward move from the 147.01 swing low to the 147.94 high at 147.20. In the stated case, the pair might drop toward 147.00. The next major support sits at 146.20.
Immediate resistance on the USD/JPY chart is near 147.95. The first major resistance is near 148.00. If there is a close above the 148.00 level and the RSI moves above 60, the pair could rise toward 148.80. The next major resistance is near 149.20, above which the pair could test 150.00 in the coming days.
Trade over 50 forex markets 24 hours a day with FXOpen. Take advantage of low commissions, deep liquidity, and spreads from 0.0 pips (additional fees may apply). Open your FXOpen account now or learn more about trading forex with FXOpen.
This article represents the opinion of the Companies operating under the FXOpen brand only. It is not to be construed as an offer, solicitation, or recommendation with respect to products and services provided by the Companies operating under the FXOpen brand, nor is it to be considered financial advice.
Stay ahead of the market!
Subscribe now to our mailing list and receive the latest market news and insights delivered directly to your inbox.


Latest articles

NVIDIA: Kyber NVL144 Dispute Weighs on the Stock
NVIDIA shares found themselves at the centre of debate over the future of the Kyber NVL144 system. On 6 July, CNBC, citing research firm SemiAnalysis, reported that the project could be delayed by more than a year—from 2027 to

EUR/GBP: Trendline Support or Breakdown to New Lows?
EUR/GBP has slid to its weakest level in a year, as the two currencies continue to follow increasingly divergent paths. The ECB's June hike—its first since 2023—was meant to signal renewed hawkishness, but the very next inflation

USD/CAD: One Trendline Away From Deciding the Next Move
After several strongly positive weeks, USD/CAD has stalled over the past few sessions, entering a phase of uncertainty.
On the dollar side, Fed Chair Kevin Warsh has struck a firm tone, reaffirming the 2% inflation target and pushing back