


Market Analysis: EUR/USD Faces Rejection, USD/JPY Recovers Above 145.00
FXOpen

EUR/USD declined from the 1.1640 resistance and traded below 1.1550. USD/JPY is rising and might gain pace above the 145.50 resistance.
Important Takeaways for EUR/USD and USD/JPY Analysis Today
- The Euro started a fresh decline after a strong surge above the 1.1600 zone.
- There is a connecting bearish trend line forming with resistance at 1.1545 on the hourly chart of EUR/USD at FXOpen.
- USD/JPY climbed higher above the 144.00 and 145.00 levels.
- There is a key bullish trend line forming with support at 144.80 on the hourly chart at FXOpen.
EUR/USD Technical Analysis
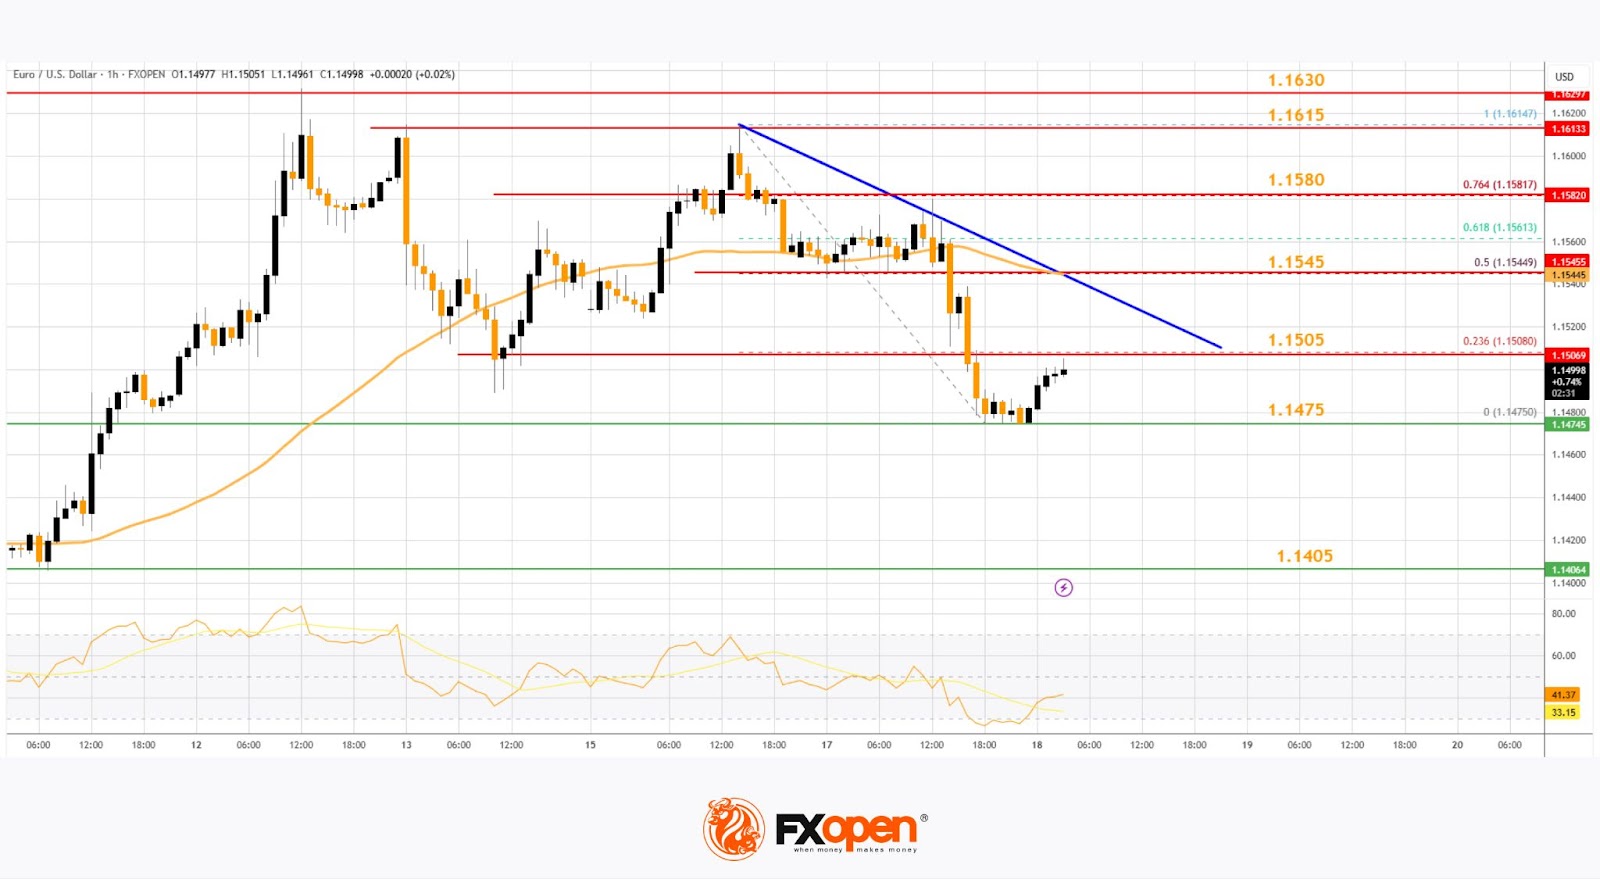
On the hourly chart of EUR/USD at FXOpen, the pair rallied above the 1.1600 resistance zone before the bears appeared, as discussed in the previous analysis. The Euro started a fresh decline and traded below the 1.1550 support zone against the US Dollar.
The pair declined below 1.1520 and tested the 1.1475 zone. A low was formed near 1.1475 and the pair started a consolidation phase. There was a minor recovery wave above the 1.1495 level.
The pair tested the 23.6% Fib retracement level of the downward move from the 1.1614 swing high to the 1.1475 low. EUR/USD is now trading below 1.1550 and the 50-hour simple moving average. On the upside, the pair is now facing resistance near the 1.1505 level.
The next key resistance is at 1.1545 and the 50% Fib retracement level of the downward move from the 1.1614 swing high to the 1.1475 low. There is also a connecting bearish trend line forming with resistance at 1.1545.
The main resistance is near the 1.1580 level. A clear move above the 1.1580 level could send the pair toward the 1.1615 resistance. An upside break above 1.1615 could set the pace for another increase. In the stated case, the pair might rise toward 1.1650.
If not, the pair might resume its decline. The first major support on the EUR/USD chart is near 1.1475. The next key support is at 1.1450. If there is a downside break below 1.1450, the pair could drop toward 1.1400. The next support is near 1.1350, below which the pair could start a major decline.
USD/JPY Technical Analysis
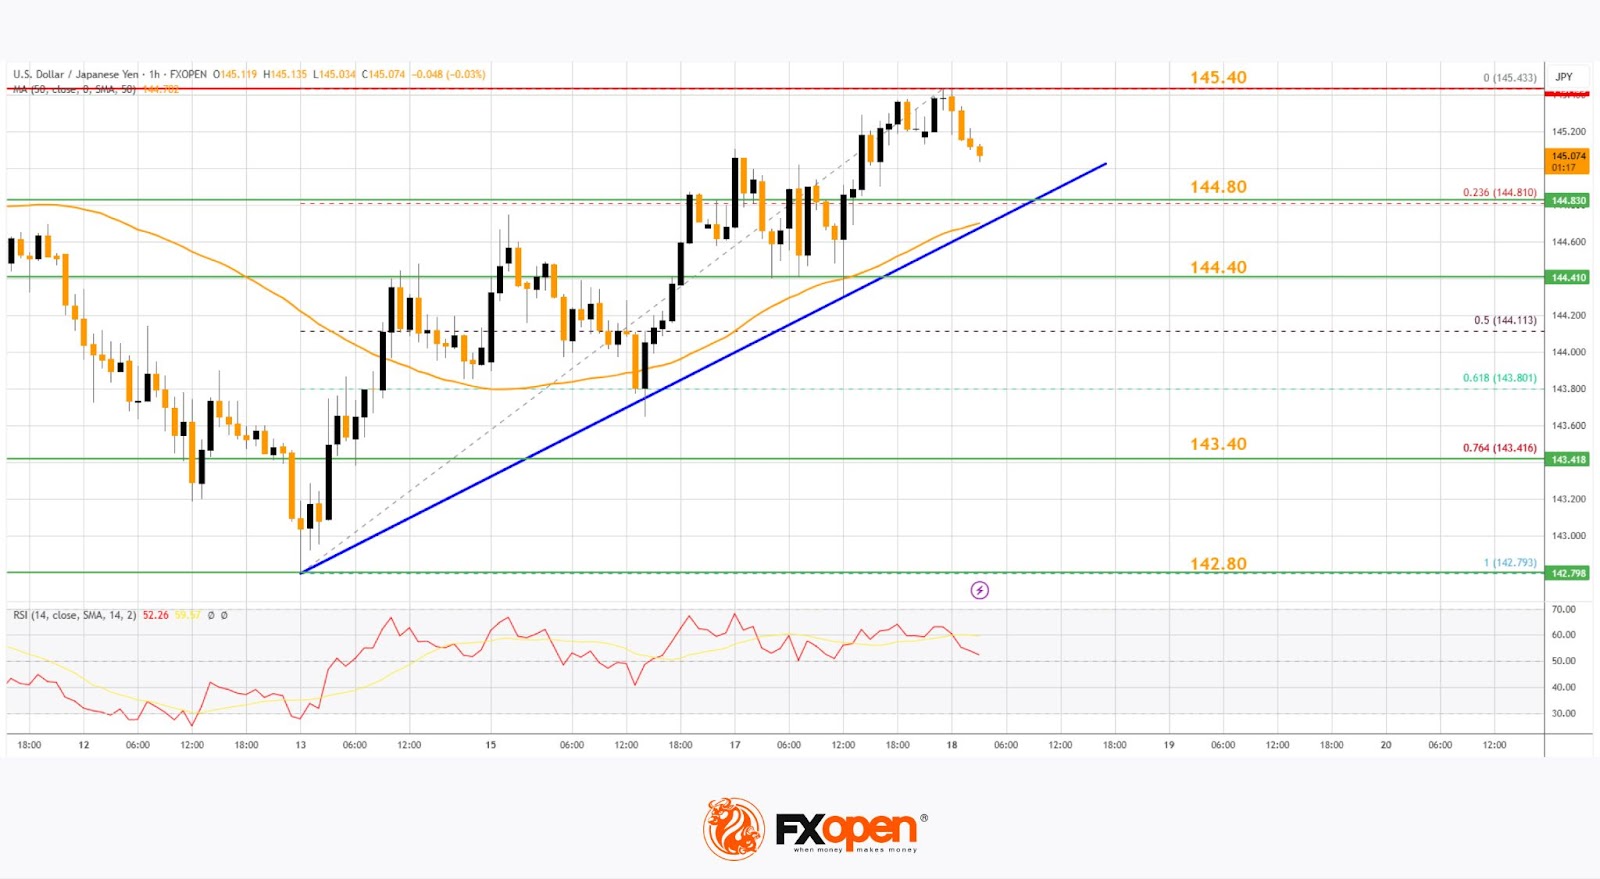
On the hourly chart of USD/JPY at FXOpen, the pair started a fresh upward move from the 142.80 zone. The US Dollar gained bullish momentum above 143.40 against the Japanese Yen.
It even cleared the 50-hour simple moving average and 144.00. The pair climbed above 145.00 and traded as high as 145.43 before there was a downside correction. It is now moving lower toward the 23.6% Fib retracement level of the upward move from the 142.79 swing low to the 145.40 high.
The current price action above the 144.50 level is positive. There is also a key bullish trend line forming with support at 144.80. Immediate resistance on the USD/JPY chart is near 145.40.
The first major resistance is near 146.20. If there is a close above the 146.20 level and the RSI moves above 60, the pair could rise toward 147.50. The next major resistance is near 148.00, above which the pair could test 148.80 in the coming days.
On the downside, the first major support is 144.80 and the trend line. The next major support is visible near the 144.40 level. If there is a close below 144.40, the pair could decline steadily.
In the stated case, the pair might drop toward the 143.40 support zone and the 76.4% Fib retracement level of the upward move from the 142.79 swing low to the 145.40 high. The next stop for the bears may perhaps be near the 142.80 region.
Trade over 50 forex markets 24 hours a day with FXOpen. Take advantage of low commissions, deep liquidity, and spreads from 0.0 pips (additional fees may apply). Open your FXOpen account now or learn more about trading forex with FXOpen.
This article represents the opinion of the Companies operating under the FXOpen brand only. It is not to be construed as an offer, solicitation, or recommendation with respect to products and services provided by the Companies operating under the FXOpen brand, nor is it to be considered financial advice.
Stay ahead of the market!
Subscribe now to our mailing list and receive the latest market news and insights delivered directly to your inbox.


Latest articles

Intel at a Crossroads: Earnings Beat Meets Technical Resistance
Intel has just delivered its strongest quarter in over fifteen years, and the market reaction says it all. Q2 2026 revenue surged 25% year-over-year to $16.1 billion, crushing the consensus estimate of $14.42 billion, while adjusted EPS of

Tesla: Complex Range Structure Breaks Down Following Quarterly Earnings
Tesla released its Q2 2026 results after the market closed on 22 July. Revenue increased 26% year-on-year to $28.24 billion, while vehicle deliveries reached a record 480,126 units. However, operating margin fell sharply to 1.4%, down from

Pound Weakens After Soft UK Inflation Data as Euro Awaits Fresh Market Signals
The pound remains under pressure following the release of weaker-than-expected UK inflation data. The slowdown in inflation has strengthened expectations that the Bank of England could adopt a more accommodative policy stance in the coming months, weighing on sterling. Meanwhile,