


Market Analysis: EUR/USD Rallies While USD/JPY Shows Weakness
FXOpen

EUR/USD started a decent upward move above 1.1770. USD/JPY declined below 147.00 and is currently consolidating losses.
Important Takeaways for EUR/USD and USD/JPY Analysis Today
- The Euro found support and started a recovery wave above the 1.1770 resistance zone.
- There is a connecting bullish trend line forming with support at 1.1825 on the hourly chart of EUR/USD at FXOpen.
- USD/JPY is trading in a bearish zone below 147.00.
- There is a short-term bearish trend line forming with resistance at 146.65 on the hourly chart at FXOpen.
EUR/USD Technical Analysis
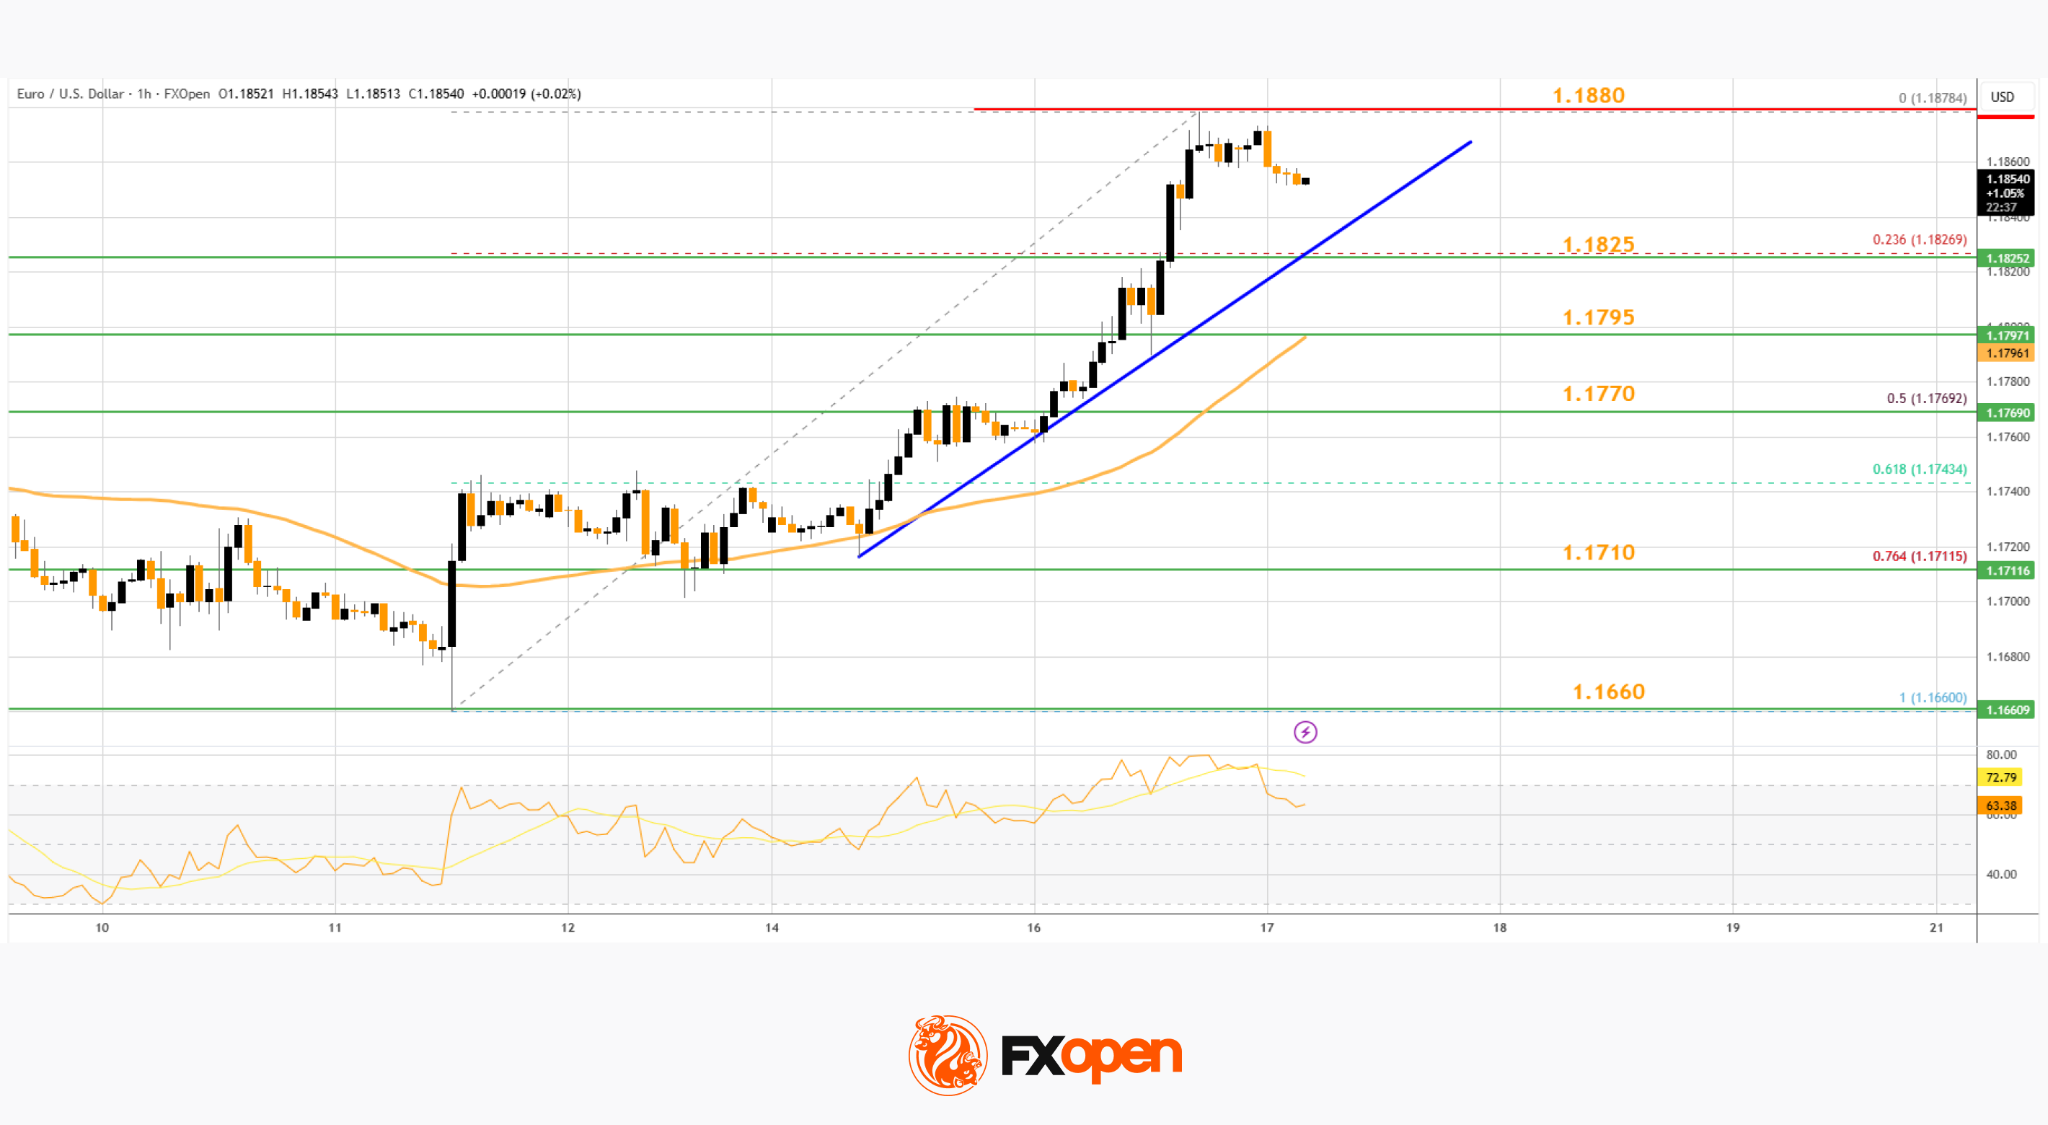
On the hourly chart of EUR/USD at FXOpen, the pair started a fresh increase from 1.1660. The pair even settled above 1.1800 and the 50-hour simple moving average. Finally, it tested the 1.1880 resistance. A high is formed near 1.1878 and the pair is now consolidating gains above the 23.6% Fib retracement level of the upward move from the 1.1660 swing low to the 1.1878 high.
Immediate support is near a connecting bullish trend at 1.1825. The next area of interest could be 1.1795 and the 50-hour simple moving average.
The main breakdown zone on the EUR/USD chart sits near the 50% Fib retracement at 1.1770. If there is a downside break below 1.1770, the pair could drop toward 1.1710. Any more losses might send the pair toward the 1.1660 low.
On the upside, the pair is now facing resistance near 1.1880. The next hurdle is 1.1920. An upside break above 1.1920 could set the pace for another increase. In the stated case, the pair might rise toward 1.1965.
USD/JPY Technical Analysis
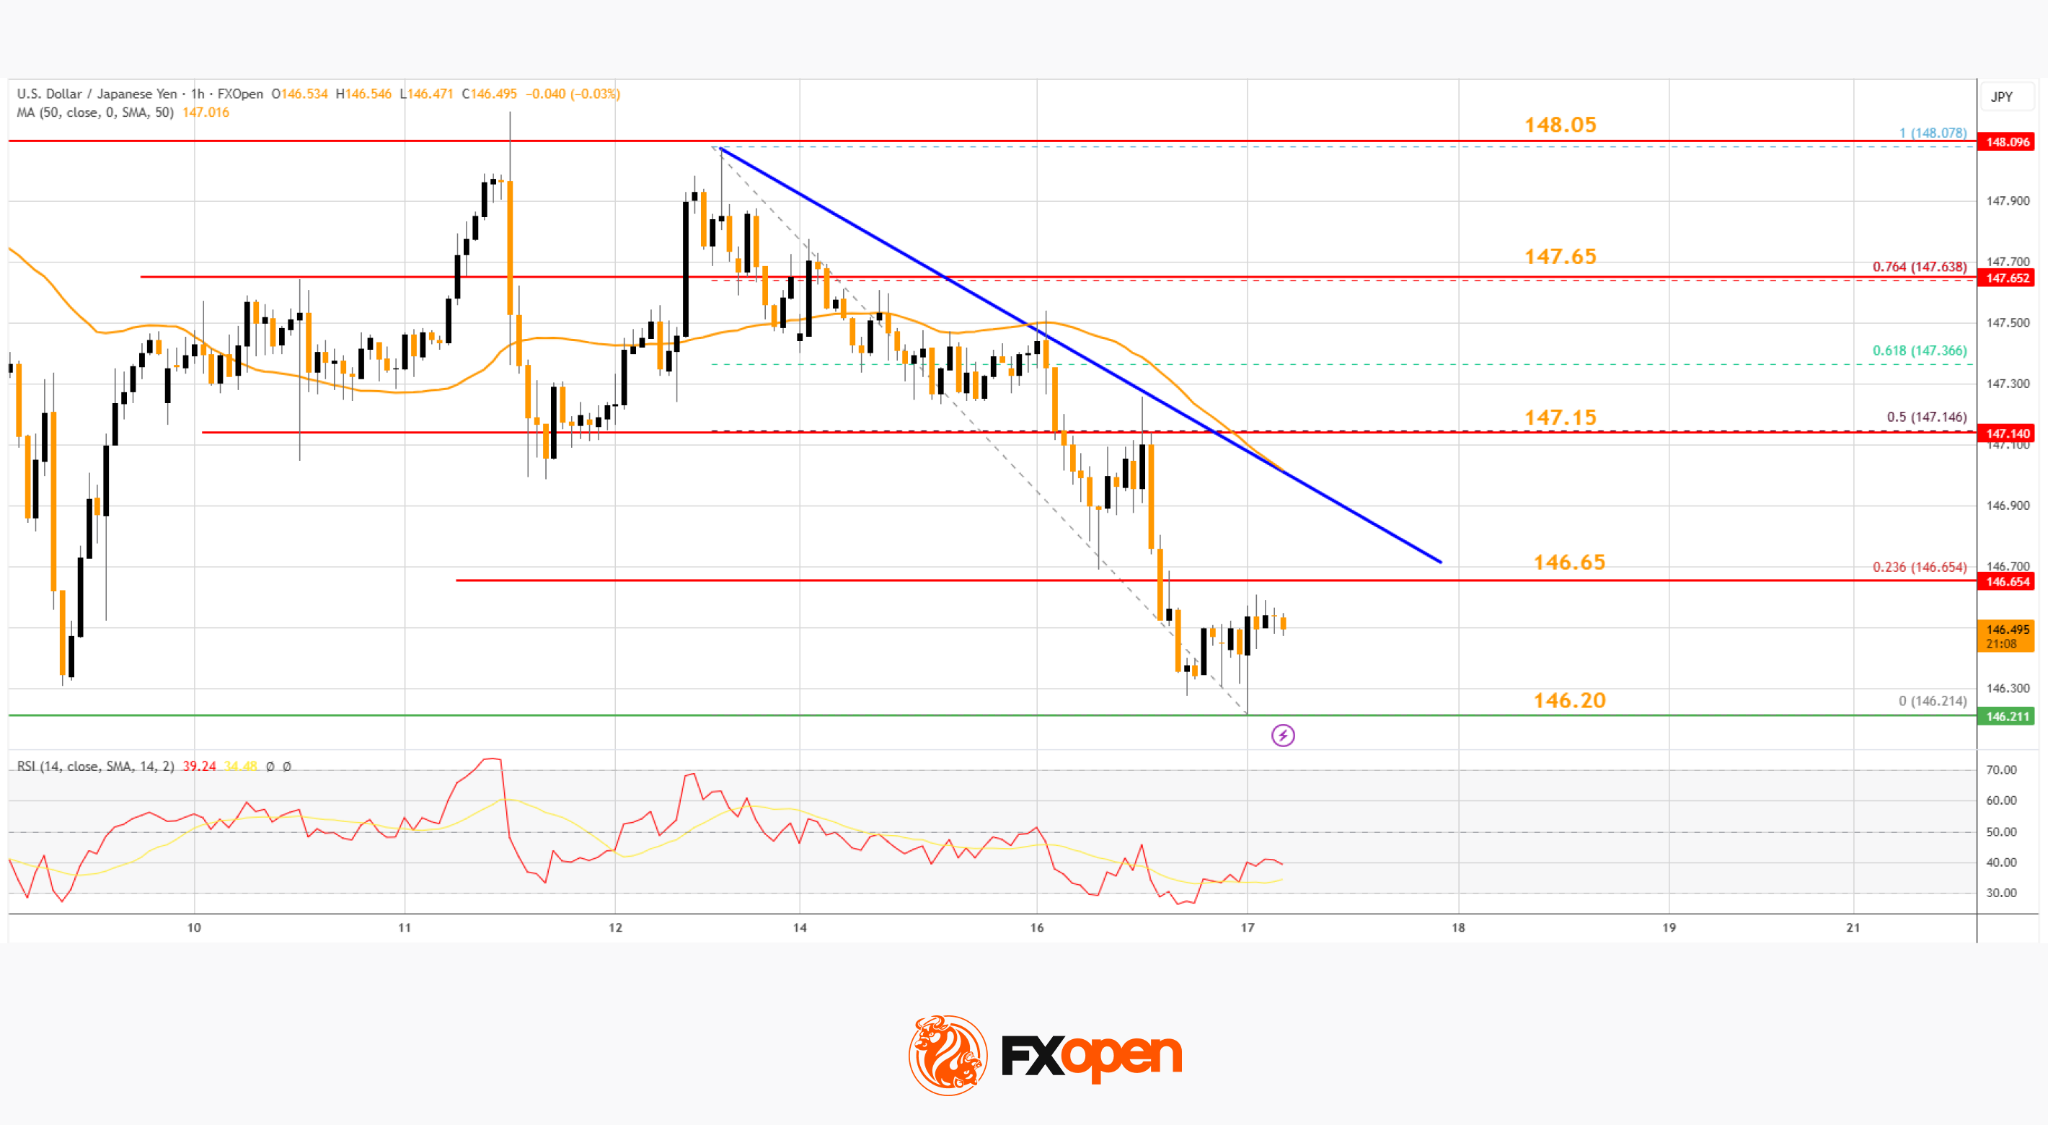
On the hourly chart of USD/JPY at FXOpen, the pair started a steady decline from 148.00. The US Dollar gained bearish momentum below 147.50 against the Japanese Yen.
The pair even settled below 147.20 and the 50-hour simple moving average. There was a spike below 146.25 and the pair traded as low as 146.21. It is now consolidating losses with a bearish angle. Immediate resistance on the USD/JPY chart is near the 23.6% Fib retracement level of the recent decline from the 148.07 swing high to the 146.21 low at 146.65.
There is also a short-term bearish trend line forming at 146.65. The next resistance for the bulls could be near the 50% Fib retracement at 147.15.
If there is a close above the 147.15 level and the hourly RSI moves above 50, the pair could rise toward 147.65. The next key area of interest is near 148.05, above which the pair could test 148.50 in the coming days.
On the downside, the first major support is near 146.20. The next key zone is near 145.80. If there is a close below 145.80, the pair could decline steadily. In the stated case, the pair might drop toward 145.00.
Trade over 50 forex markets 24 hours a day with FXOpen. Take advantage of low commissions, deep liquidity, and spreads from 0.0 pips (additional fees may apply). Open your FXOpen account now or learn more about trading forex with FXOpen.
This article represents the opinion of the Companies operating under the FXOpen brand only. It is not to be construed as an offer, solicitation, or recommendation with respect to products and services provided by the Companies operating under the FXOpen brand, nor is it to be considered financial advice.
Stay ahead of the market!
Subscribe now to our mailing list and receive the latest market news and insights delivered directly to your inbox.


Latest articles

Ripple: Letter to Congress Stirs the Crypto Market
At the beginning of June, more than 200 crypto companies and industry groups — including Coinbase, Andreessen Horowitz and Ripple Labs — sent a letter to Senate Majority and Minority Leaders John Thune and Chuck Schumer, urging them to bring the Digital

GBP/JPY: Ascending Triangle Under Pressure
The GBP/JPY pair has come under pressure after the Bank of Japan raised its policy rate to 1.0% on 16 June. The Bank of England is following the opposite path: at its 30 April meeting, the Monetary Policy

Pound Under Pressure: Markets Await Bank of England And SNB Decisions
The British pound remains under pressure following weaker-than-expected inflation data, which has reinforced expectations of further monetary easing by the Bank of England. Investors are staying cautious ahead of today’s policy meetings of both the UK central bank and