


FXOpen

EUR/USD is climbing higher above 1.1520 and 1.1540. USD/JPY managed to reclaim 154.00 and might aim for more gains.
Important Takeaways for EUR/USD and USD/JPY Analysis Today
· The Euro started a decent increase above the 1.1520 pivot level.
· There is a key bullish trend line forming with support near 1.1570 on the hourly chart of EUR/USD at FXOpen.
· USD/JPY climbed higher above 153.50 and 154.00.
· There is a bullish trend line forming with support near 154.10 on the hourly chart at FXOpen.
EUR/USD Technical Analysis
On the hourly chart of EUR/USD at FXOpen, the pair started a fresh increase from 1.1500. The Euro cleared a few key hurdles near 1.1520 to move into a positive zone against the US Dollar.
The pair settled above 1.1550 and the 50-hour simple moving average. A high was formed at 1.1605 and the pair is now consolidating gains. There was a test of the 23.6% Fib retracement level of the upward move from the 1.1468 swing low to the 1.1605 high.
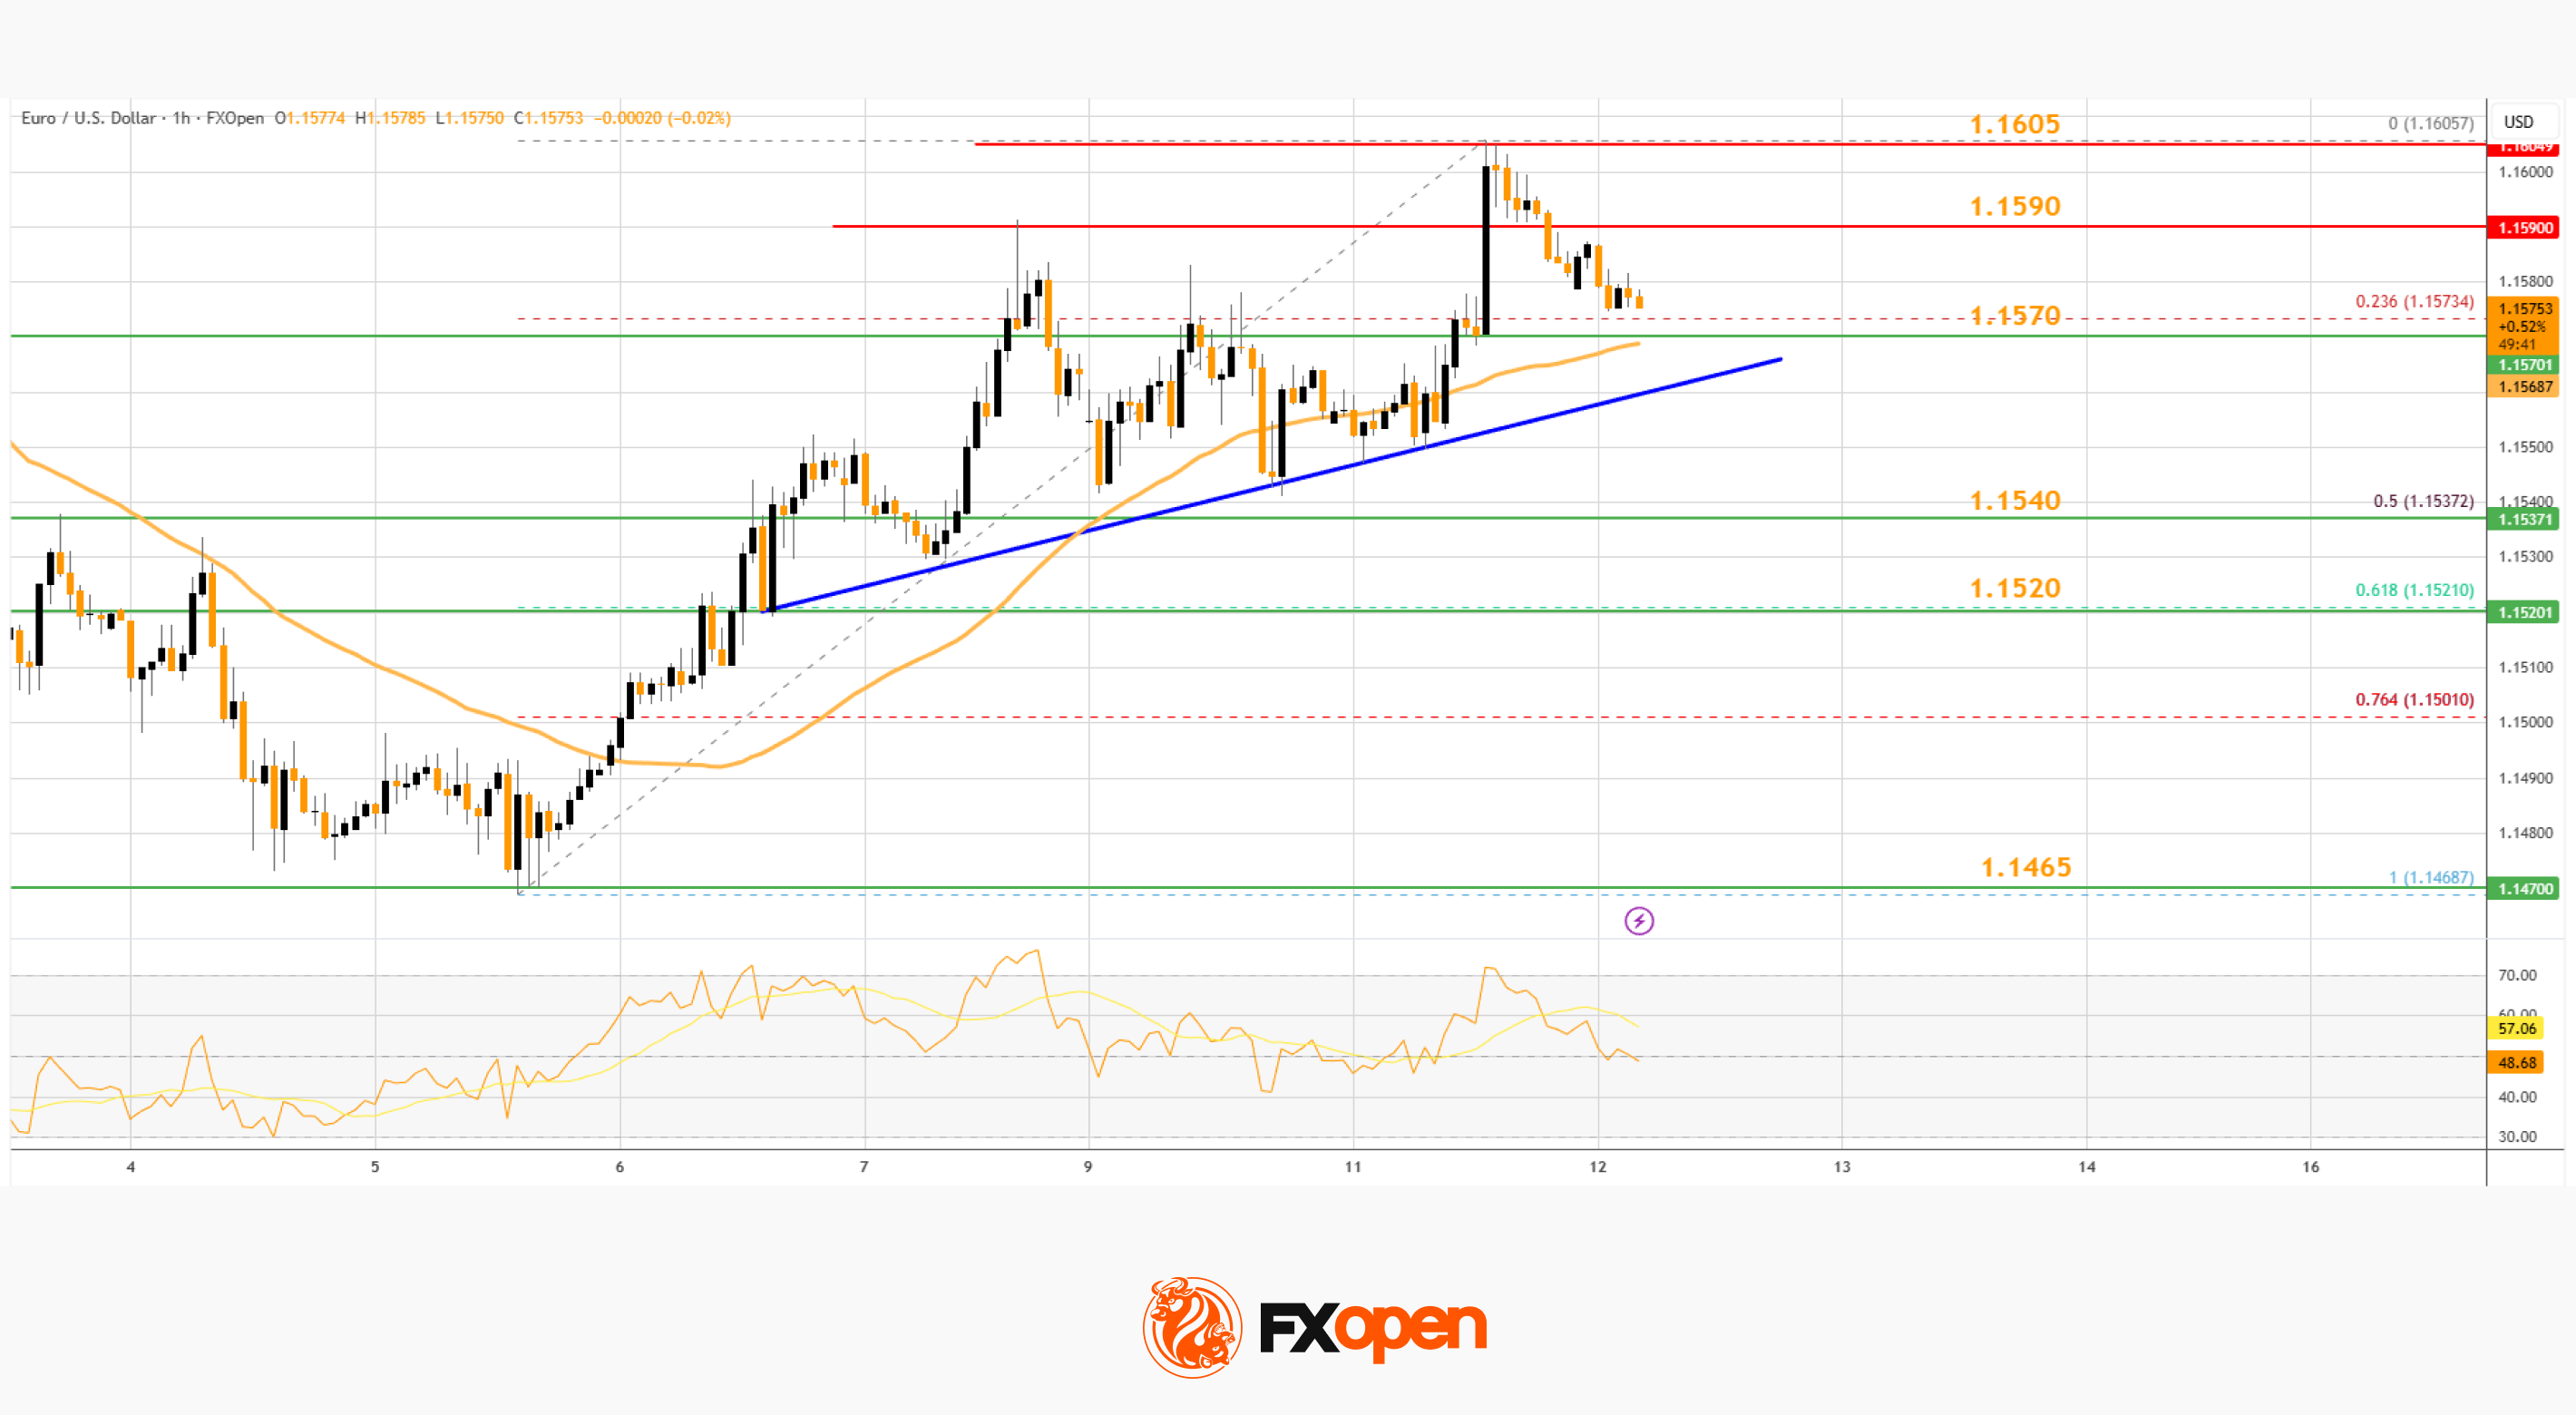
However, the bulls are active above 1.1550. Immediate support is near a key bullish trend line at 1.1570 and the 50-hour simple moving average. The first major key area of interest on the EUR/USD chart is near the 50% Fib retracement at 1.1540.
If there is a downside break below 1.1540, the pair could drop toward 1.1520. The next key breakdown area sits at 1.1465, below which the pair could start a major decline.
On the upside, the pair is now facing resistance near the 1.1590 zone. The next breakout region sits at 1.1605. An upside break above 1.1605 could set the pace for another increase. In the stated case, the pair might rise toward 1.1680.
USD/JPY Technical Analysis
On the hourly chart of USD/JPY at FXOpen, the pair started a decent increase from 152.80. The US Dollar gained bullish momentum above 153.20 against the Japanese Yen.
It settled above the 50-hour simple moving average and 154.00. The upward move was such that the pair even tested 154.50. A high was formed at 154.49 and the pair is now consolidating gains. There was a minor pullback below 154.00.
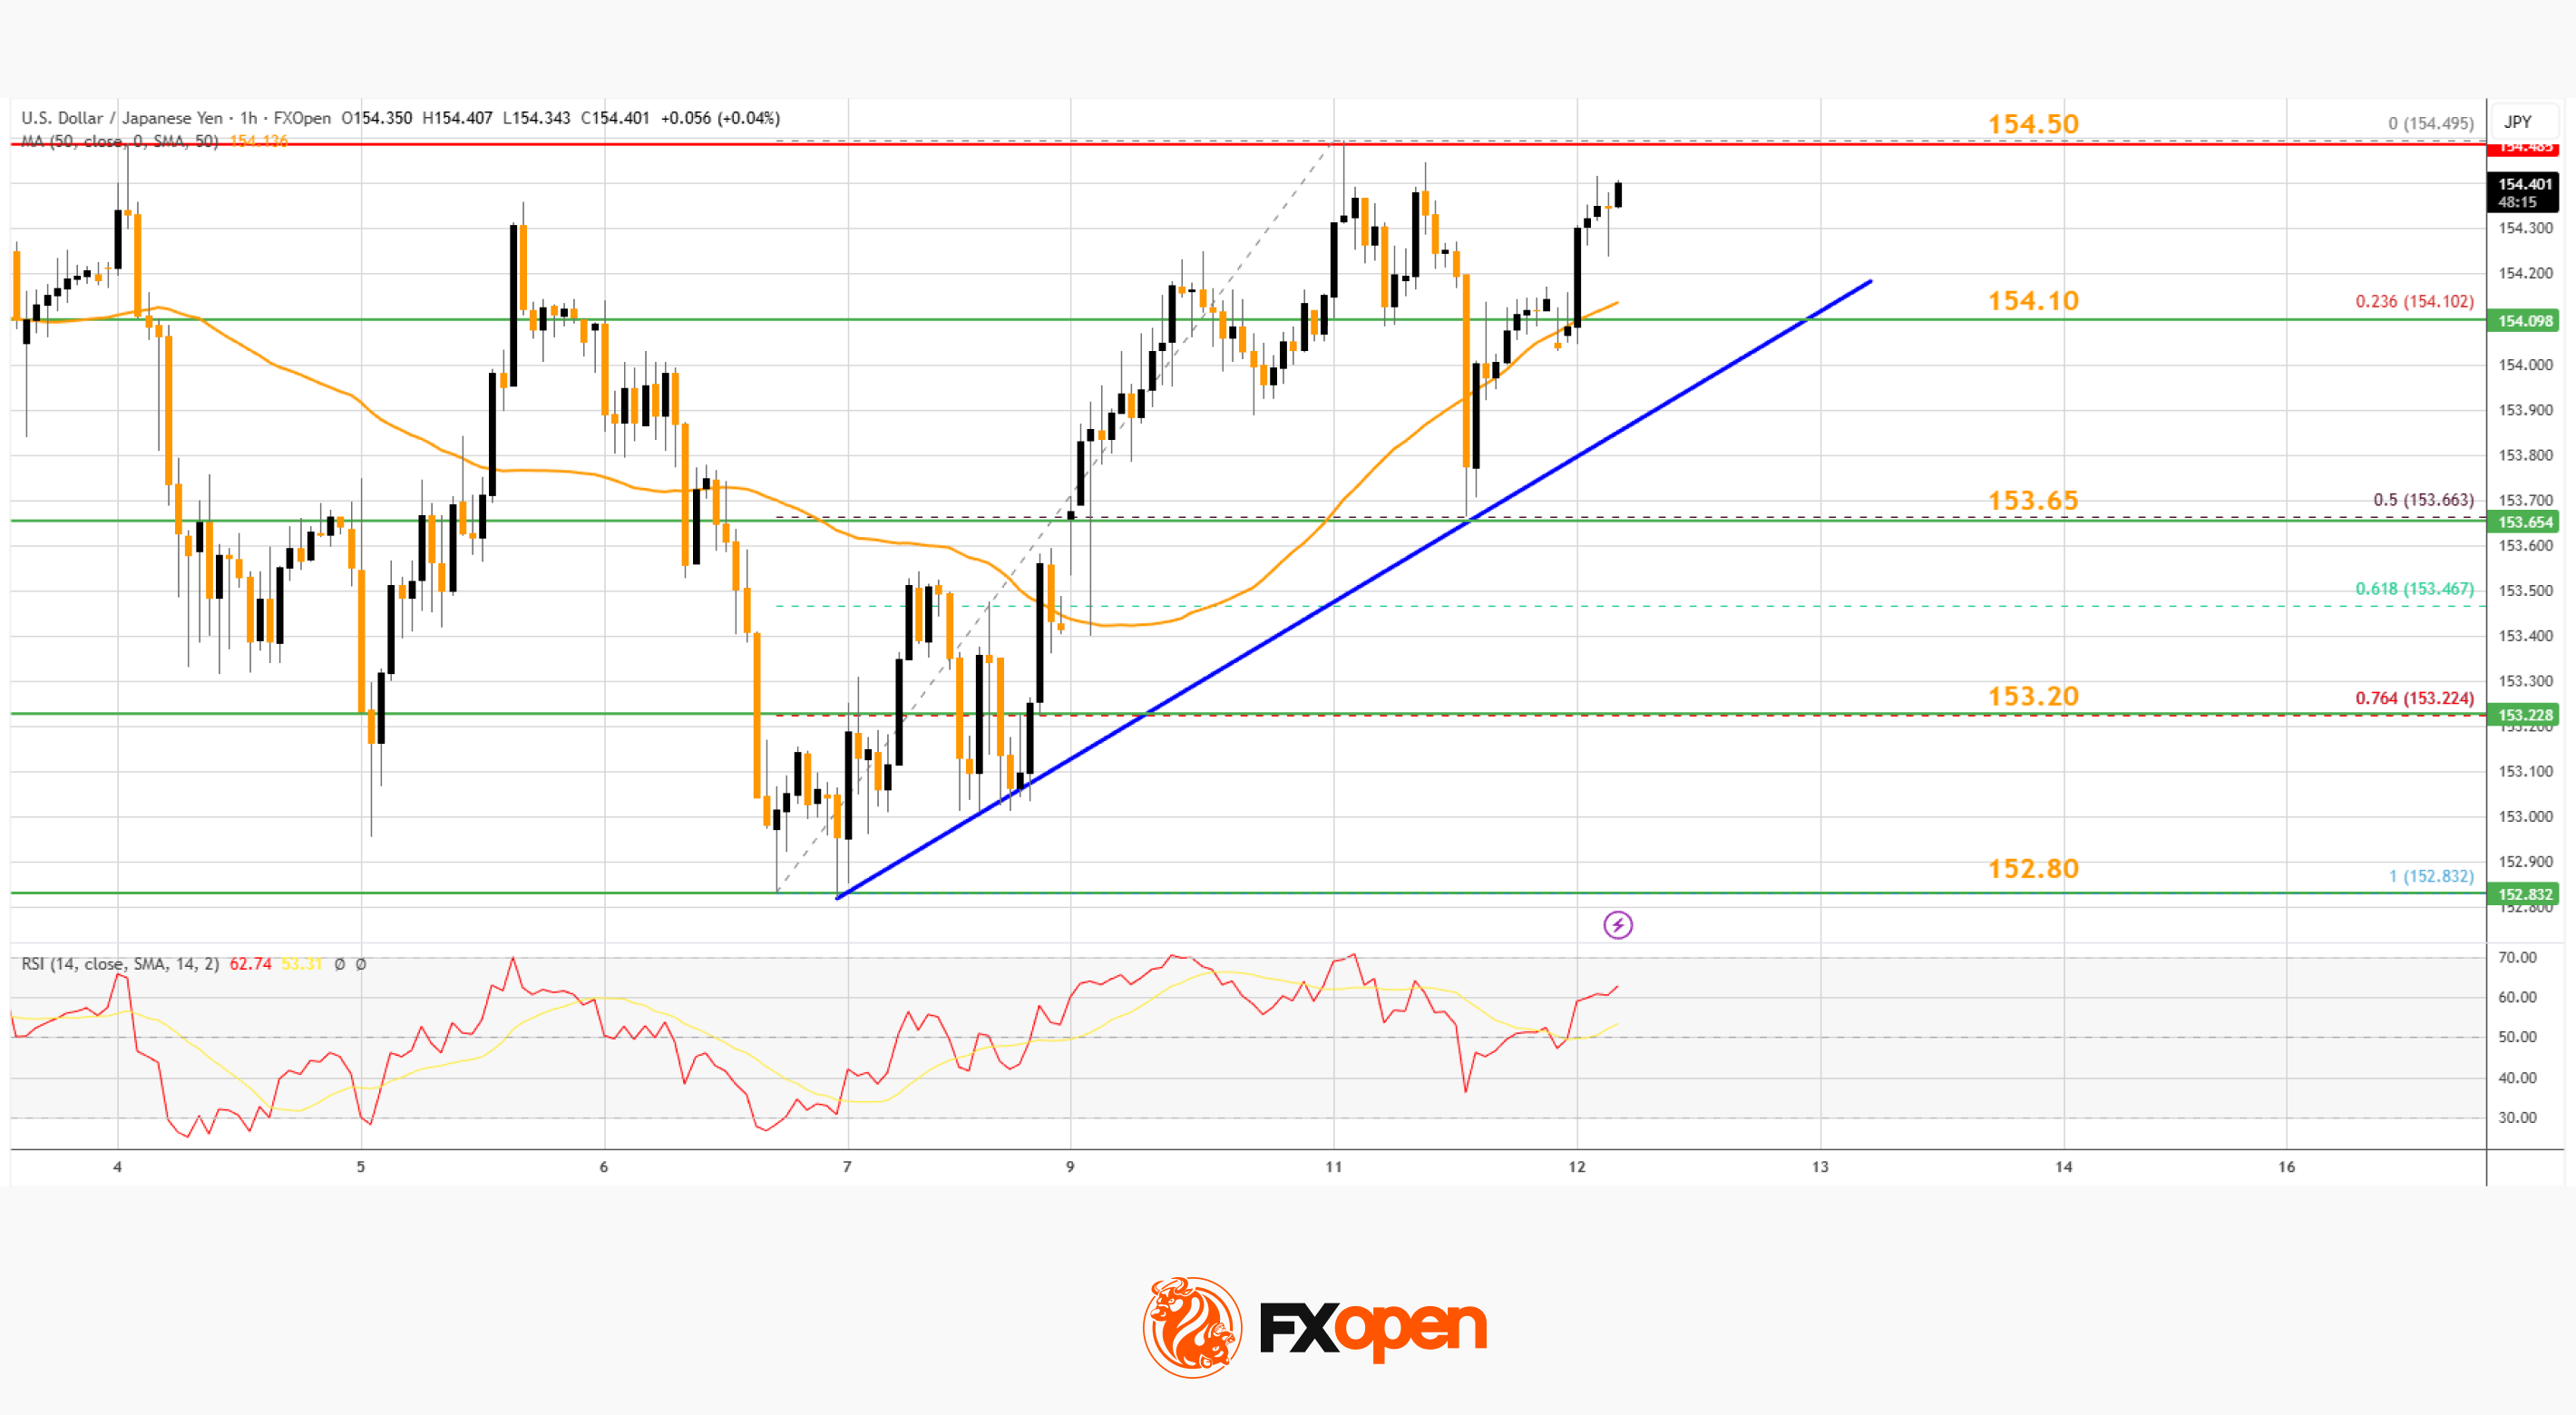
However, the bulls protected the 50% Fib retracement level of the upward move from the 152.83 swing low to the 154.49 high. The current price action is positive, and the pair seems to be aiming for more gains.
There is also a bullish trend line forming with support near 154.10. Immediate resistance on the USD/JPY chart is near 154.50. The first key hurdle sits at 155.00. If there is a close above 155.00 and the RSI moves above 70, the pair could rise toward 156.20.
The next stop for the bulls might be 156.80, above which the pair could test 158.00 in the coming days. On the downside, the first major support is near the trend line at 154.10.
The next area of interest could be near 153.65, below which the pair could test the 76.4% Fib retracement at 153.20. Any more losses could open the doors for a move toward 152.80.
Trade over 50 forex markets 24 hours a day with FXOpen. Take advantage of low commissions, deep liquidity, and spreads from 0.0 pips (additional fees may apply). Open your FXOpen account now or learn more about trading forex with FXOpen.
This article represents the opinion of the Companies operating under the FXOpen brand only. It is not to be construed as an offer, solicitation, or recommendation with respect to products and services provided by the Companies operating under the FXOpen brand, nor is it to be considered financial advice.
Stay ahead of the market!
Subscribe now to our mailing list and receive the latest market news and insights delivered directly to your inbox.


Latest articles

Tesla (TSLA) Shares Surge Following Musk’s Announcements
According to the chart, Tesla (TSLA) shares had been under significant pressure since the start of 2026: from their December high, they had lost around 25% of their value. The main bearish drivers included:
→ Intense competition from Chinese automakers, particularly

XTI/USD Analysis: WTI Oil Prices Under Pressure from Trump’s Statements
Yesterday, following a false bullish breakout above the psychological $100 level, WTI crude prices fell sharply towards the $85 area. The primary driver of this rapid decline was comments made by the US President.
According to Donald Trump:
→ the United
