


Market Analysis: EUR/USD Remains At Risk While USD/JPY Trims Gains
FXOpen

EUR/USD started a fresh decline below the 1.0765 support. USD/JPY rallied significantly above 140.00 and recently started a downside correction.
Important Takeaways for EUR/USD and USD/JPY Analysis Today
· The Euro is declining and showing bearish signs below the 1.0745 resistance zone.
· There is a key bearish trend line forming with resistance near 1.0715 on the hourly chart of EUR/USD at FXOpen.
· USD/JPY started a major rally above the 138.88 and 140.00 levels.
· There is a major bullish trend line forming with support near 139.65 on the hourly chart at FXOpen.
EUR/USD Technical Analysis
On the hourly chart of EUR/USD at FXOpen, the pair started a fresh decline from the 1.0790 resistance. The Euro declined below the 1.0745 support zone against the US Dollar.
It settled below the 50-hour simple moving average and spiked below 1.0690. A low was formed near 1.0672 before there was a minor recovery. The pair climbed above 1.0715 but the bears were active near the 1.0745 resistance.
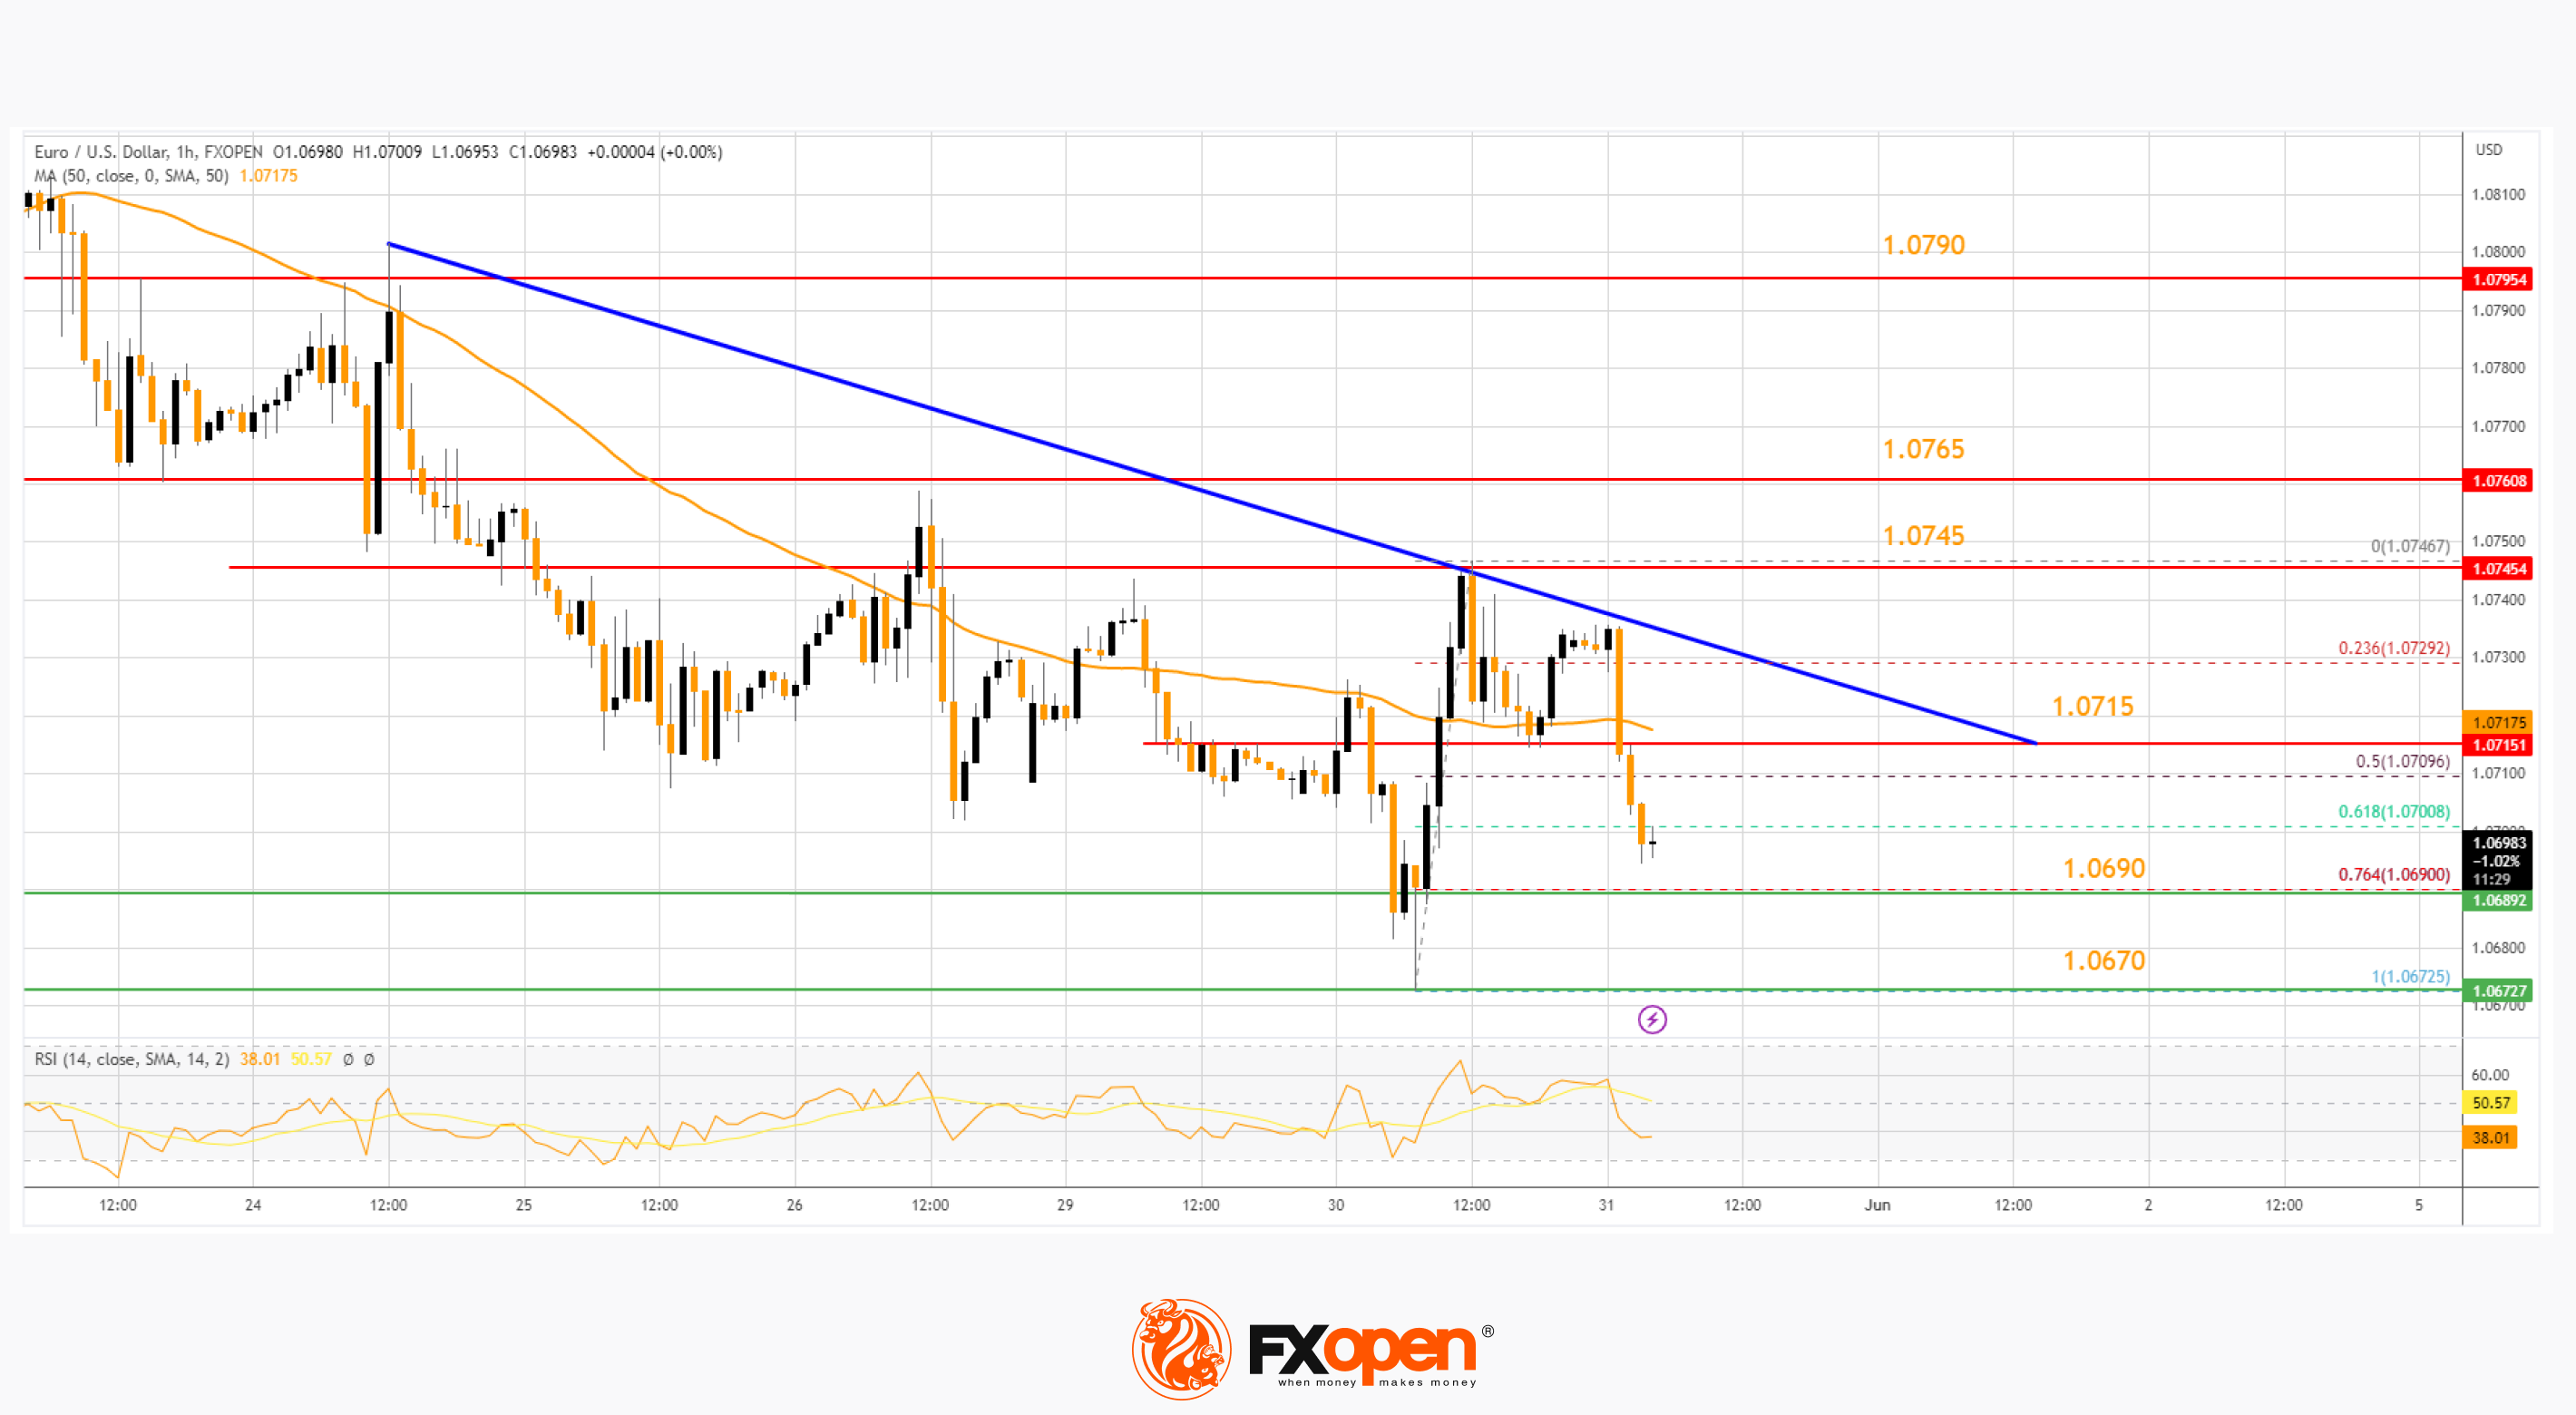
A high is formed near 1.0746 and the pair is again moving lower. There was a move below the 50% Fib retracement level of the upward move from the 1.0672 low to the 1.0746 high.
The RSI is dipping and EUR/USD is approaching the 76.4% Fib retracement level of the upward move from the 1.0672 low to the 1.0746 high at 1.0690. The first major support is near the 1.0670 level, below which the pair could start a major decline. In the stated case, the pair might dive toward the 1.0620 support zone.
On the EUR/USD chart, the pair is now facing resistance near a key bearish trend line at 1.0715. The next major resistance is near the 1.0745 level. An upside break above 1.0745 could set the pace for another increase. In the stated case, the pair might visit 1.0790.
USD/JPY Technical Analysis
On the hourly chart of USD/JPY at FXOpen, the pair started a fresh increase from the 138.88 zone. It gained bullish momentum and was able to clear the 140.00 resistance.
Finally, there was a move above 140.50 and the pair spiked toward 141.00. A high was formed near 140.90 before the pair corrected lower. There was a drop below the 50-hour simple moving average at 140.20.
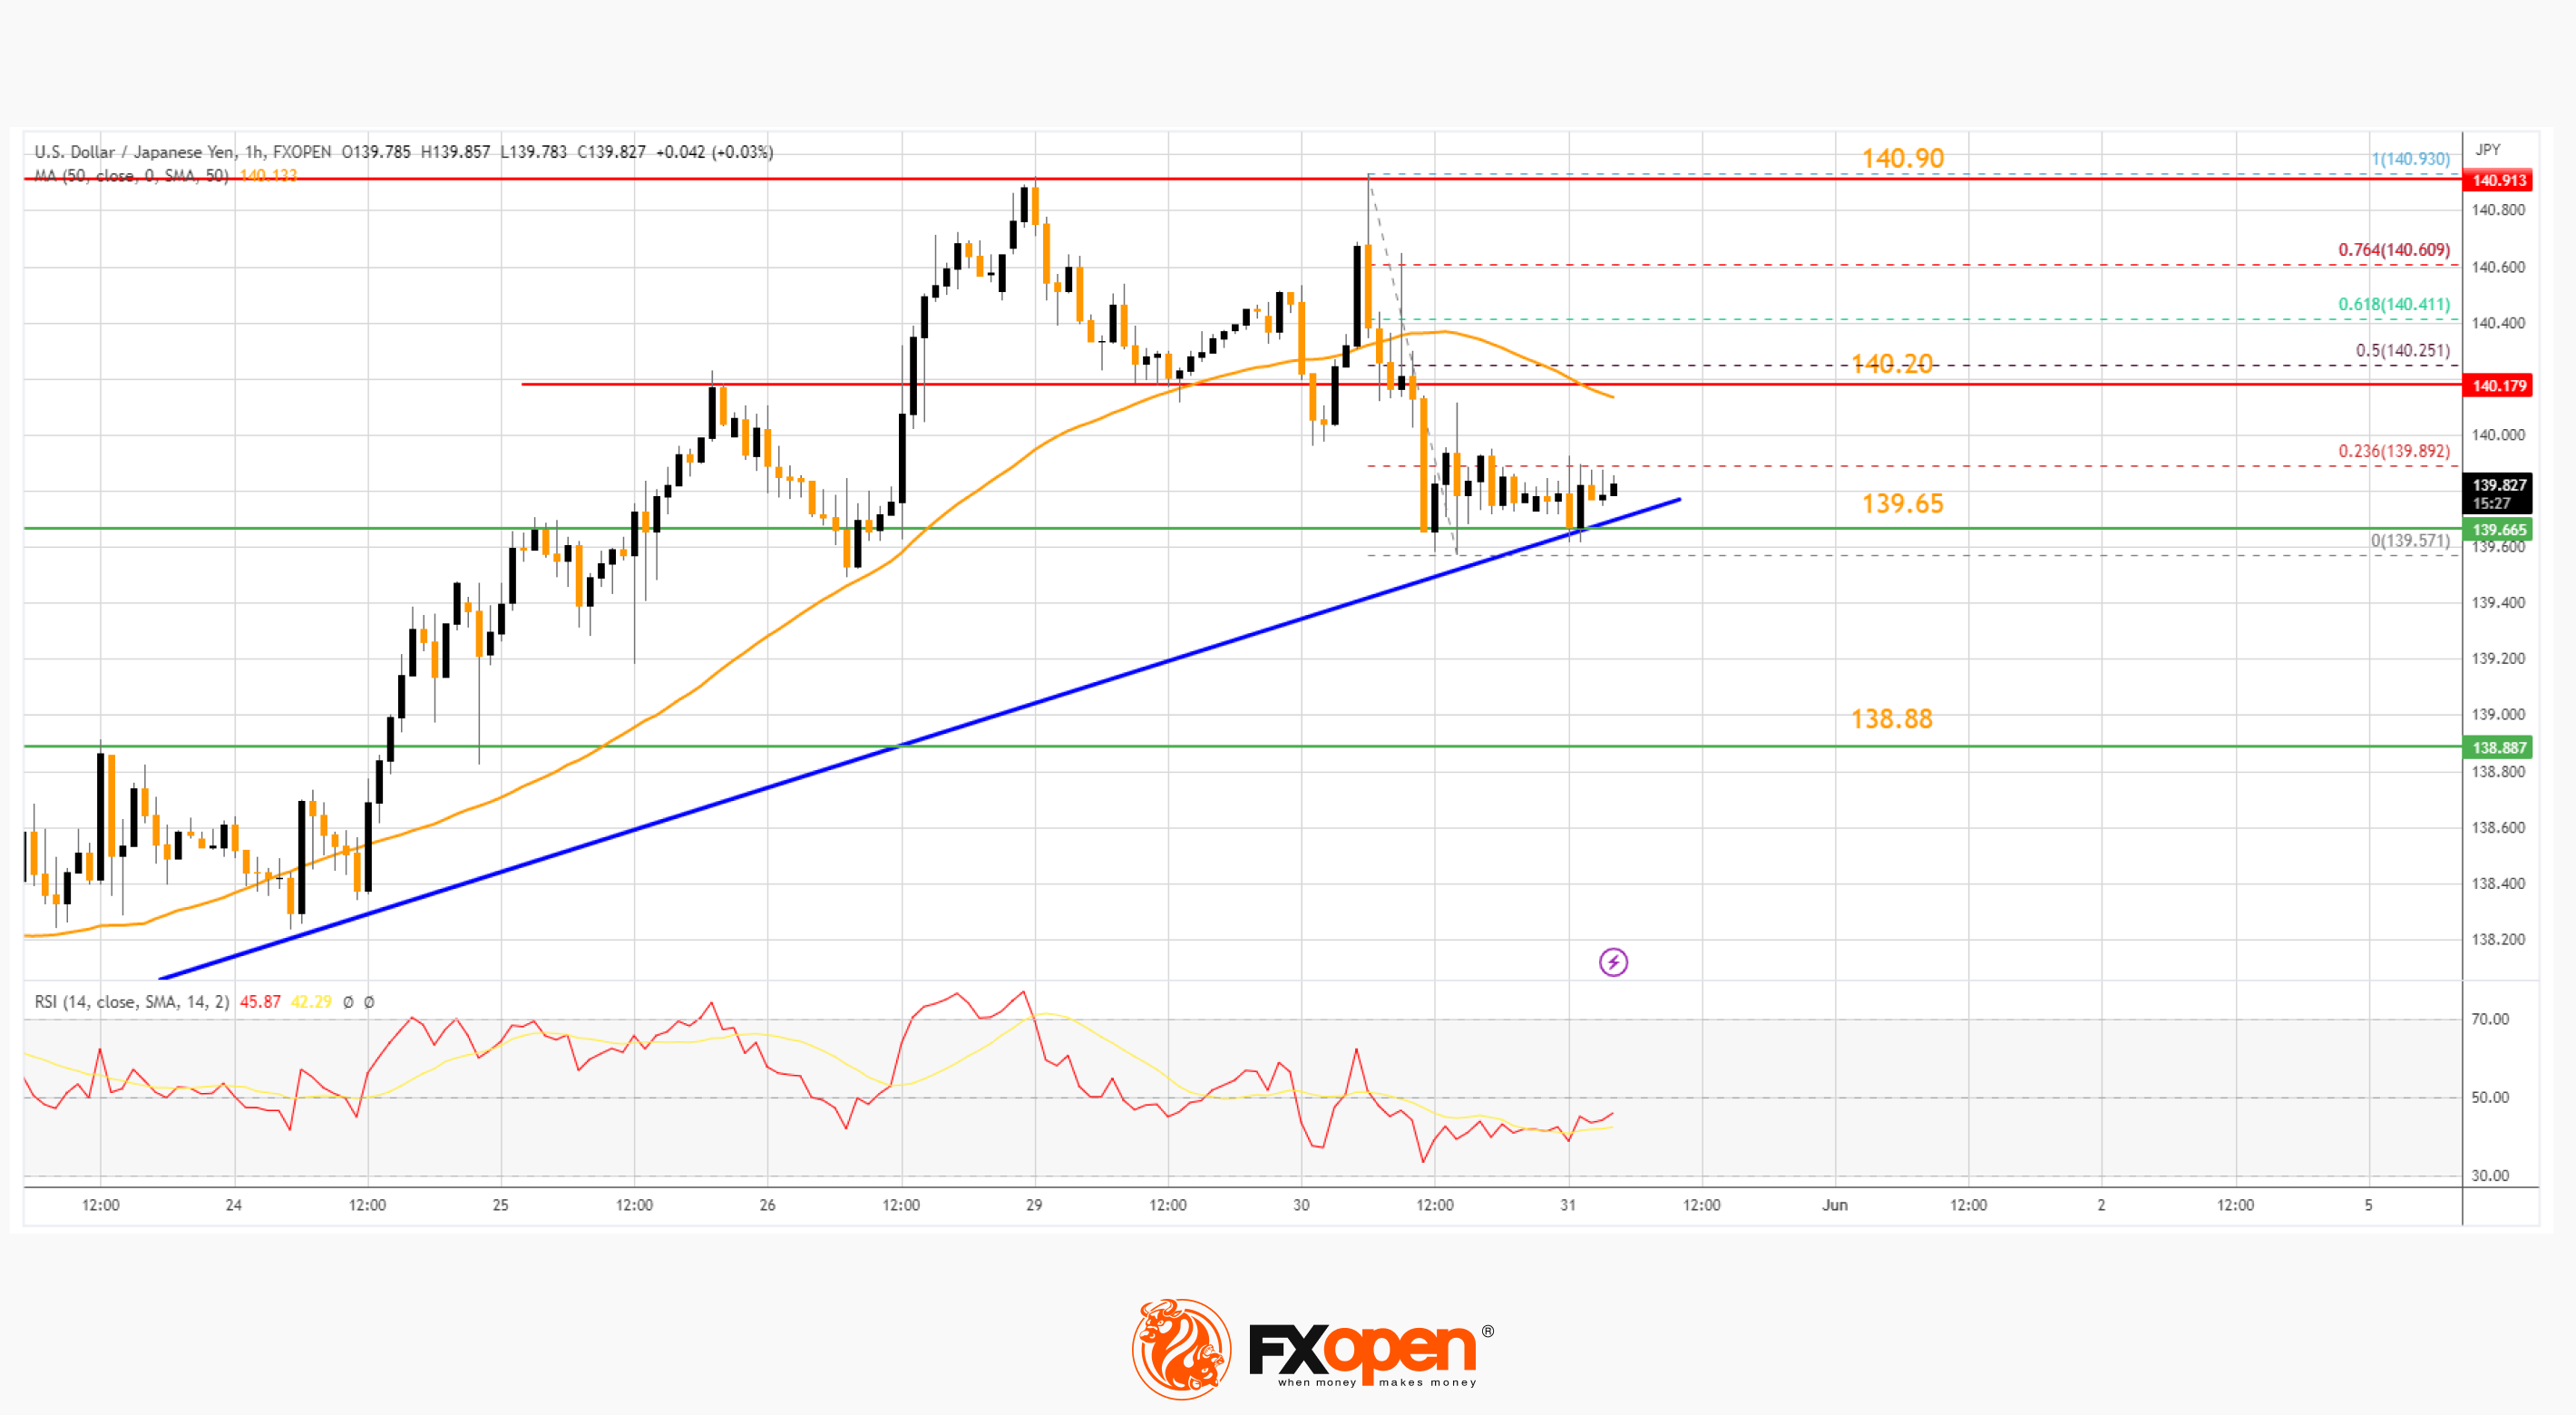
However, the bulls are active near a major bullish trend line at 139.65. A low is formed near 139.57 and the pair is now consolidating.
On the upside, the pair is facing resistance near the 23.6% Fib retracement level of the recent decline from the 140.93 swing high to the 139.57 low. The first major resistance is near the 50-hour simple moving average at 140.20. It is close to the 50% Fib retracement level of the recent decline from the 140.93 swing high to the 139.57 low.
If there is a close above the 140.20 level and RSI moves above 50, the pair could revisit 140.90. The next major resistance is near 141.20, above which the pair could test 142.00.
Conversely, the pair might break the trend line support. The next major support is near the 138.88 level, below which the pair could start a major decline. In the stated case, the pair might dive toward the 138.00 support.
Trade over 50 forex markets 24 hours a day with FXOpen. Take advantage of low commissions, deep liquidity, and spreads from 0.0 pips (additional fees may apply). Open your FXOpen account now or learn more about trading forex with FXOpen.
This article represents the opinion of the Companies operating under the FXOpen brand only. It is not to be construed as an offer, solicitation, or recommendation with respect to products and services provided by the Companies operating under the FXOpen brand, nor is it to be considered financial advice.
Stay ahead of the market!
Subscribe now to our mailing list and receive the latest market news and insights delivered directly to your inbox.


Latest articles

Weekly Market Insights with Gary Thomson: The Week of Central Banks and Earnings
In this video, we’ll explore the key economic events and market trends, shaping the financial landscape. Get ready for insights into financial markets to help you navigate the week ahead. Let’s dive in!
In this episode of Market

Intel at a Crossroads: Earnings Beat Meets Technical Resistance
Intel has just delivered its strongest quarter in over fifteen years, and the market reaction says it all. Q2 2026 revenue surged 25% year-over-year to $16.1 billion, crushing the consensus estimate of $14.42 billion, while adjusted EPS of

Tesla: Complex Range Structure Breaks Down Following Quarterly Earnings
Tesla released its Q2 2026 results after the market closed on 22 July. Revenue increased 26% year-on-year to $28.24 billion, while vehicle deliveries reached a record 480,126 units. However, operating margin fell sharply to 1.4%, down from