


Market Analysis: EUR/USD Resumes Rally While USD/CHF Drops To Support
FXOpen
EUR/USD started a fresh increase above the 1.0890 resistance. USD/CHF declined and now struggling below the 0.8700 resistance.
Important Takeaways for EUR/USD and USD/CHF Analysis Today
· The Euro rallied after it broke the 1.0890 resistance against the US Dollar.
· There is a connecting bullish trend line forming with support near 1.0955 on the hourly chart of EUR/USD at FXOpen.
· USD/CHF declined below the 0.8705 and 0.8665 support levels.
· There is a key bearish trend line forming with resistance near 0.8665 on the hourly chart at FXOpen.
EUR/USD Technical Analysis
On the hourly chart of EUR/USD at FXOpen, the pair started a fresh increase from the 1.0740 zone. The Euro cleared the 1.0830 resistance to move into a bullish zone against the US Dollar, as mentioned in the previous analysis.
The bulls pushed the pair above the 50-hour simple moving average and 1.0890. Finally, the pair tested the 1.1000 resistance. A high is formed near 1.1009 and the pair is now consolidating gains. Immediate support on the downside is near the 1.0955 level.
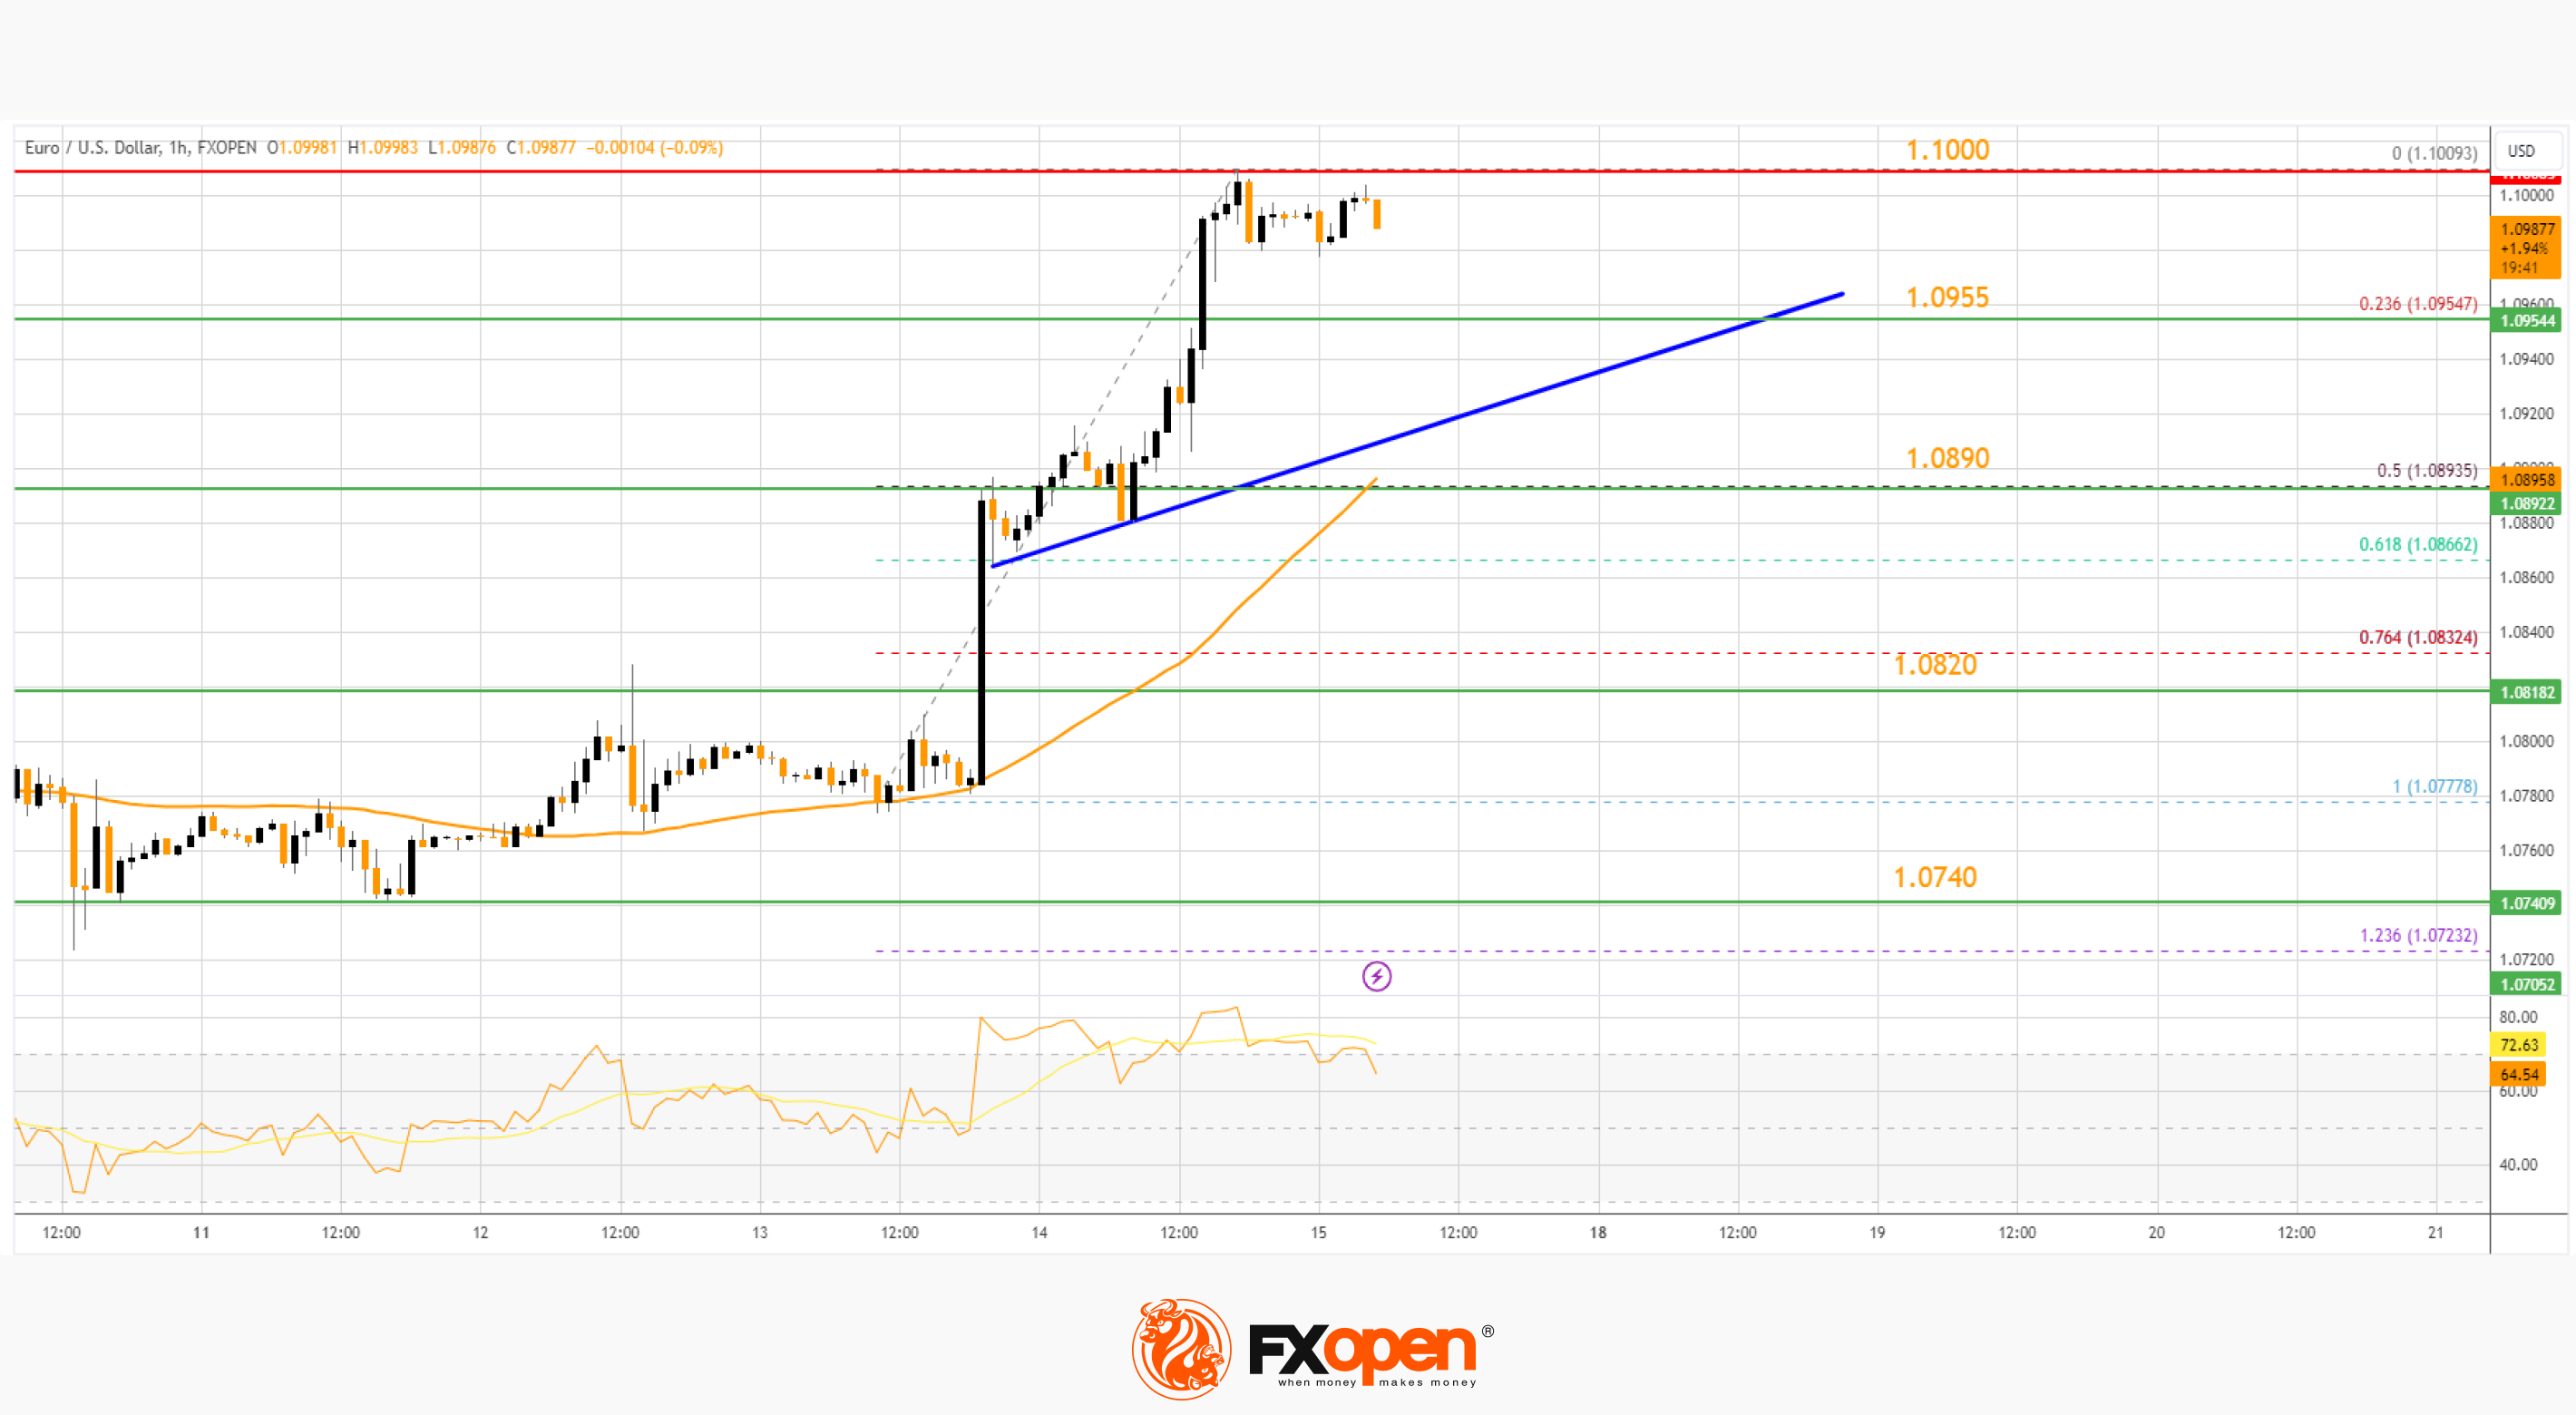
There is also a connecting bullish trend line forming with support near 1.0955. It is close to the 23.6% Fib retracement level of the upward wave from the 1.0777 swing low to the 1.1009 high.
The next major support is the 50% Fib retracement level of the upward wave from the 1.0777 swing low to the 1.1009 high at 1.0890. A downside break below the 1.0890 support could send the pair toward the 1.0820 level. Any more losses might send the pair into a bearish zone to 1.0740.
Immediate resistance on the EUR/USD chart is near the 1.1000 zone. The first major resistance is near the 1.1020 level. An upside break above the 1.1020 level might send the pair toward the 1.1065 resistance.
The next major resistance is near the 1.1080 level. Any more gains might open the doors for a move toward the 1.1150 level.
USD/CHF Technical Analysis
On the hourly chart of USD/CHF at FXOpen, the pair started a fresh decline from well above the 0.8800 zone. The US Dollar dropped below the 0.8750 support to move into a negative zone against the Swiss Franc.
The bears pushed the pair below the 50-hour simple moving average and 0.8700. Finally, the bulls appeared near the 0.8630 level. A low is formed near 0.8630 and the pair is now attempting a recovery wave.
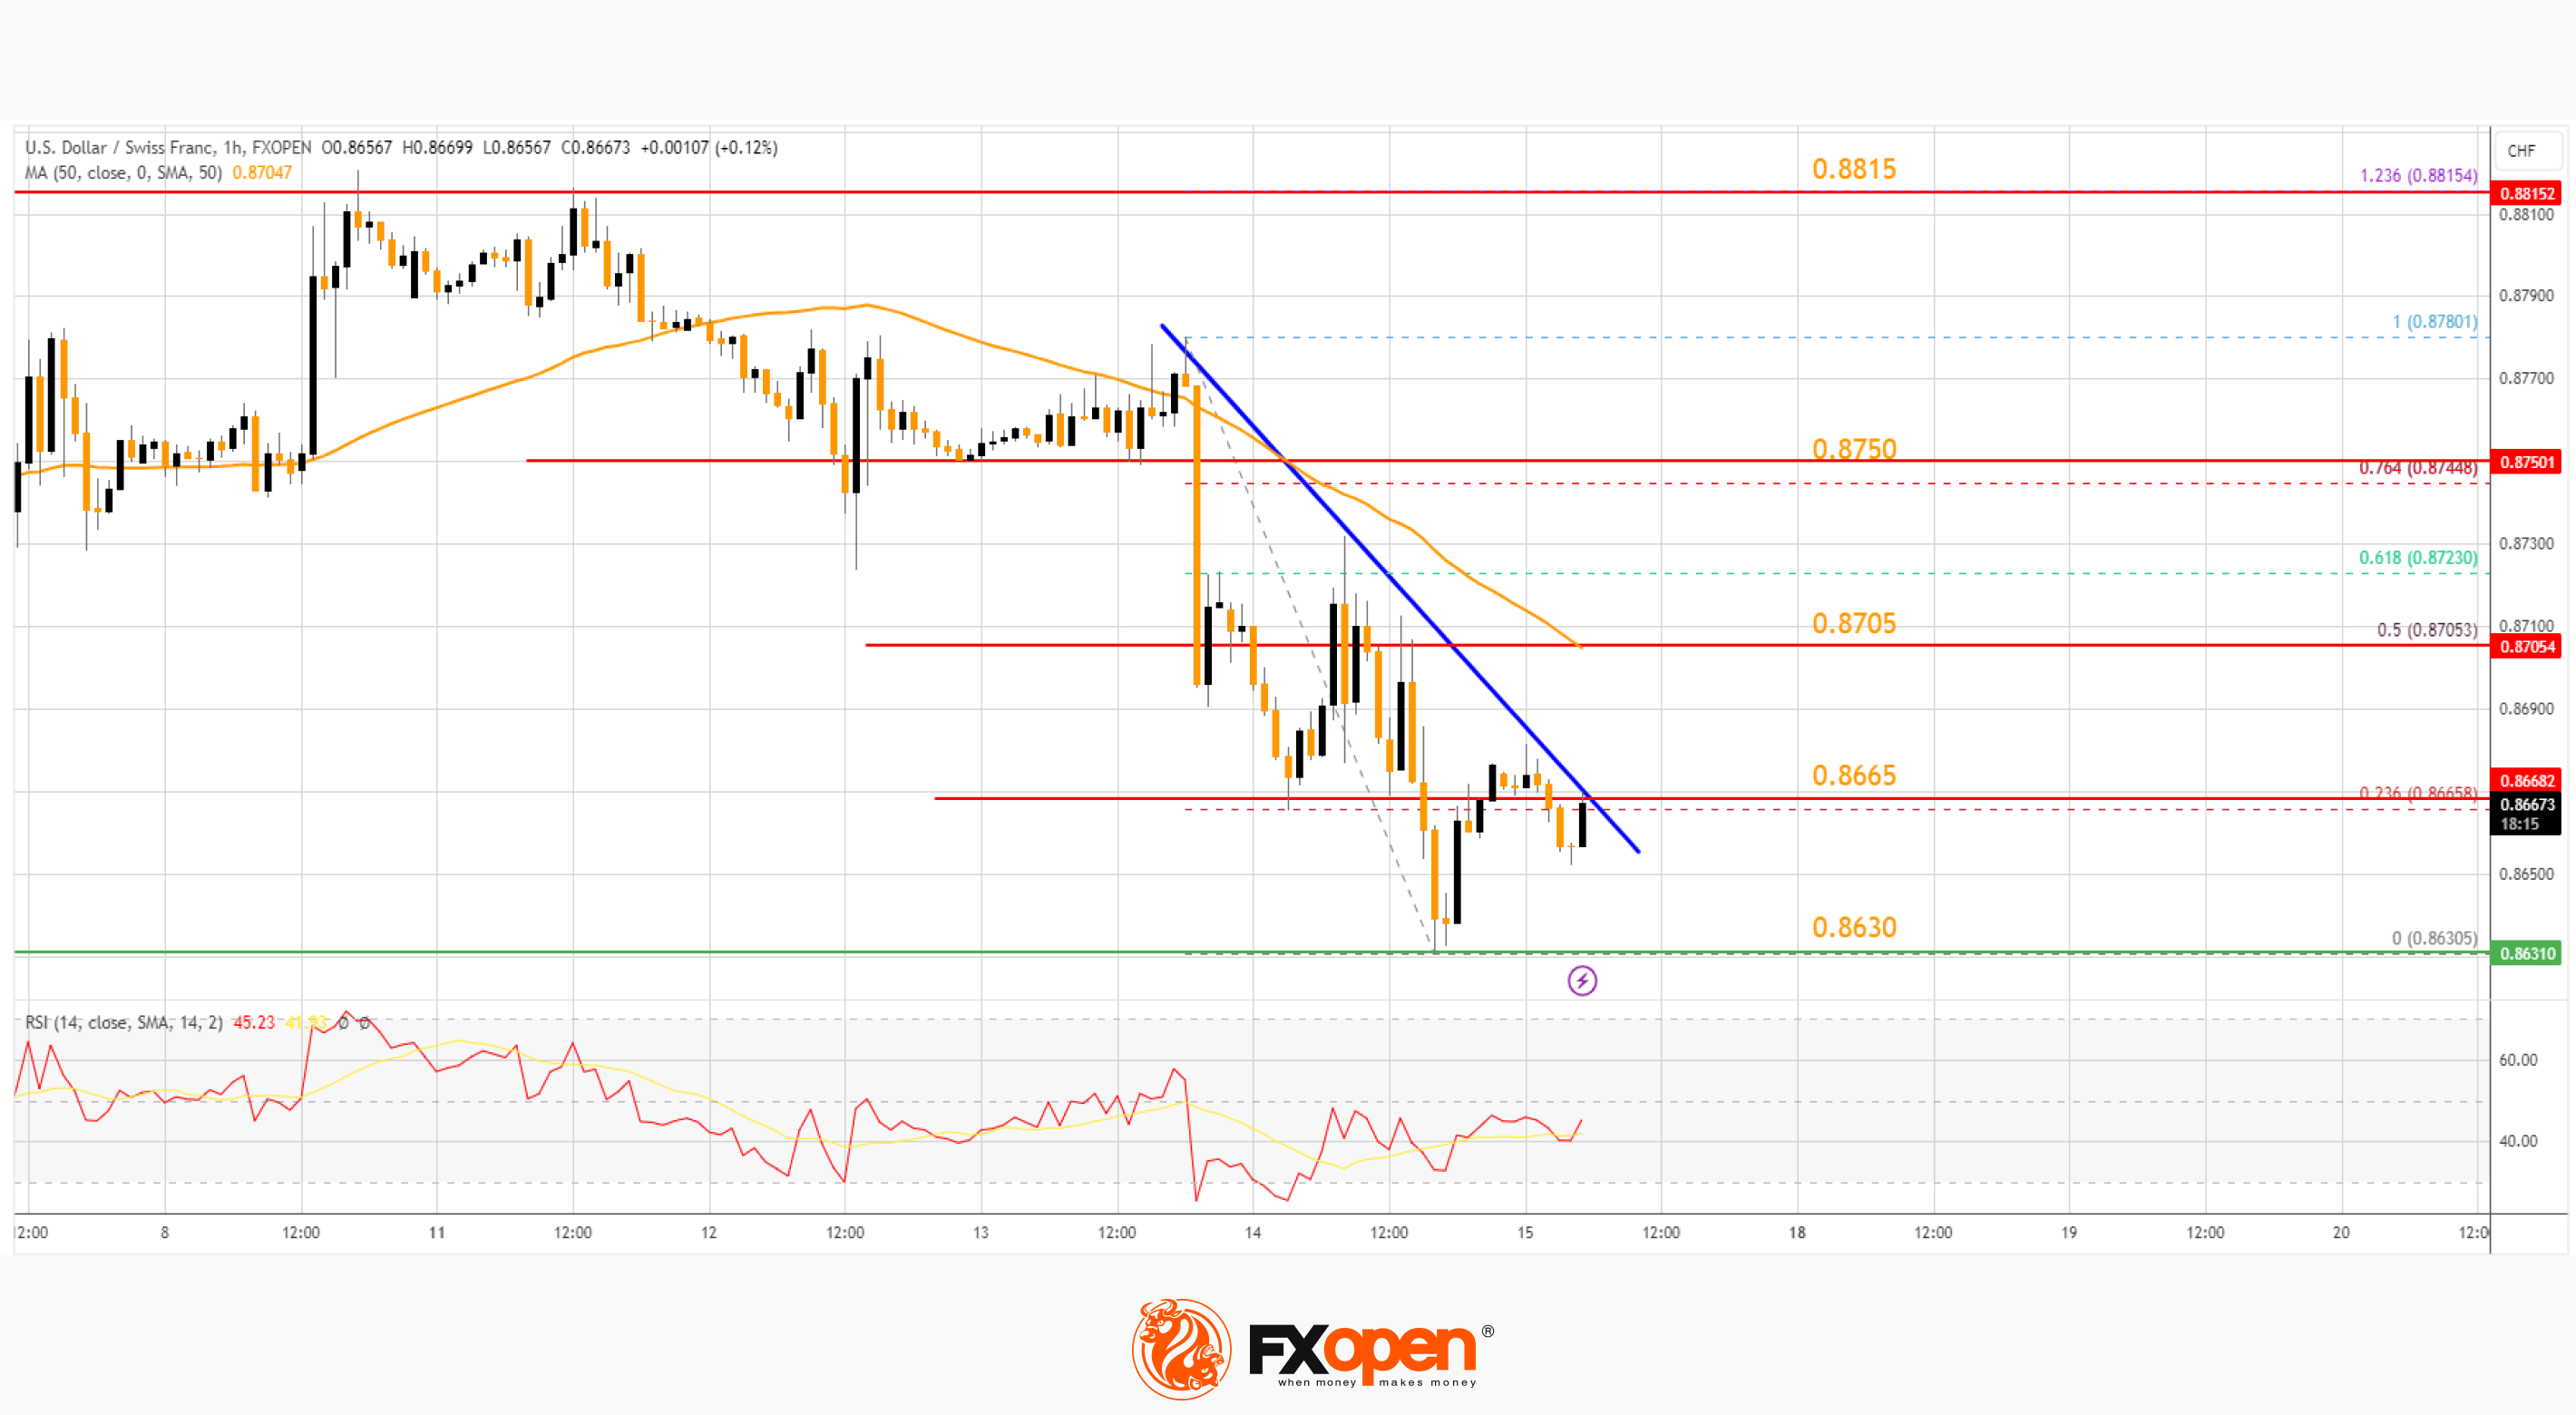
On the upside, the pair could face resistance near the 23.6% Fib retracement level of the downward move from the 0.8780 swing high to the 0.8630 low at 0.8665.
There is also a key bearish trend line forming with resistance near 0.8665. The next major resistance is near the 50% Fib retracement level of the downward move from the 0.8780 swing high to the 0.8630 low at 0.8705.
If there is a clear break above the 0.8705 resistance zone, the pair could start another increase. In the stated case, it could even surpass 0.8750.
On the downside, immediate support on the USD/CHF chart is 0.8630. The first major support is near the 0.8600 level. The next major support is near 0.8580. Any more losses may possibly open the doors for a move toward the 0.8500 level in the coming days.
Trade over 50 forex markets 24 hours a day with FXOpen. Take advantage of low commissions, deep liquidity, and spreads from 0.0 pips (additional fees may apply). Open your FXOpen account now or learn more about trading forex with FXOpen.
This article represents the opinion of the Companies operating under the FXOpen brand only. It is not to be construed as an offer, solicitation, or recommendation with respect to products and services provided by the Companies operating under the FXOpen brand, nor is it to be considered financial advice.
Stay ahead of the market!
Subscribe now to our mailing list and receive the latest market news and insights delivered directly to your inbox.


Latest articles

Weekly Market Insights with Gary Thomson: The Week of Central Banks and Earnings
In this video, we’ll explore the key economic events and market trends, shaping the financial landscape. Get ready for insights into financial markets to help you navigate the week ahead. Let’s dive in!
In this episode of Market

Intel at a Crossroads: Earnings Beat Meets Technical Resistance
Intel has just delivered its strongest quarter in over fifteen years, and the market reaction says it all. Q2 2026 revenue surged 25% year-over-year to $16.1 billion, crushing the consensus estimate of $14.42 billion, while adjusted EPS of

Tesla: Complex Range Structure Breaks Down Following Quarterly Earnings
Tesla released its Q2 2026 results after the market closed on 22 July. Revenue increased 26% year-on-year to $28.24 billion, while vehicle deliveries reached a record 480,126 units. However, operating margin fell sharply to 1.4%, down from