


Market Analysis: EUR/USD Retreats, USD/JPY Eyes Fresh Surge
FXOpen

EUR/USD declined from the 1.0950 resistance and traded below 1.0850. USD/JPY is rising and might gain pace above the 151.00 resistance.
Important Takeaways for EUR/USD and USD/JPY Analysis Today
· The Euro started a fresh decline below the 1.0850 support zone.
· There is a key bearish trend line forming with resistance at 1.0820 on the hourly chart of EUR/USD at FXOpen.
· USD/JPY climbed higher above the 149.55 and 150.00 levels.
· There is a connecting bullish trend line forming with support at 150.30 on the hourly chart at FXOpen.
EUR/USD Technical Analysis
On the hourly chart of EUR/USD at FXOpen, the pair struggled to clear the 1.0950 resistance zone. The Euro started a fresh decline and traded below the 1.0850 support zone against the US Dollar.
The pair declined below 1.0820 and tested the 1.0775 zone. A low was formed near 1.0776 and the pair started a consolidation phase. There was a minor recovery wave above the 1.0800 level. The pair tested the 23.6% Fib retracement level of the downward move from the 1.0954 swing high to the 1.0776 low.
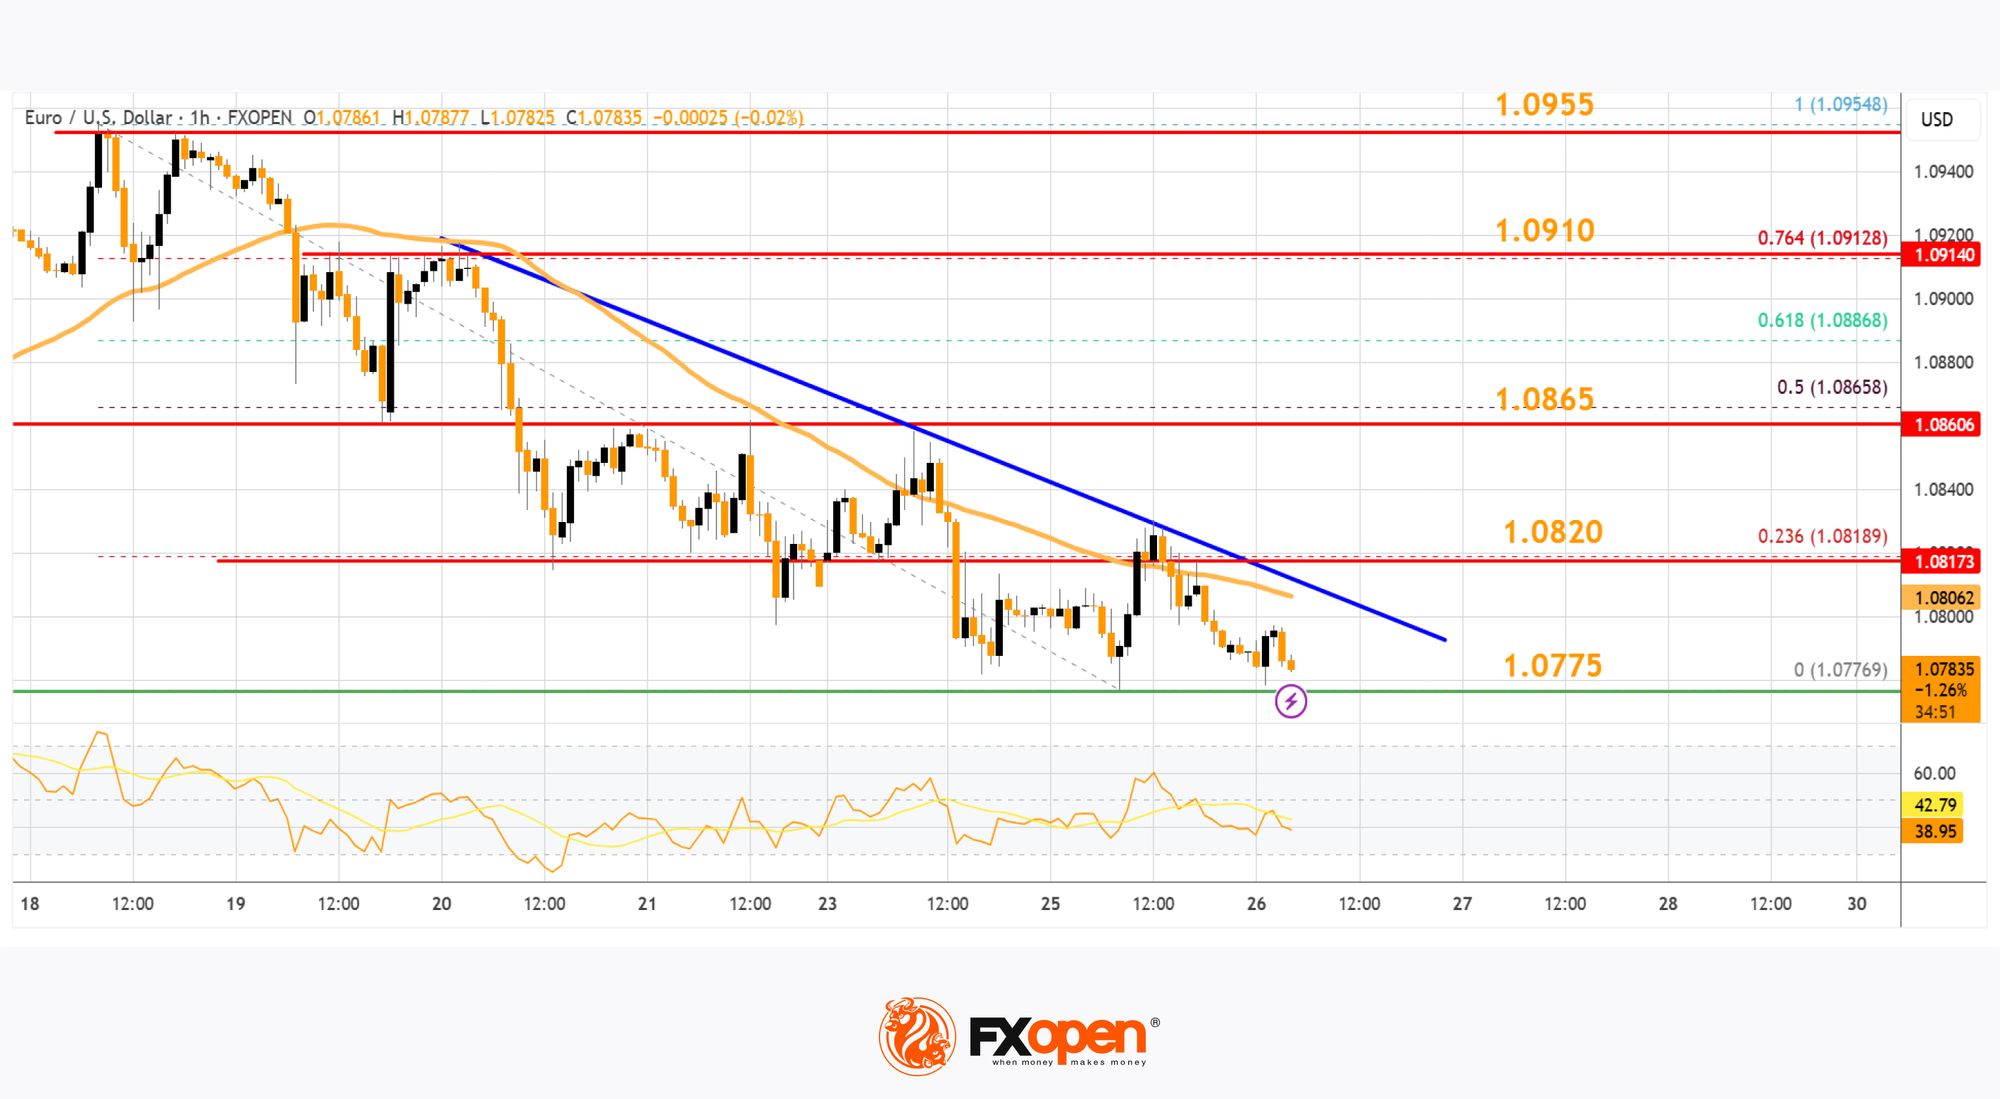
The pair is now trading below 1.0820 and the 50-hour simple moving average. On the upside, the pair is now facing resistance near the 1.0820 level. There is also a key bearish trend line forming with resistance at 1.0820.
The next key resistance is at 1.0850. The main resistance is near the 1.0865 level or the 50% Fib retracement level of the downward move from the 1.0954 swing high to the 1.0776 low.
A clear move above the 1.0865 level could send the pair toward the 1.0910 resistance. An upside break above 1.0910 could set the pace for another increase. In the stated case, the pair might rise toward 1.0950.
If not, the pair might resume its decline. The first major support on the EUR/USD chart is near 1.0775. The next key support is at 1.0750. If there is a downside break below 1.0725, the pair could drop toward 1.0700. The next support is near 1.0650, below which the pair could start a major decline.
USD/JPY Technical Analysis
On the hourly chart of USD/JPY at FXOpen, the pair started a fresh upward move from the 148.20 zone. The US Dollar gained bullish momentum above 148.80 against the Japanese Yen.
It even cleared the 50-hour simple moving average and 149.55. The pair climbed above 150.00 and traded as high as 150.94. It is now consolidating gains and there was a move below the 23.6% Fib retracement level of the upward move from the 148.18 swing low to the 150.94 high.
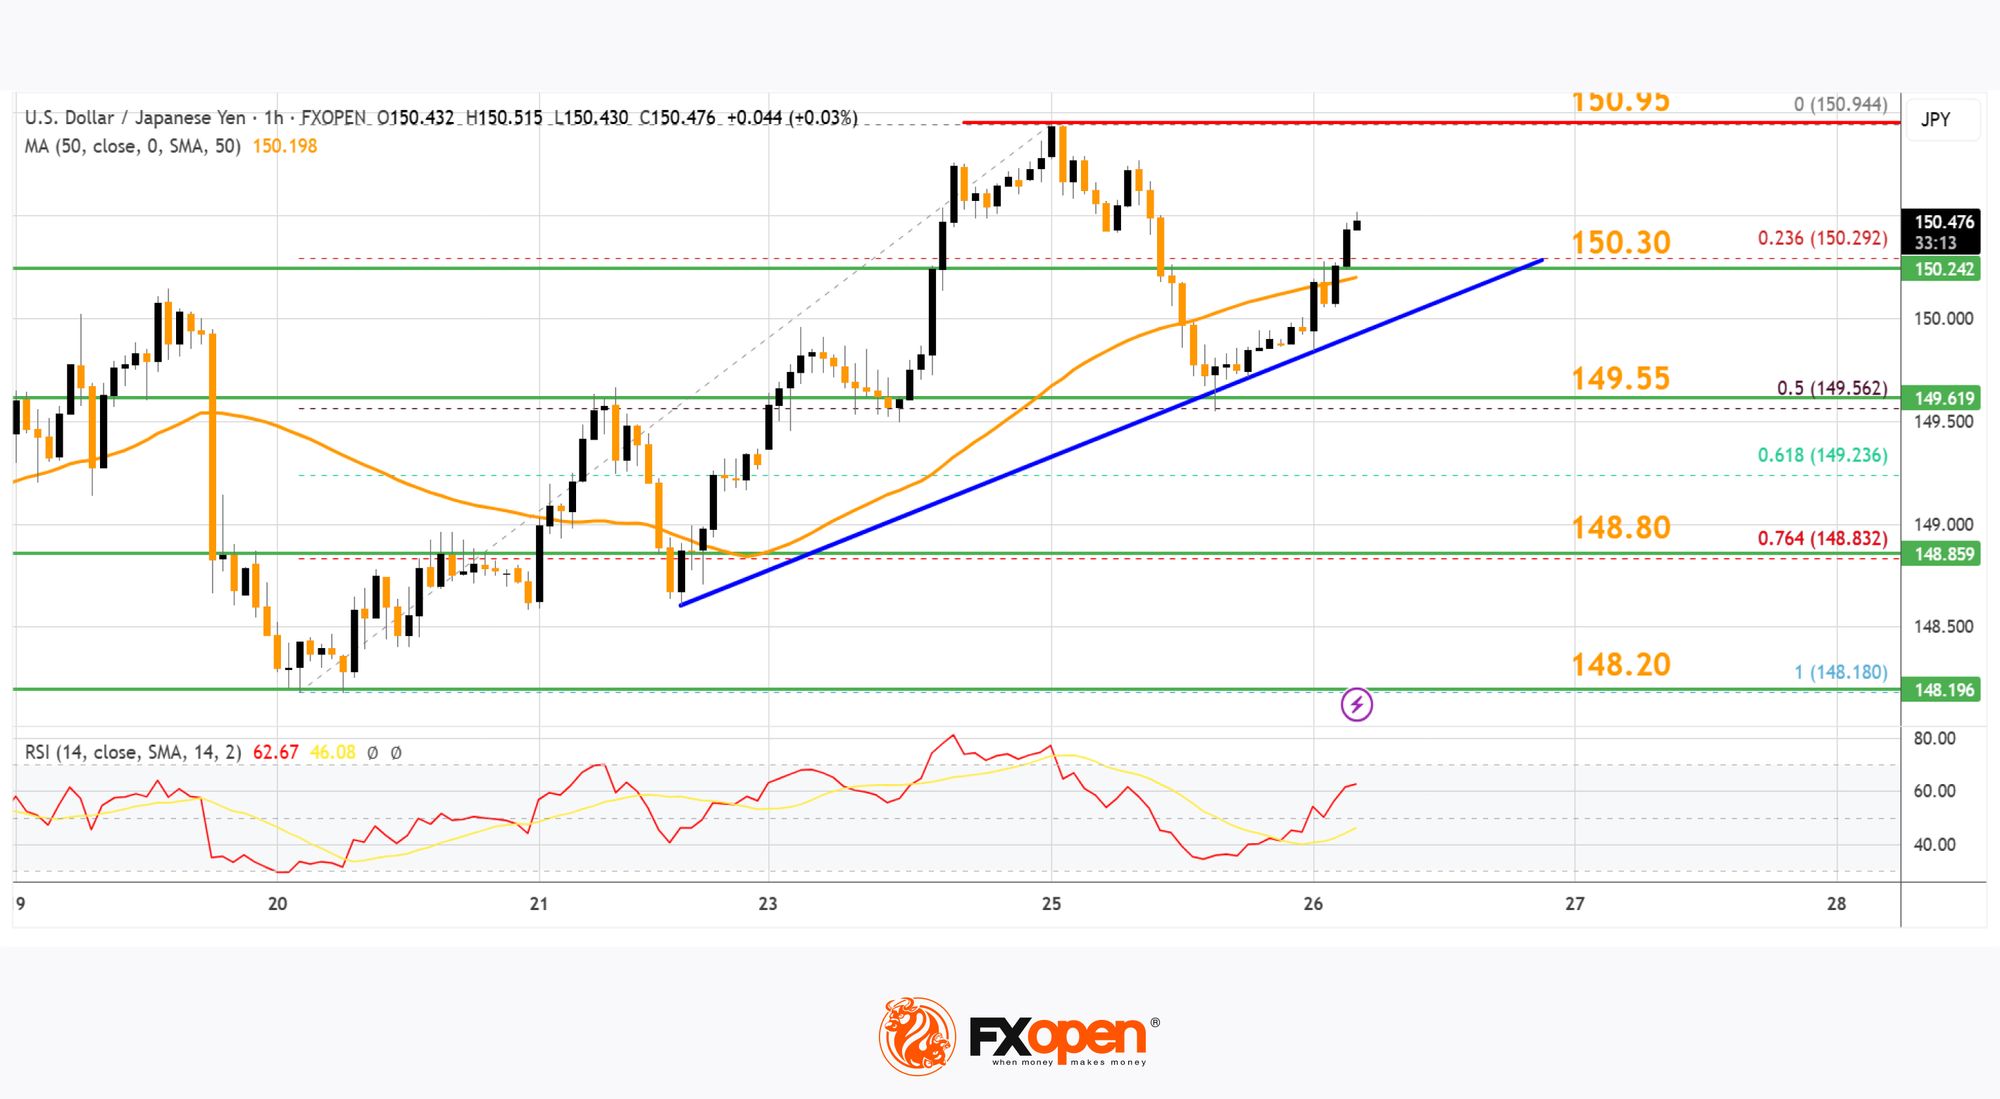
The current price action above the 150.00 level is positive. Immediate resistance on the USD/JPY chart is near 150.95. The first major resistance is near 151.20. If there is a close above the 151.20 level and the RSI moves above 70, the pair could rise toward 152.50.
The next major resistance is near 153.20, above which the pair could test 155.00 in the coming days. On the downside, the first major support is 150.30 and a bullish trend line, below which the bears could gain strength.
The next major support is visible near the 149.55 level and the 50% Fib retracement level of the upward move from the 148.18 swing low to the 150.94 high.
If there is a close below 149.55, the pair could decline steadily. In the stated case, the pair might drop toward the 148.40 support zone. The next stop for the bears may perhaps be near the 147.50 region.
Trade over 50 forex markets 24 hours a day with FXOpen. Take advantage of low commissions, deep liquidity, and spreads from 0.0 pips (additional fees may apply). Open your FXOpen account now or learn more about trading forex with FXOpen.
This article represents the opinion of the Companies operating under the FXOpen brand only. It is not to be construed as an offer, solicitation, or recommendation with respect to products and services provided by the Companies operating under the FXOpen brand, nor is it to be considered financial advice.
Stay ahead of the market!
Subscribe now to our mailing list and receive the latest market news and insights delivered directly to your inbox.


Latest articles

Amazon: New Bond Issuance to Fund AI Infrastructure
On 7 July, Amazon announced an eight-tranche bond offering worth at least $25 billion, with the proceeds expected to finance the construction of data centres and the expansion of its artificial intelligence infrastructure. Investor demand peaked at $62 billion, highlighting

Weekly Market Insights with Gary Thomson: US Inflation, UK GDP, Chair Warsh Testimony, and Earnings
In this video, we’ll explore the key economic events and market trends, shaping the financial landscape. Get ready for insights into financial markets to help you navigate the week ahead. Let’s dive in!
In this episode of Market

GBP/AUD Analysis: The Tug-of-War Begins
Oil is back in the driver's seat, and both the pound and the aussie are feeling its grip. The Bank of England held rates at 3.75% in June, but with UK inflation at 2.8% and crude oil climbing