


Apple Analysis: Price Tests the POC Area Following Trend Breakdown
FXOpen

Apple shares remain under close scrutiny after several notable developments. On 10 August, Jefferies downgraded the stock from Hold to Underperform and lowered its price target from $285.56 to $263.66. The investment bank suggested that Apple may have abandoned plans for an all-glass iPhone intended to mark the product line’s 20th anniversary due to manufacturing challenges. According to Jefferies, this decision could limit the company’s ability to increase average selling prices at a time when memory component costs are rising.
At the same time, Apple announced the opening of a new manufacturing facility in Houston, where Mac mini production is expected to begin at a later stage. The project forms part of the company’s broader $600 billion initiative aimed at expanding its manufacturing footprint across the United States.
Technical Analysis of Apple
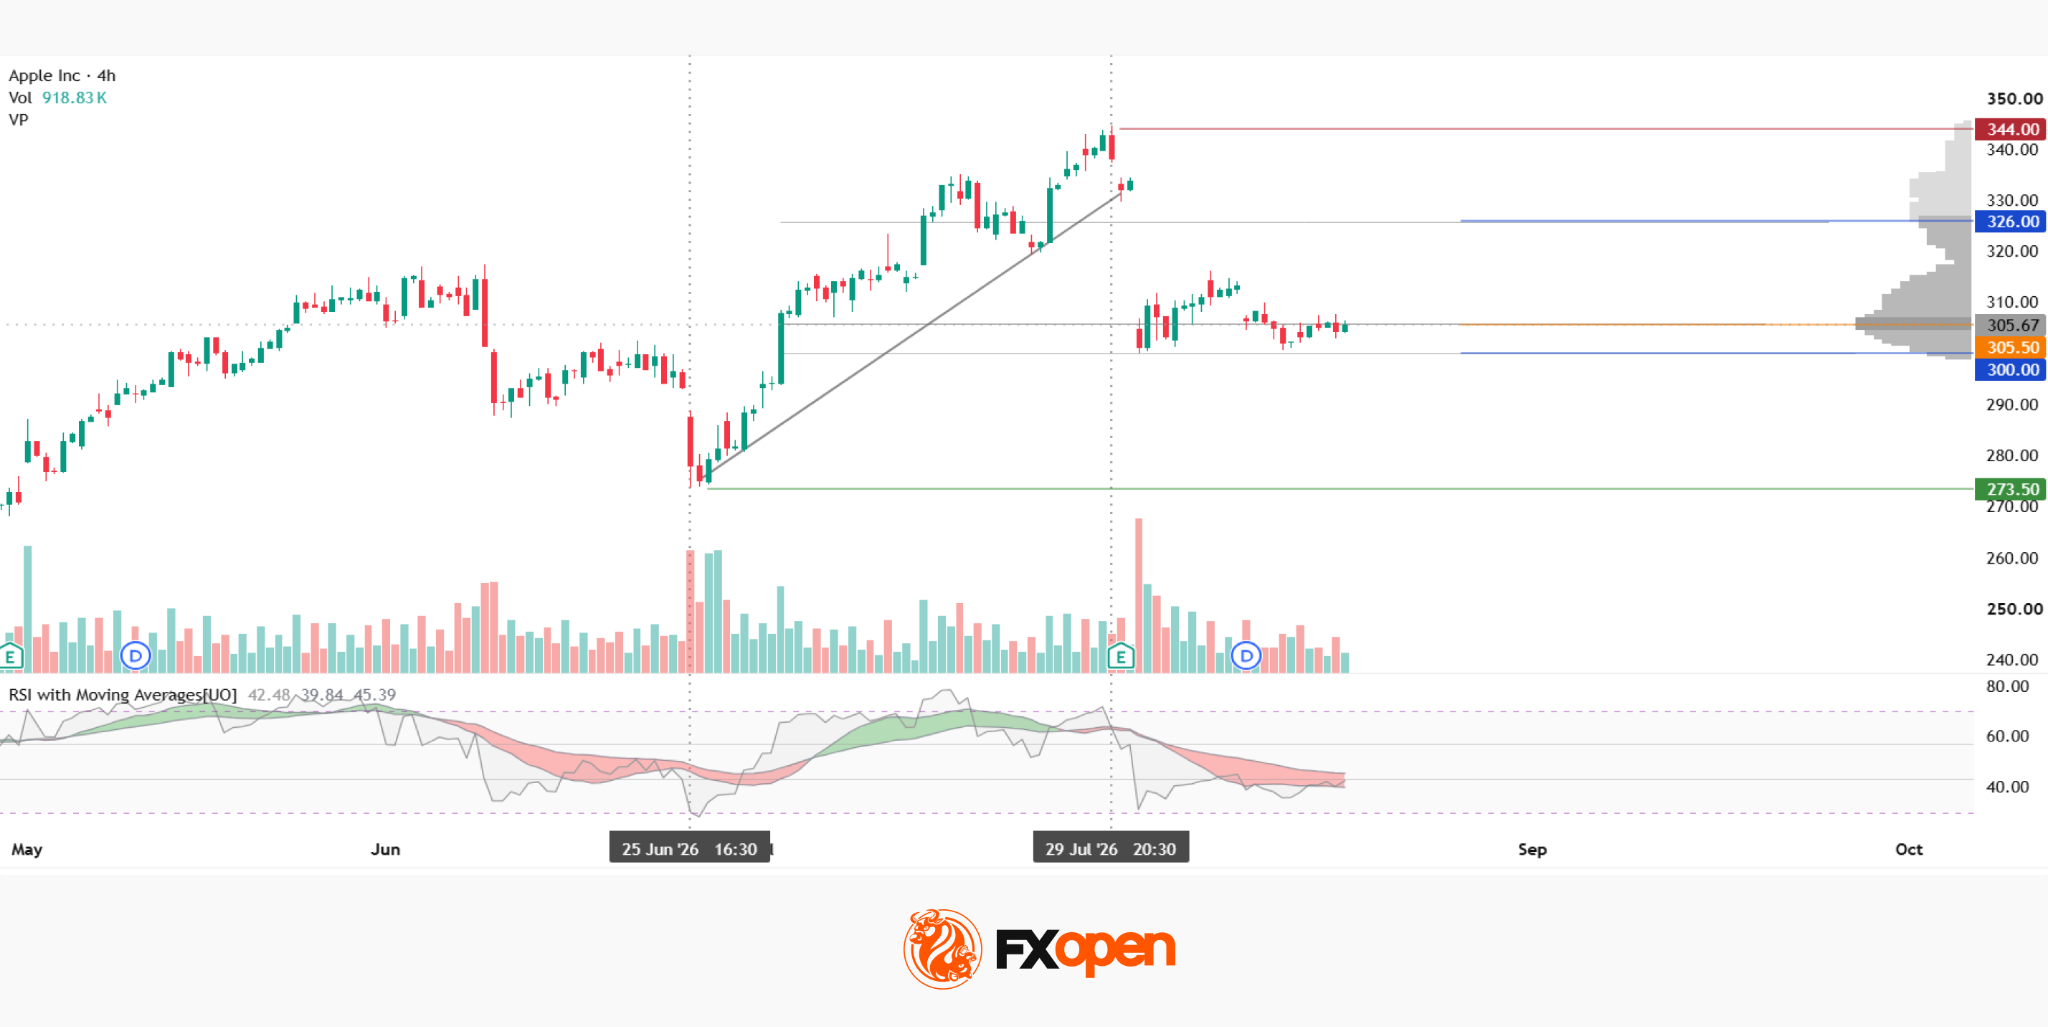
The four-hour chart highlights a significant technical event that occurred on 31 July, when the price moved below a rising trendline through a gap accompanied by trading volume well above recent averages. Despite the strength of that move, the breakdown has not yet developed into a sustained decline.
Instead, the stock has entered a consolidation phase, creating a well-defined market profile. Apple is currently trading between the Point of Control (POC) at $305.50 and the lower boundary of the profile at $300.00, while testing the POC area from below. Beneath the current consolidation zone, the next major support level can be found around $273.50.
Should the trend breakdown ultimately fail and buyers regain control, attention would shift towards two key resistance areas. The first is the upper boundary of the profile at $326.00, followed by a more substantial resistance zone near $344.00.
The RSI + MAs indicator currently stands at 42, 39 and 45. Both the RSI and the fast-moving average remain slightly below the neutral zone, while the slower moving average has yet to cross beneath the lower threshold, indicating that bearish momentum has not been fully confirmed.
Key Takeaways
Apple’s current sideways movement around the POC reflects a period of balance following the high-volume gap that disrupted the previous uptrend. While the market has yet to confirm a decisive bearish breakout, buyers have also been unable to push the stock back into a clear upward trajectory.
The divergence between the faster and slower components of the RSI + MAs indicator leaves the technical outlook unresolved, suggesting that the next directional move will likely depend on whether the price can either reclaim the upper part of the profile or break convincingly below the current consolidation range.
Buy and sell stocks of the world's biggest publicly-listed companies with CFDs on FXOpen’s trading platform. Open your FXOpen account now or learn more about trading share CFDs with FXOpen.
This article represents the opinion of the Companies operating under the FXOpen brand only. It is not to be construed as an offer, solicitation, or recommendation with respect to products and services provided by the Companies operating under the FXOpen brand, nor is it to be considered financial advice.
Stay ahead of the market!
Subscribe now to our mailing list and receive the latest market news and insights delivered directly to your inbox.


Latest articles

CAD/JPY: The Yen's Most Historic Move in 30 Years Meets a Fragile Support
Two central banks are heading in genuinely opposite directions this week, and the tension is unmistakable. The Bank of Canada held rates steady at 2.25% on September 2, with a mildly hawkish tilt as policymakers acknowledged a broadening economic

USD/JPY and USD/CAD Await Key Fed Decision
The US dollar is consolidating against the yen and Canadian dollar ahead of the key event of the week — the Federal Reserve meeting. The Fed is widely expected to raise its policy rate by 25 basis points to a range

UnitedHealth: Fundamentals Are Healing, Now the Chart Must Agree
UnitedHealth finds itself in a genuinely split narrative right now, trading near $388, down about 15.9% from its 52-week high, even as the fundamental picture keeps improving. Q2 earnings beat expectations, with revenue of $112.03 billion, and the