


FXOpen

EUR/USD started a downside correction from the 1.0890 resistance. USD/CHF is rising and might aim a move toward the 0.9155 resistance.
Important Takeaways for EUR/USD and USD/CHF Analysis Today
· The Euro struggled to clear the 1.0890 resistance and declined against the US Dollar.
· There was a break below a key bullish trend line with support at 1.0860 on the hourly chart of EUR/USD at FXOpen.
· USD/CHF is showing positive signs above the 0.9110 resistance zone.
· There is a connecting bearish trend line forming with resistance at 0.9130 on the hourly chart at FXOpen.
EUR/USD Technical Analysis
On the hourly chart of EUR/USD at FXOpen, the pair gained pace for a move above the 1.0850 zone, as mentioned in the previous analysis. The Euro tested the 1.0890 resistance and recently corrected gains against the US Dollar.
The pair dipped below the 1.0870 level. There was a break below a key bullish trend line with support at 1.0860. It even tested the 50% Fib retracement level of the upward move from the 1.0805 swing low to the 1.0889 high.
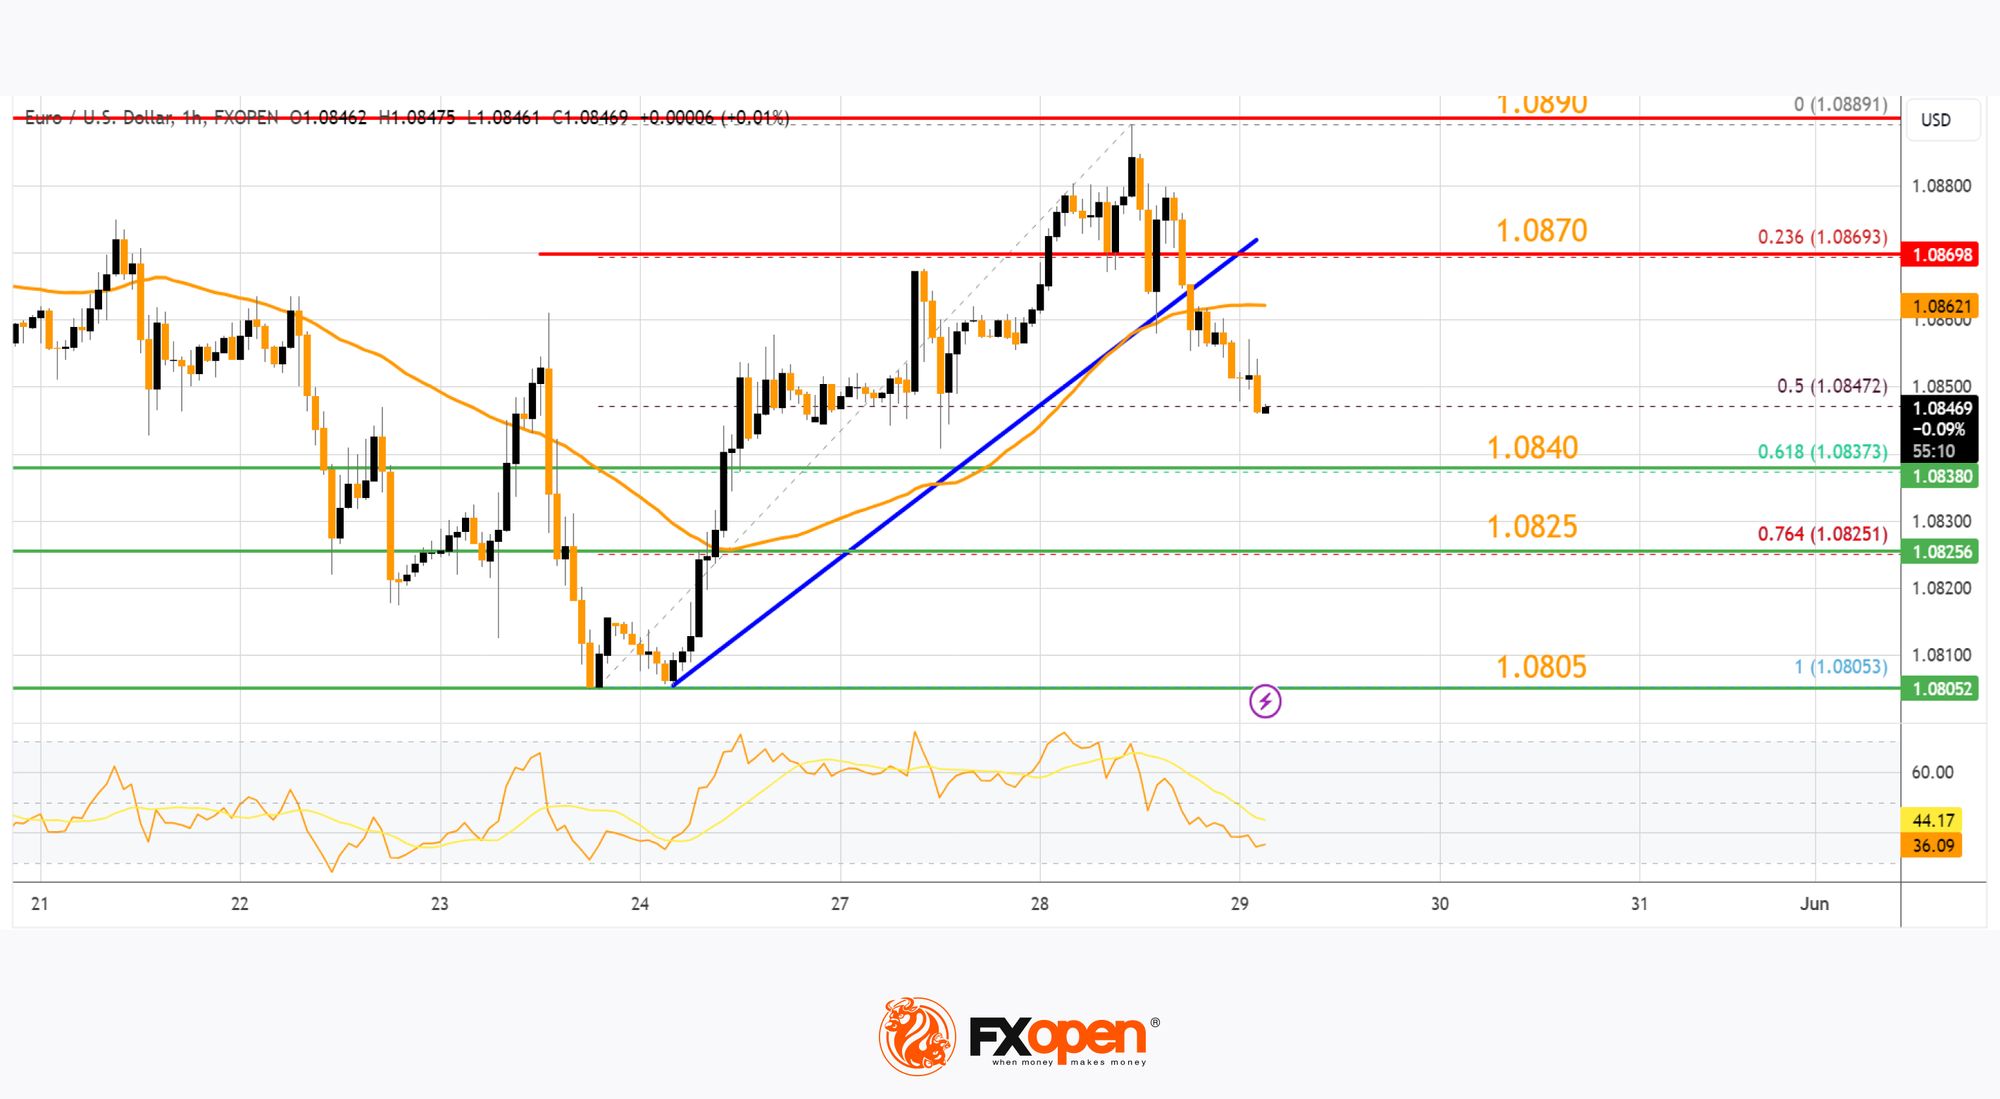
The pair is showing some bearish signs, and the upsides might remain capped. Immediate resistance on the upside is near the 50-hour simple moving average at 1.0870.
The next major resistance is near the 1.0890 zone. An upside break above the 1.0890 level might send the pair toward the 1.0920 resistance. Any more gains might open the doors for a move toward the 1.0950 level.
On the downside, immediate support on the EUR/USD chart is seen near the 61.8% Fib retracement level of the upward move from the 1.0805 swing low to the 1.0889 high at 1.0840. The next major support is near the 1.0825 level. A downside break below the 1.0825 support could send the pair toward the 1.0805 level.
USD/CHF Technical Analysis
On the hourly chart of USD/CHF at FXOpen, the pair declined heavily below the 0.9140 level before the bulls appeared. The US Dollar tested 0.9085 and recently started a fresh increase against the Swiss Franc.
The pair climbed above the 0.9110 resistance zone. There was a break above the 50% Fib retracement level of the downward move from the 0.9153 swing high to the 0.9086 low.
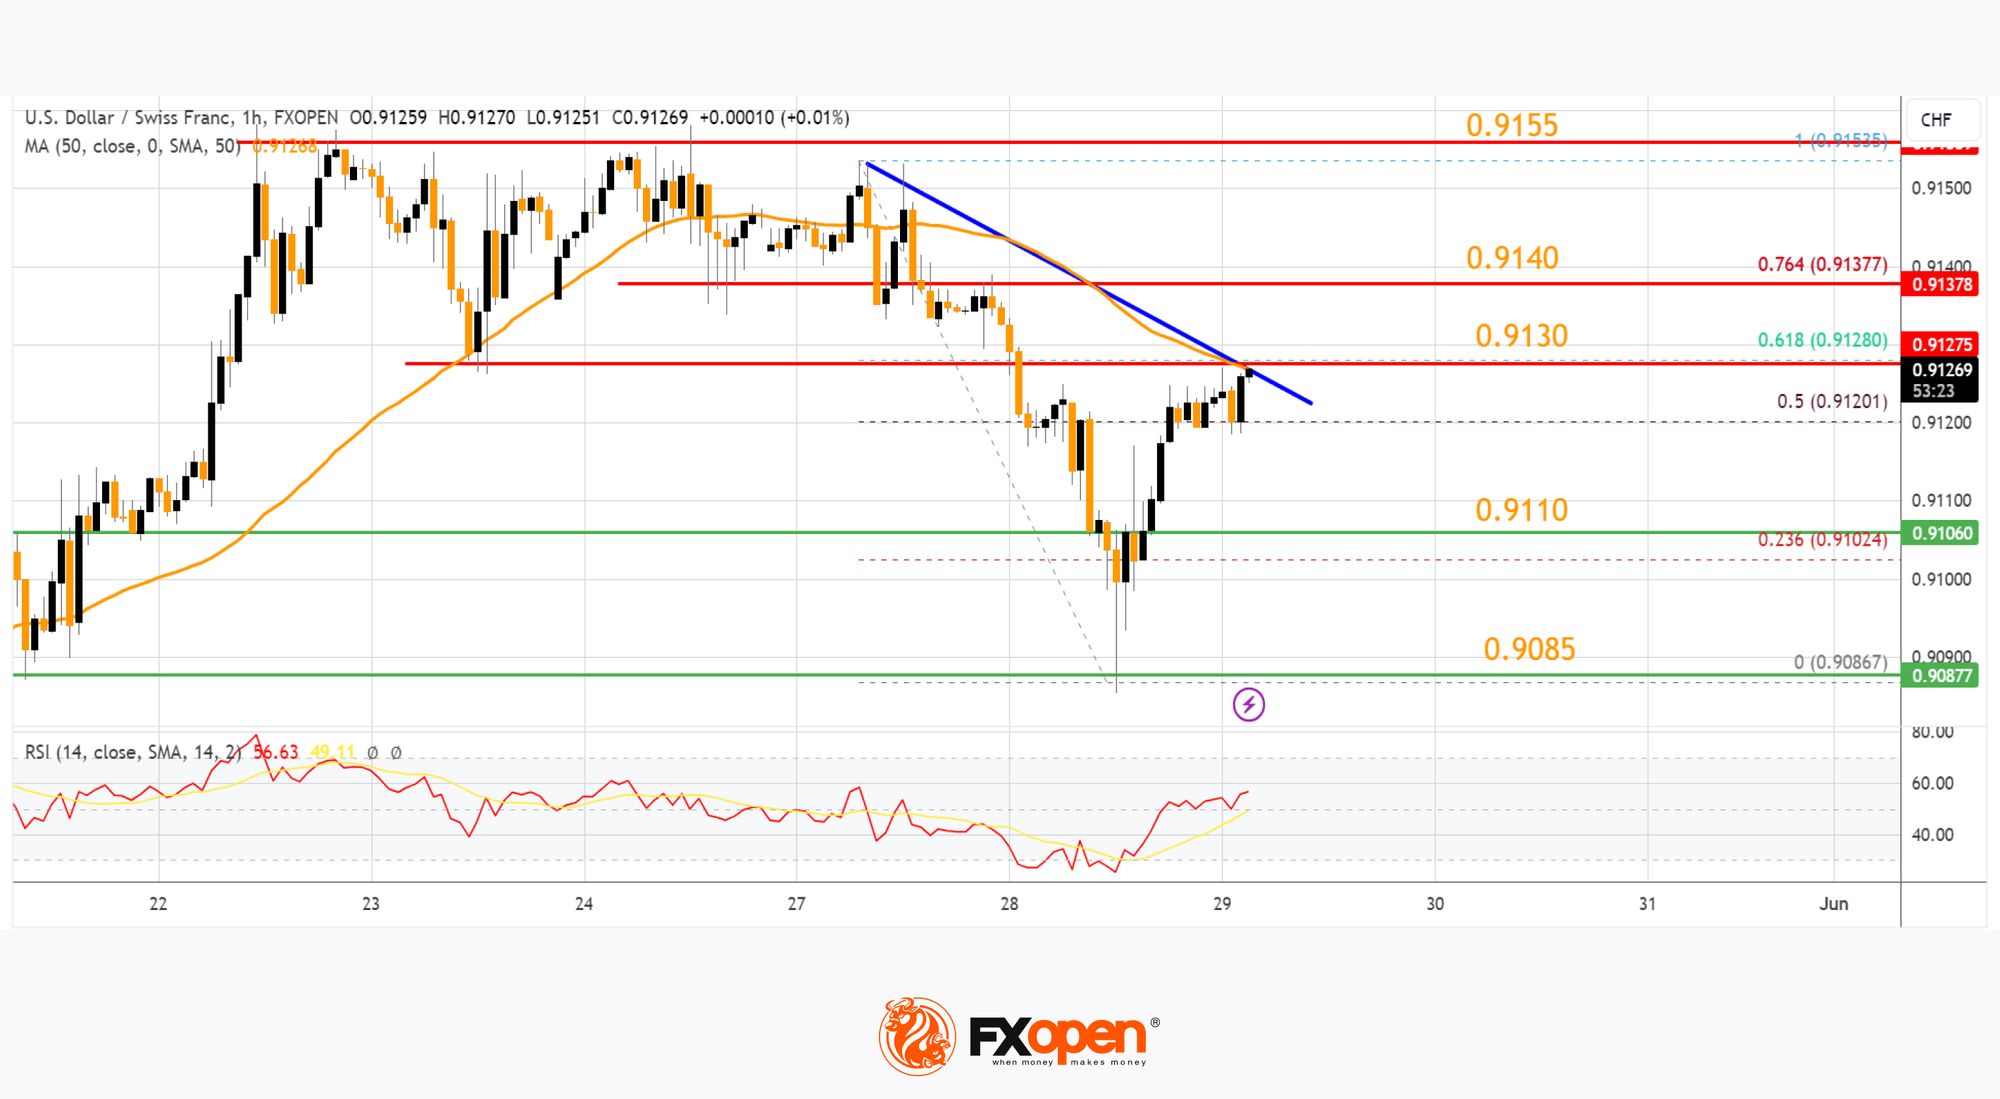
The bulls are now facing resistance near the 50-hour simple moving average and 0.9130. There is also a connecting bearish trend line forming with resistance at 0.9130 and the 61.8% Fib retracement level of the downward move from the 0.9153 swing high to the 0.9086 low. The next major resistance is at 0.9140.
The main resistance is now near 0.9155. If there is a clear break above the 0.9155 resistance zone and the RSI remains above 50, the pair could start another increase. In the stated case, it could test 0.9200.
If there is another decline, the pair might test the 0.9110 support. The first major support on the USD/CHF chart is near the 0.9085 zone. A downside break below 0.9085 might spark bearish moves. The next major support is near the 0.9040 pivot level. Any more losses may possibly open the doors for a move toward the 0.9000 level in the near term.
Trade over 50 forex markets 24 hours a day with FXOpen. Take advantage of low commissions, deep liquidity, and spreads from 0.0 pips (additional fees may apply). Open your FXOpen account now or learn more about trading forex with FXOpen.
This article represents the opinion of the Companies operating under the FXOpen brand only. It is not to be construed as an offer, solicitation, or recommendation with respect to products and services provided by the Companies operating under the FXOpen brand, nor is it to be considered financial advice.
Stay ahead of the market!
Subscribe now to our mailing list and receive the latest market news and insights delivered directly to your inbox.


Latest articles

Market Analysis: GBP/USD Dips Further As EUR/GBP Regains Traction
GBP/USD failed to climb above 1.3500 and corrected some gains. EUR/GBP started a decent increase and might aim for more gains above 0.8700.
Important Takeaways for GBP/USD and EUR/GBP Analysis Today
· The British Pound


Market Insights with Gary Thomson: Oil, US Retail Sales & NFP in Focus
In this video, we’ll explore the key economic events and market trends, shaping the financial landscape. Get ready for insights into financial markets to help you navigate the week ahead. Let’s dive in!
In this episode of Market