


FXOpen
EUR/USD started a fresh decline below the 1.0625 support. USD/CHF is also declining and struggling below the 0.9000 region.
Important Takeaways for EUR/USD and USD/CHF Analysis Today
· The Euro struggled to clear the 1.0685 resistance and declined against the US Dollar.
· There is a key bullish trend line forming with support near 1.0585 on the hourly chart of EUR/USD at FXOpen.
· USD/CHF is gaining pace below the 0.8975 support zone.
· There is a major bearish trend line forming with resistance near 0.8940 on the hourly chart at FXOpen.
EUR/USD Technical Analysis
On the hourly chart of EUR/USD at FXOpen, the pair attempted a recovery wave above the 1.0640 zone, as mentioned in the previous analysis. The Euro climbed above 1.0660 but struggled near 1.0685 against the US Dollar.
The pair started a fresh decline below the 50-hour simple moving average and 1.0625. The bears were able to push the pair toward the 1.0585 pivot level. The pair traded as low as 1.0583 and is currently showing a lot of bearish signs.
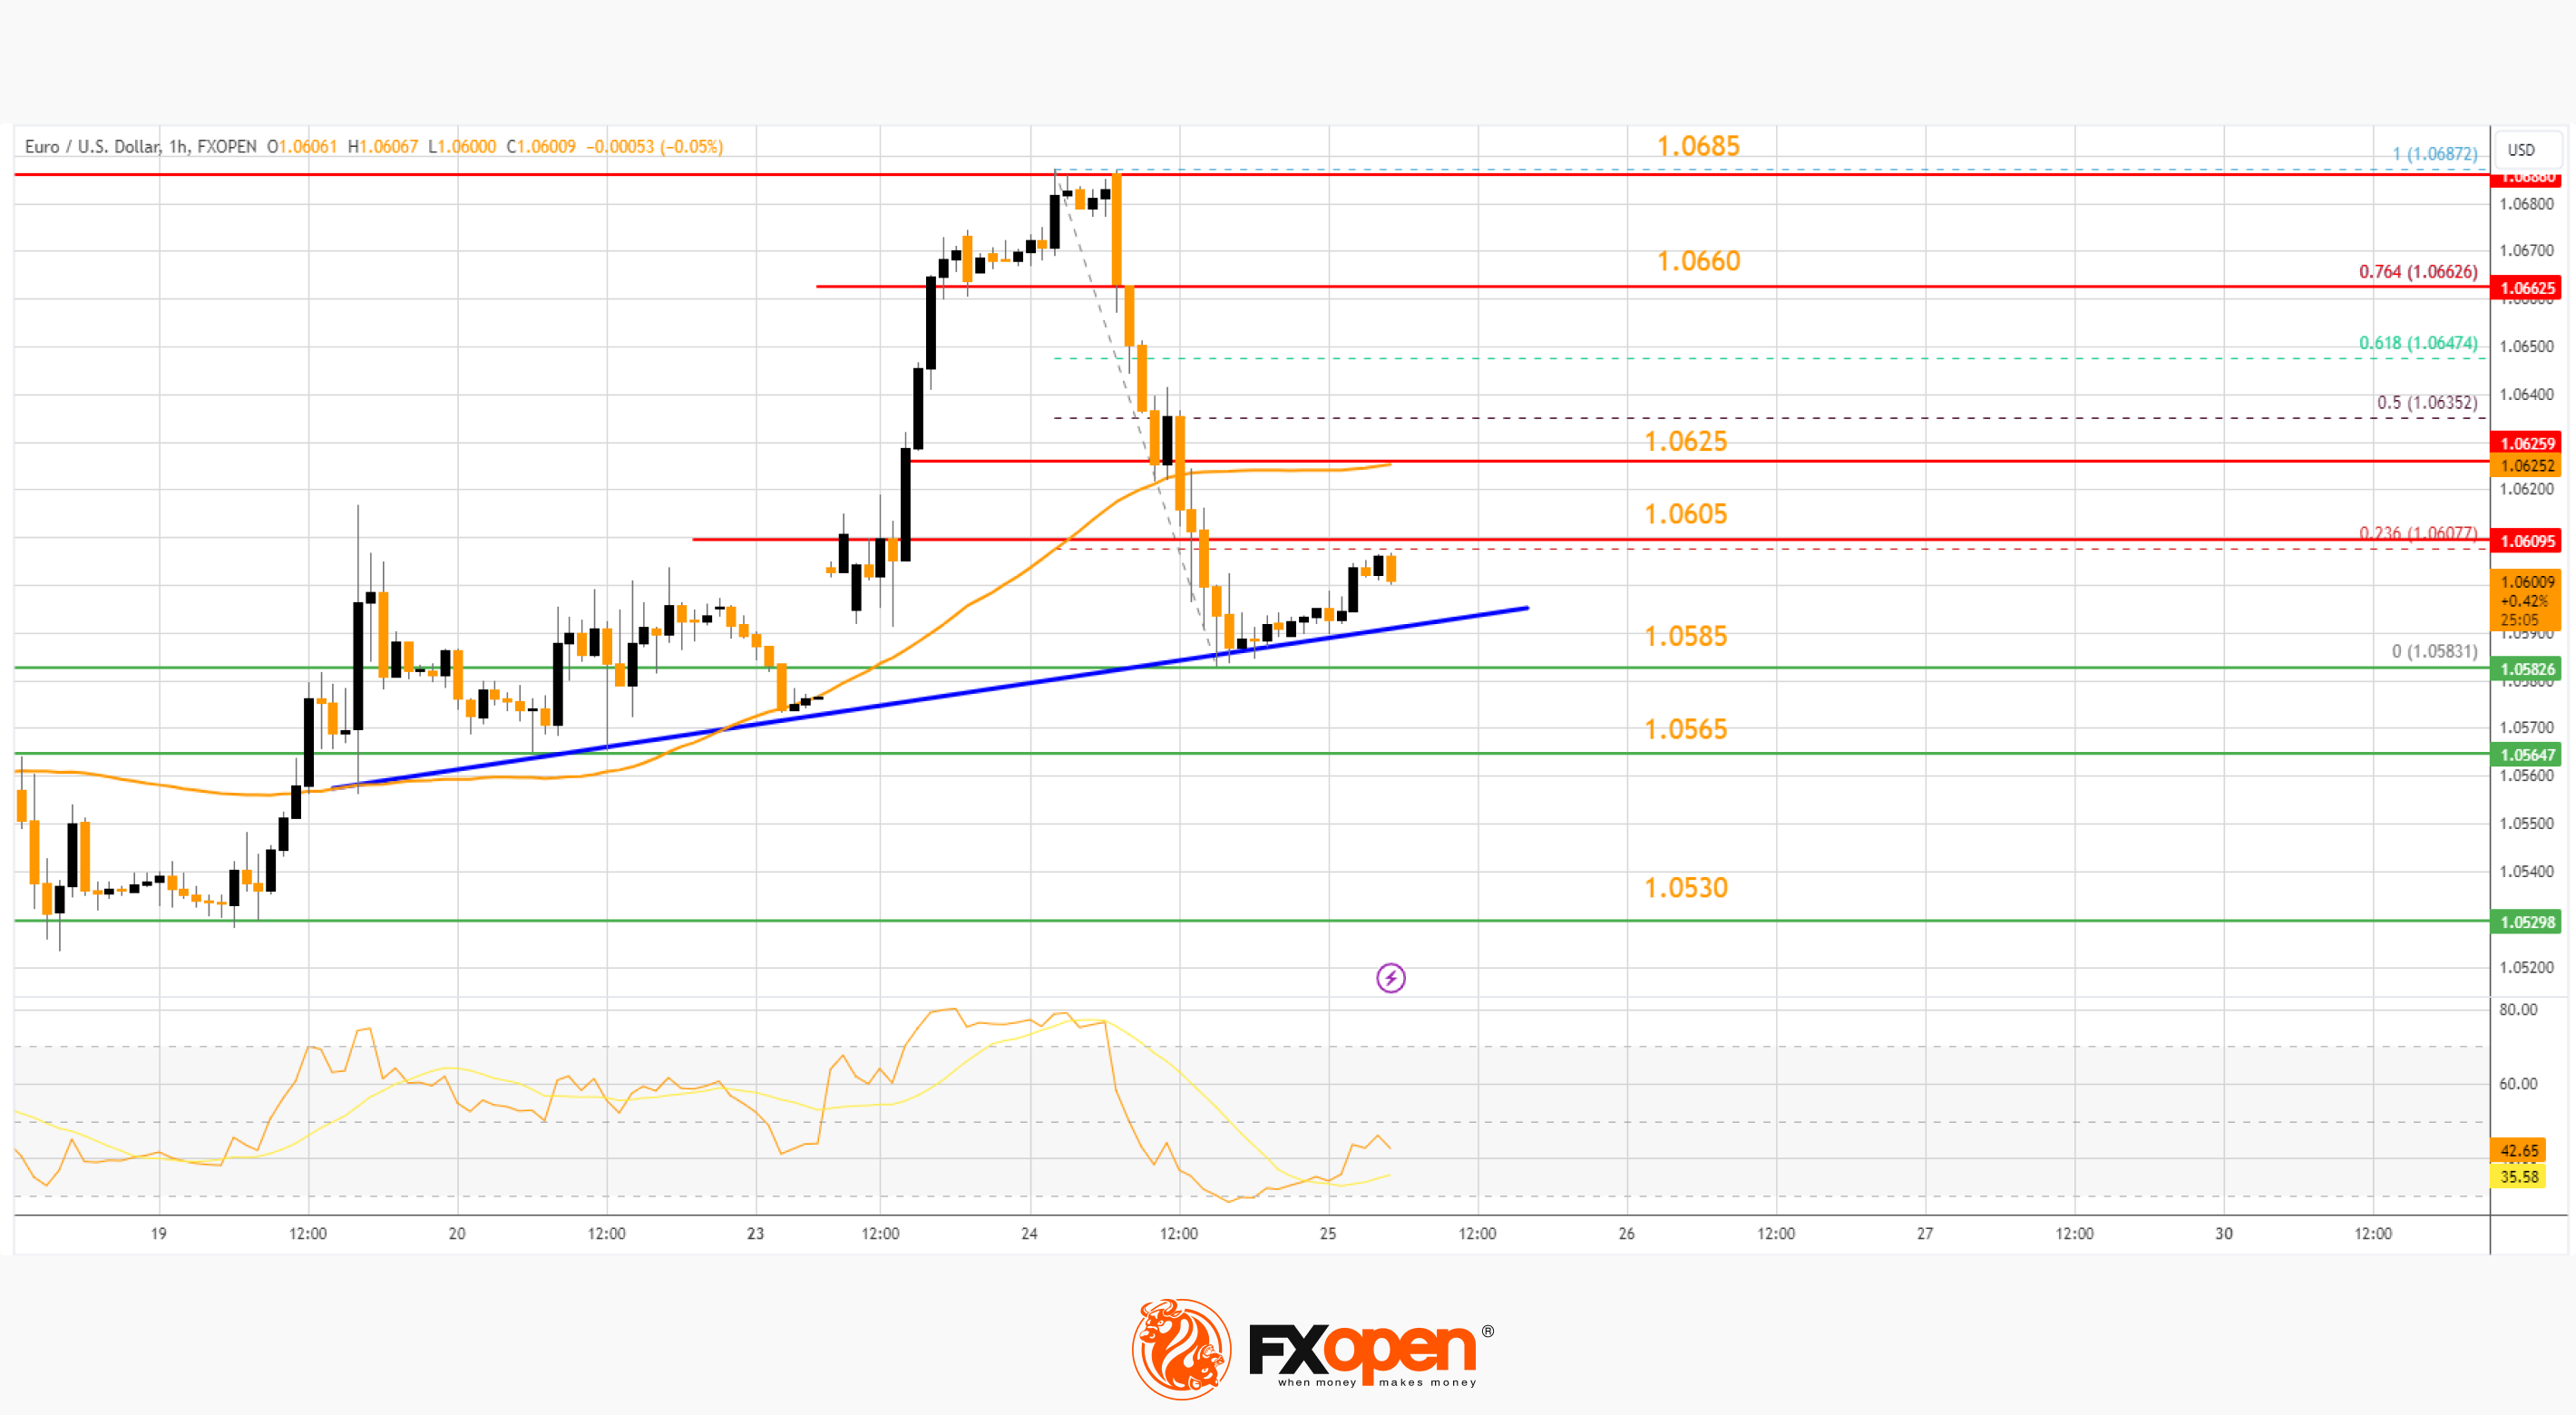
Immediate resistance on the upside is near the 23.6% Fib retracement level of the downward move from the 1.0687 swing high to the 1.0583 low.
The first major resistance is near the 50-hour simple moving average at 1.0625. An upside break above the 1.0625 level might send the pair toward the 76.4% Fib retracement level of the downward move from the 1.0687 swing high to the 1.0583 low at 1.0660.
Any more gains might open the doors for a move toward the 1.0685 level. On the downside, immediate support on the EUR/USD chart is seen near a key bullish trend line at 1.0585. The next major support is near the 1.0530 level. A downside break below the 1.0530 support could send the pair toward the 1.0500 level.
USD/CHF Technical Analysis
On the hourly chart of USD/CHF at FXOpen, the pair started a major decline from the 0.9030 resistance. The US Dollar traded below 0.8975 to move into a short-term bearish zone against the Swiss Franc.
The bears pushed the pair below the 50-hour simple moving average and 0.8940. Finally, the bulls appeared near the 0.8895 level. Recently, there was a recovery wave, but the pair failed to surpass 0.8950.
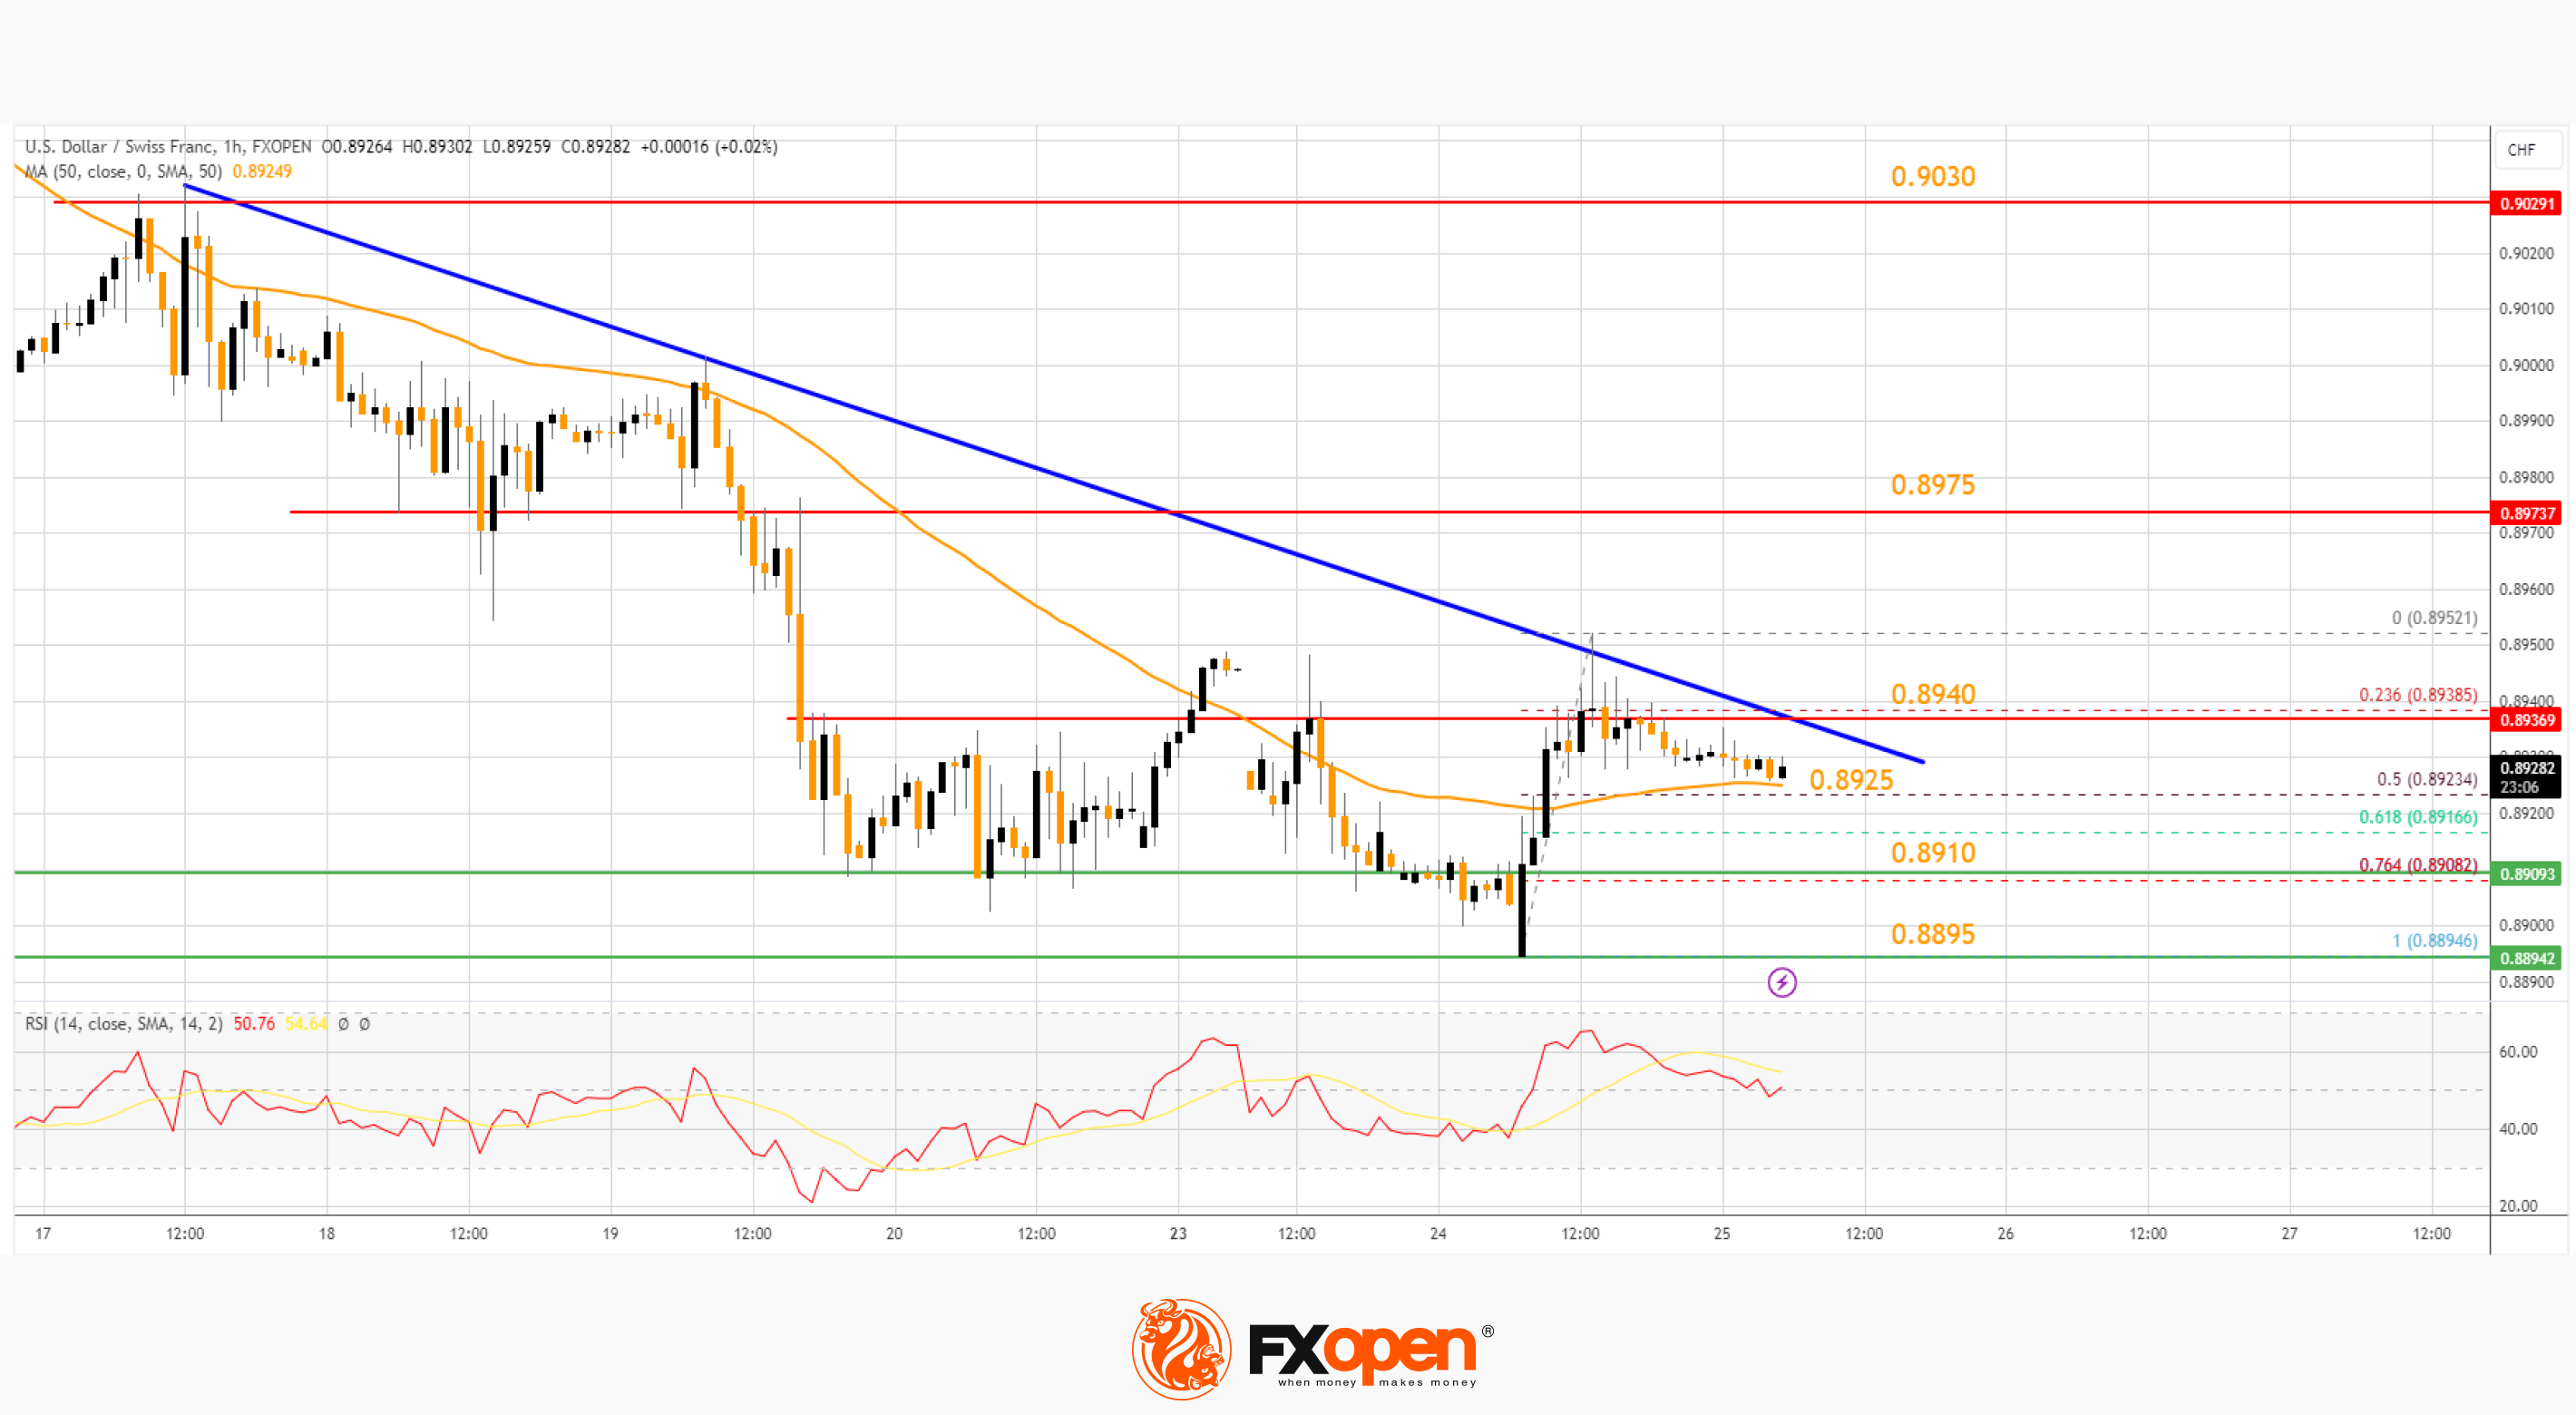
It is again moving lower and approaching the 50-hour simple moving average at 0.8925. It is close to the 50% Fib retracement level of the recovery wave from the 0.8894 swing low to the 0.8952 high.
On the upside, the pair could face resistance near a connecting bearish trend line at 0.8940. The next major resistance is near the 0.8975 level. If there is a clear break above the 0.8975 resistance zone, the pair could start another increase. In the stated case, it could even surpass 0.9030.
On the downside, immediate support on the USD/CHF chart is 0.8925. The first major support is near the 76.4% Fib retracement level of the recovery wave from the 0.8894 swing low to the 0.8952 high at 0.8910.
The next major support is near 0.8895. Any more losses may possibly open the doors for a move toward the 0.8850 level in the coming days.
Trade over 50 forex markets 24 hours a day with FXOpen. Take advantage of low commissions, deep liquidity, and spreads from 0.0 pips (additional fees may apply). Open your FXOpen account now or learn more about trading forex with FXOpen.
This article represents the opinion of the Companies operating under the FXOpen brand only. It is not to be construed as an offer, solicitation, or recommendation with respect to products and services provided by the Companies operating under the FXOpen brand, nor is it to be considered financial advice.
Stay ahead of the market!
Subscribe now to our mailing list and receive the latest market news and insights delivered directly to your inbox.


Latest articles

FX Markets Are Changing: What’s Driving Currencies Now?
FX markets have become increasingly reactive in March, with geopolitical developments—particularly the US–Iran conflict—driving price action across currencies, commodities, and interest rate expectations.
In this update, we examine the key forces shaping the FX market right now,

GBP/USD Rises Following Bank of England Decision
Yesterday, the Bank of England’s decision had a significant impact on the pound, which strengthened against other currencies. Although the Official Bank Rate remained unchanged at 3.75%, the market was surprised by the “hawkish” signals, which sharply contrasted

S&P 500 Analysis: Index Falls to Year-to-Date Low
As the S&P 500 chart (US SPX 500 mini on FXOpen) shows, the index dropped below the 6,570 level yesterday for the first time in 2026. As a result, the equity market may be on track to