


S&P 500 Analysis: Index Falls to Year-to-Date Low
FXOpen

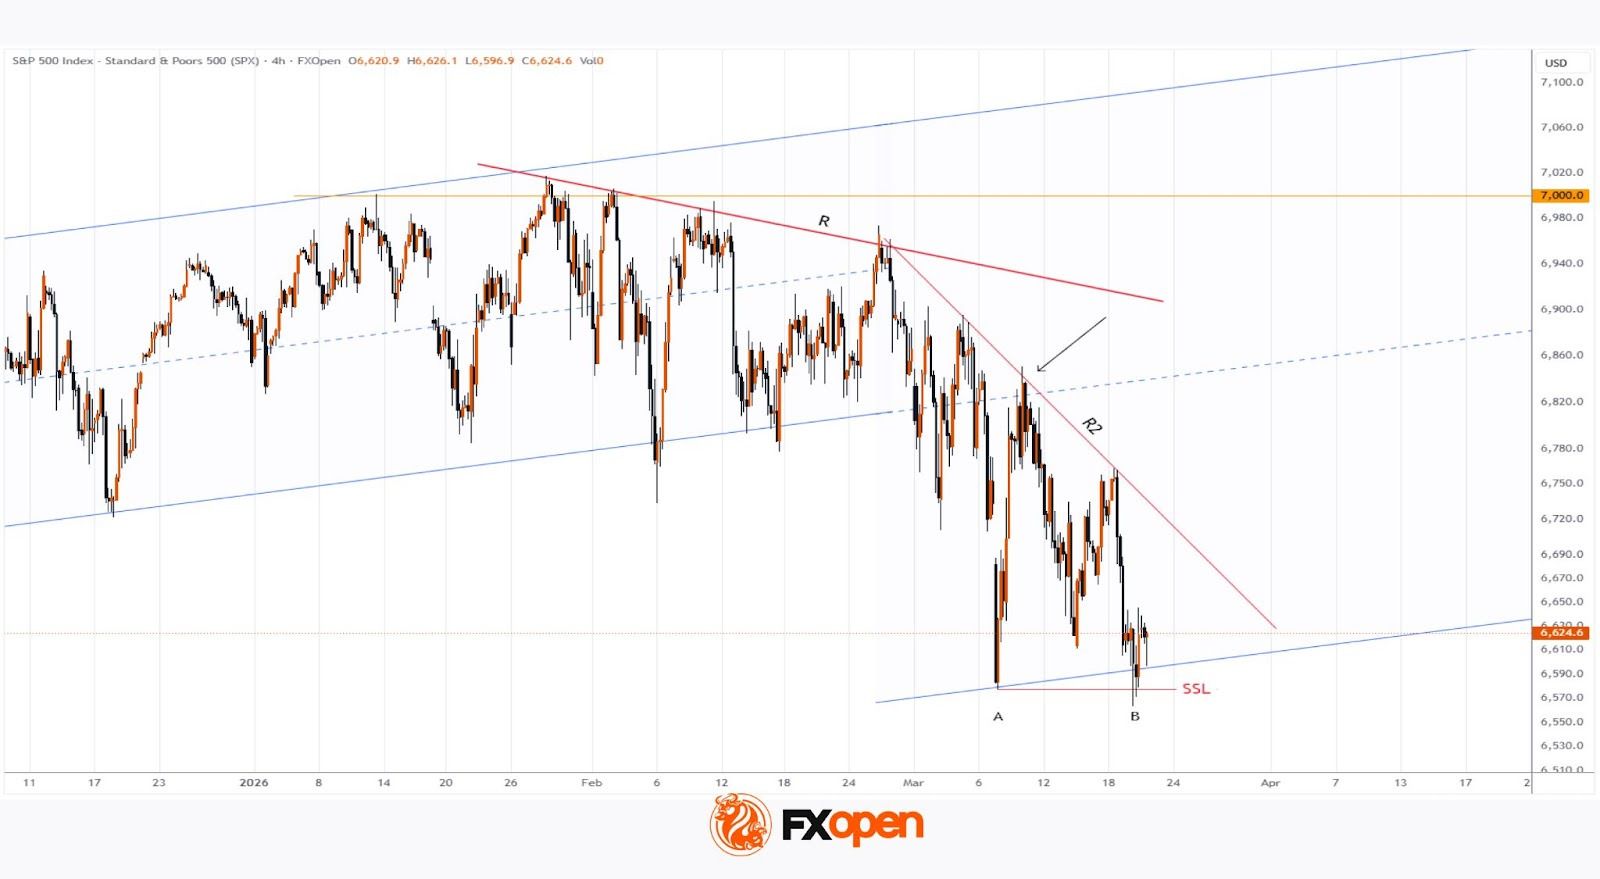
As the S&P 500 chart (US SPX 500 mini on FXOpen) shows, the index dropped below the 6,570 level yesterday for the first time in 2026. As a result, the equity market may be on track to post a fourth consecutive weekly decline, closing below its 200-day moving average.
Why Are Equities Falling?
Bearish sentiment is likely being driven by the ongoing military conflict in the Middle East:
→ Elevated oil prices are fuelling expectations of a renewed inflationary surge. This suggests the Federal Reserve will keep interest rates higher for longer (as reinforced by Powell’s remarks this week), putting pressure on both the economy and corporate performance.
→ Investors are also concerned that the United States could become drawn into a prolonged conflict with Iran, which may pose significant challenges for the country, despite efforts by officials to calm market sentiment.
According to Trading Economics:
→ US President Donald Trump stated that the US is not considering deploying ground troops to the Middle East;
→ Treasury Secretary Scott Bessent noted that the Iranian regime could face internal collapse;
→ Israeli Prime Minister Benjamin Netanyahu said Israel may refrain from further strikes on Iran’s energy infrastructure, suggesting the conflict could end sooner than expected.
Technical Analysis of the S&P 500
On 11 March, we analysed the index chart and noted that the lower boundary of the broader channel was acting as support (point A), while the median line served as resistance (as indicated by the arrow).
Since then, selling pressure has led to:
→ the formation of a steeper descending trendline (R2);
→ a move down to a new low at point B, below the previously mentioned channel boundary.
From a Smart Money Concepts perspective, it is reasonable to assume that price has entered a Sell-Side Liquidity zone. If so, traders should consider the possibility that the recent bearish breakout below the channel may prove to be false. In that case, the S&P 500 could stage a recovery in the coming sessions, potentially moving back towards the R2 trendline.
Trade global index CFDs with zero commission and tight spreads (additional fees may apply). Open your FXOpen account now or learn more about trading index CFDs with FXOpen.
This article represents the opinion of the Companies operating under the FXOpen brand only. It is not to be construed as an offer, solicitation, or recommendation with respect to products and services provided by the Companies operating under the FXOpen brand, nor is it to be considered financial advice.
Stay ahead of the market!
Subscribe now to our mailing list and receive the latest market news and insights delivered directly to your inbox.


Latest articles

Nasdaq 100: Is This the Correction Traders Have Been Waiting For?
The Nasdaq 100 (US Tech 100 Mini on FXOpen) remains caught between two opposing forces: cooling inflation on one side, and persistent geopolitical instability on the other. On 14 July, June's CPI print came in softer than expected, easing near-term

XRP/USD: Symmetrical Triangle Forms as Trading Volume Fades
On 6 July, Ripple received a full Crypto-Asset Service Provider (CASP) licence under the Markets in Crypto-Assets (MiCA) regulation from Luxembourg's financial regulator, the CSSF. The approval allows the company to offer regulated crypto payment services across all 30 countries

AI Valuations Are Back in the Spotlight
Artificial intelligence remains the dominant investment theme of 2026, but investors are increasingly questioning whether AI stock valuations are keeping pace with reality.
💰 Big Tech continues to invest at an unprecedented scale, with hyperscaler AI spending projected to exceed $800