


FXOpen

EUR/USD gained bearish momentum below the 1.0810 support. USD/JPY is rising and might take out the 157.40 resistance.
Important Takeaways for EUR/USD and USD/JPY Analysis Today
· The Euro started a fresh decline below the 1.0810 support zone.
· There is a connecting bearish trend line forming with resistance at 1.0760 on the hourly chart of EUR/USD at FXOpen.
· USD/JPY climbed higher above the 155.25 and 156.25 levels.
· There is a connecting bullish trend line forming with support at 156.85 on the hourly chart at FXOpen.
EUR/USD Technical Analysis
On the hourly chart of EUR/USD at FXOpen, the pair struggled to clear the 1.0900 resistance zone. The Euro started a fresh decline and traded below the 1.0810 support zone against the US Dollar, as mentioned in the previous analysis.
The pair even declined below 1.0760 and tested the 1.0720 zone. A low was formed near 1.0719 and the pair is now consolidating losses. On the upside, the pair is now facing resistance near the 23.6% Fib retracement level of the recent decline from the 1.0901 swing high to the 1.0719 low at 1.0760.
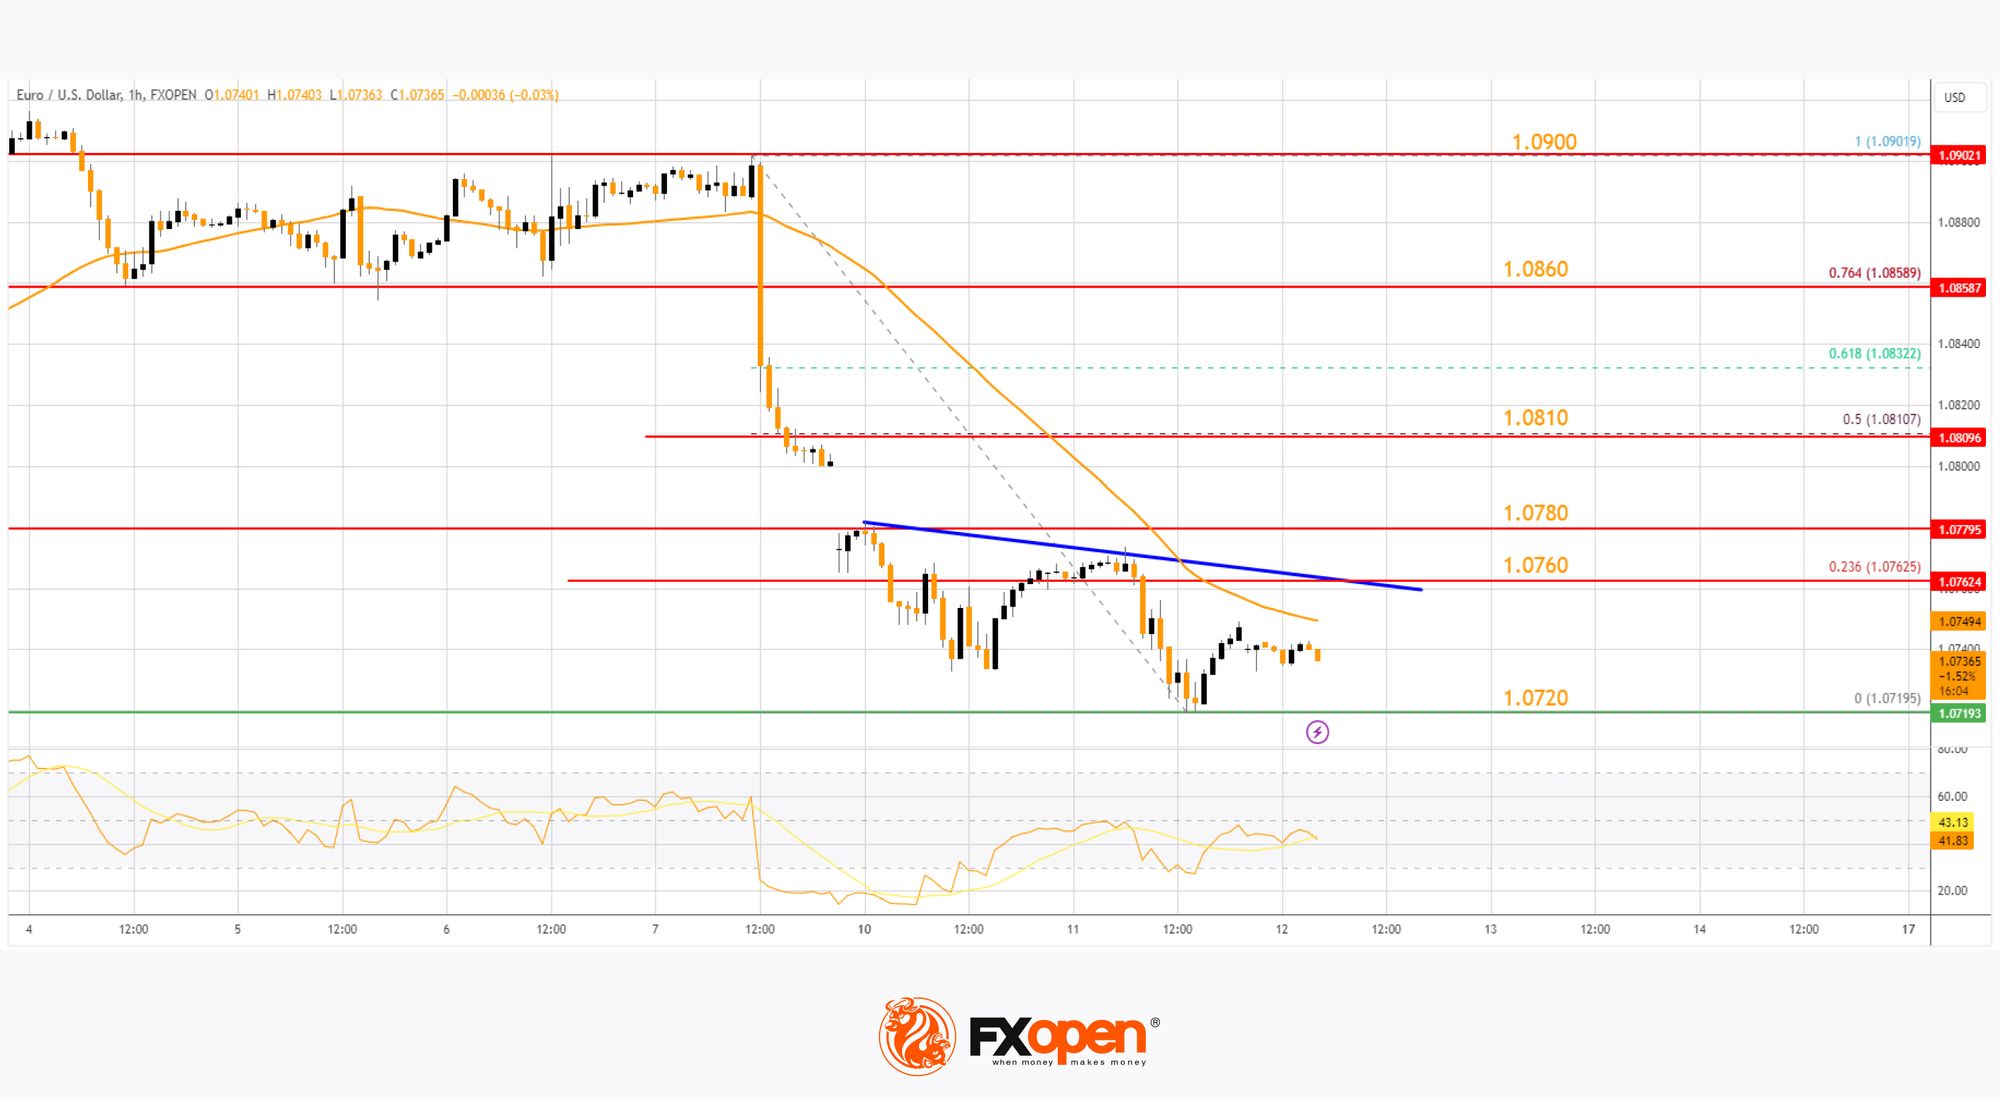
There is also a connecting bearish trend line forming with resistance at 1.0760 and the 50-hour simple moving average. The next key resistance is near the 1.0780 level.
The main resistance is 1.0810 or the 50% Fib retracement level of the recent decline from the 1.0901 swing high to the 1.0719 low. A clear move above the 1.0810 level could send the pair toward the 1.0860 resistance.
An upside break above 1.0860 could set the pace for another increase. In the stated case, the pair might rise toward 1.0900. If not, the pair might resume its decline. The first major support on the EUR/USD chart is near 1.0720.
The next key support is at 1.0680. If there is a downside break below 1.0680, the pair could drop toward 1.0650. The next support is near 1.0620, below which the pair could start a major decline.
USD/JPY Technical Analysis
On the hourly chart of USD/JPY at FXOpen, the pair started a strong increase from the 155.25 zone. The US Dollar gained bullish momentum above 156.25 against the Japanese Yen.
It even cleared the 50-hour simple moving average and 157.00. The current price action above the 157.00 level is positive. A high is formed at 157.40 and the pair might continue to rise. Immediate resistance on the USD/JPY chart is near 157.40.
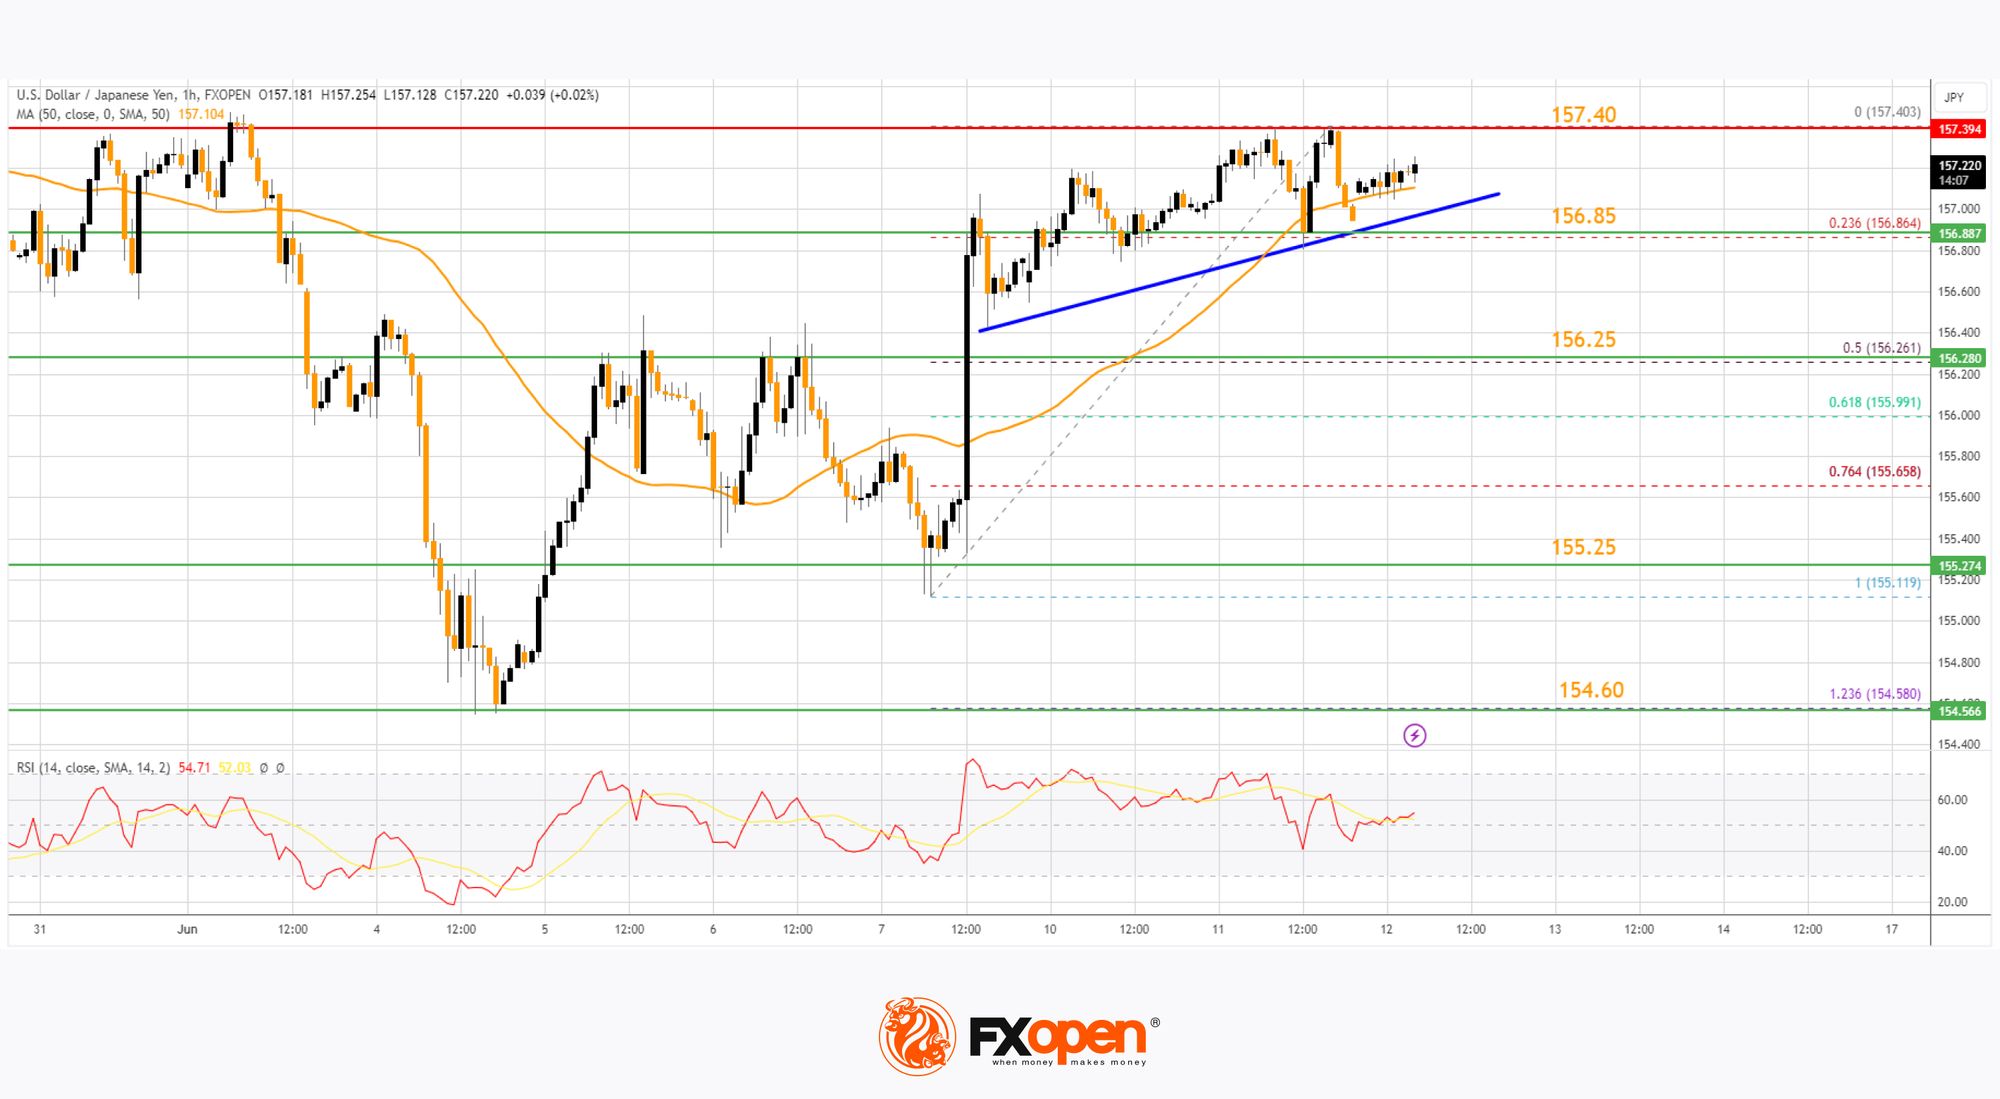
The first major resistance is near 157.80. If there is a close above the 157.80 level and the RSI moves above 60, the pair could rise toward 158.50. The next major resistance is near 159.20, above which the pair could test 160.00 in the coming days.
On the downside, the first major support is near the 23.6% Fib retracement level of the upward move from the 155.11 swing low to the 157.40 high at 156.85. There is also a connecting bullish trend line forming with support at 156.85.
The next major support is visible near the 50% Fib retracement level of the upward move from the 155.11 swing low to the 157.40 high at 156.25. If there is a close below 156.25, the pair could decline steadily.
In the stated case, the pair might drop toward the 155.25 support zone. The next stop for the bears may perhaps be near the 154.60 region.
Trade over 50 forex markets 24 hours a day with FXOpen. Take advantage of low commissions, deep liquidity, and spreads from 0.0 pips (additional fees may apply). Open your FXOpen account now or learn more about trading forex with FXOpen.
This article represents the opinion of the Companies operating under the FXOpen brand only. It is not to be construed as an offer, solicitation, or recommendation with respect to products and services provided by the Companies operating under the FXOpen brand, nor is it to be considered financial advice.
Stay ahead of the market!
Subscribe now to our mailing list and receive the latest market news and insights delivered directly to your inbox.


Latest articles

European Currencies Decline: Pound Hits New Lows, Euro Under Pressure
European currencies continue to weaken against the US dollar amid rising geopolitical tensions and increased demand for safe-haven and liquid assets. Market participants are reducing exposure to riskier instruments, putting pressure on both the euro and the pound. Additional support

Market Analysis: GBP/USD Dips Further As EUR/GBP Regains Traction
GBP/USD failed to climb above 1.3500 and corrected some gains. EUR/GBP started a decent increase and might aim for more gains above 0.8700.
Important Takeaways for GBP/USD and EUR/GBP Analysis Today
· The British Pound
