


FXOpen

GBP/USD failed to climb above 1.2860 and trimmed all gains. EUR/GBP is declining and trading below the 0.8410 support level.
Important Takeaways for GBP/USD and EUR/GBP Analysis Today
· The British Pound is showing bearish signs below 1.2800.
· There is a key bearish trend line forming with resistance near 1.2765 on the hourly chart of GBP/USD at FXOpen.
· EUR/GBP is declining and showing bearish signs below 0.8460.
· There is a major declining channel forming with support at 0.8410 on the hourly chart at FXOpen.
GBP/USD Technical Analysis
On the hourly chart of GBP/USD at FXOpen, the pair started a fresh decline from the 1.2860 zone. As mentioned in the previous analysis, the British Pound struggled to extend gains and declined below the 1.2800 support level against the US Dollar.
There was a clear move below the 61.8% Fib retracement level of the upward move from the 1.2706 swing low to the 1.2860 high. The pair even settled below the 1.2765 level and the 50-hour simple moving average.
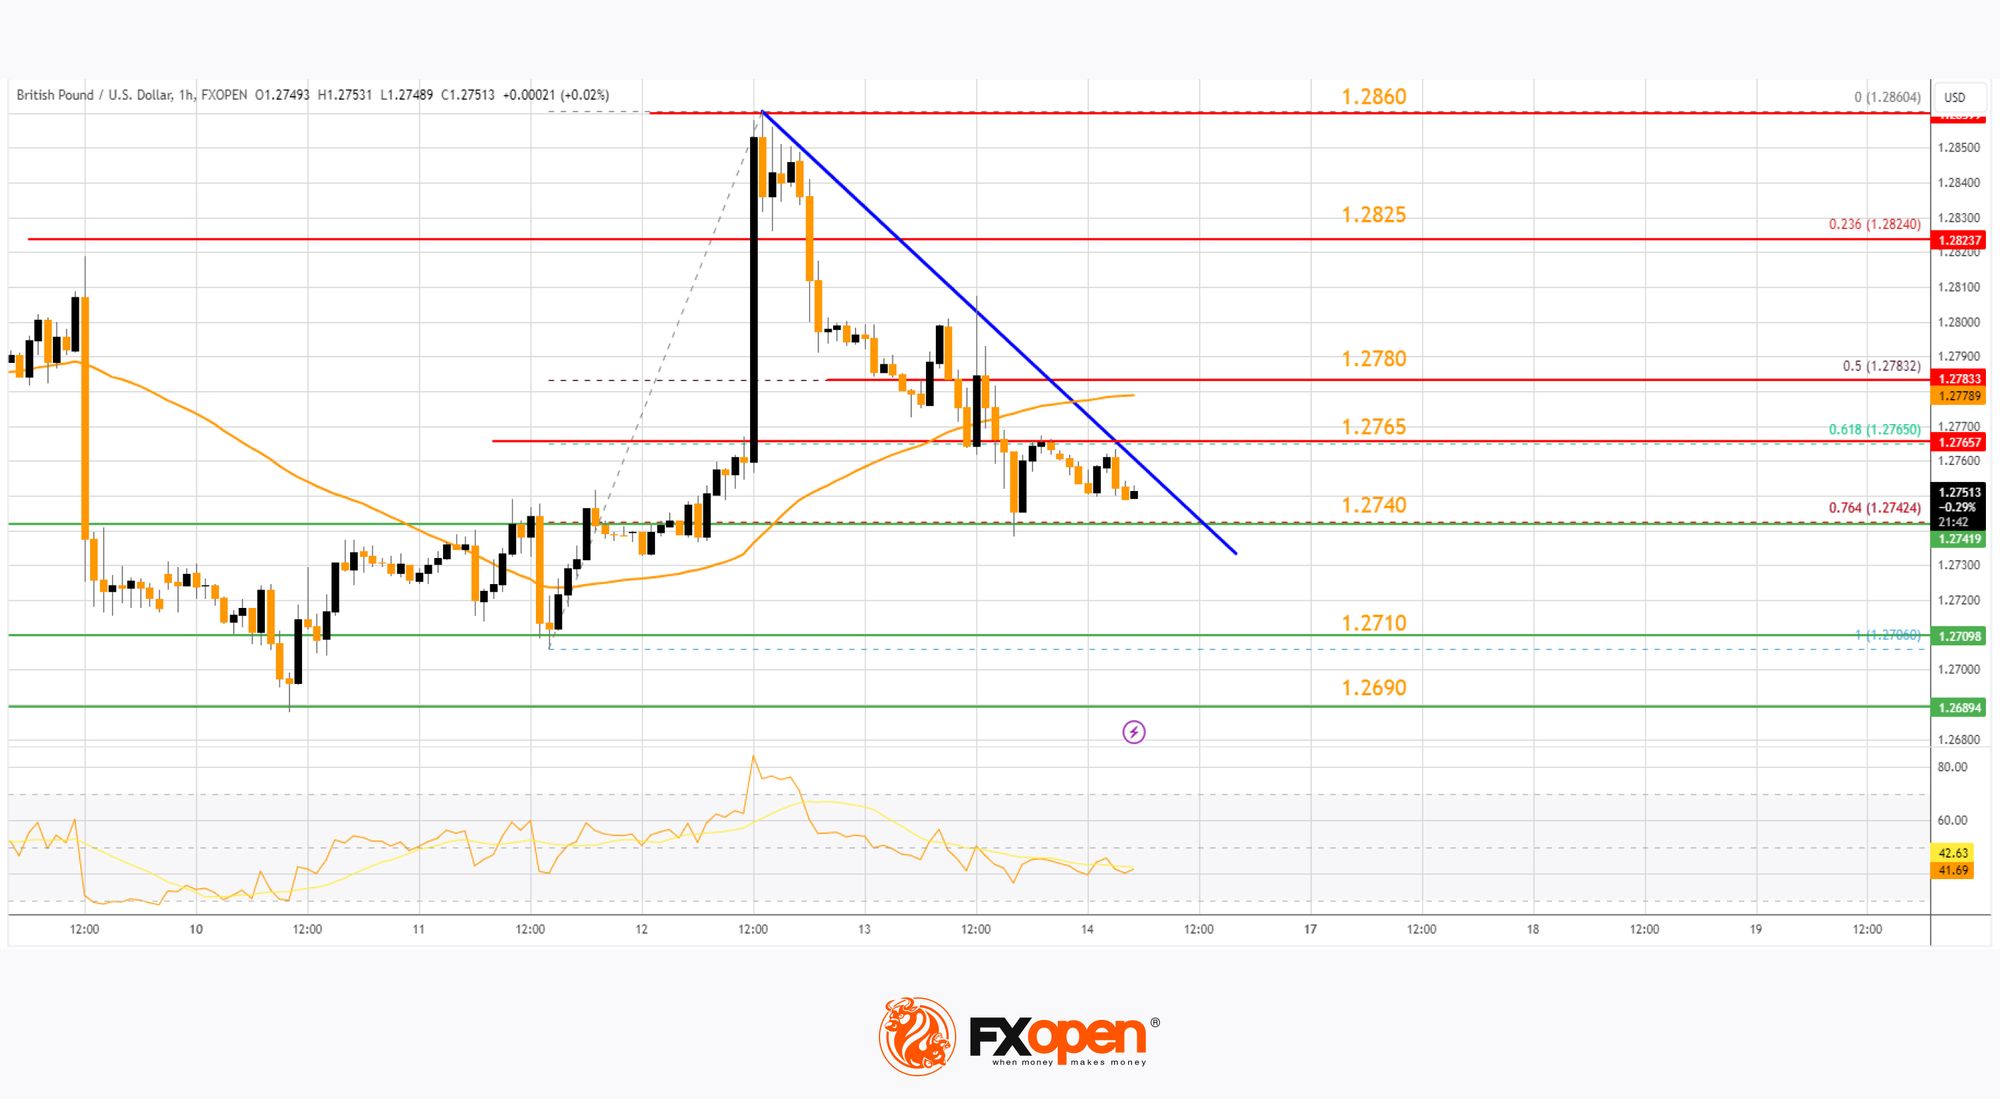
The pair tested the 1.2740 support zone and the 76.4% Fib retracement level of the upward move from the 1.2706 swing low to the 1.2860 high.
It is now consolidating losses above the 1.2740 level. On the upside, the GBP/USD chart indicates that the pair is facing resistance near 1.2765 and a connecting bearish trend line. The next major resistance is near the 50-hour simple moving average at 1.2780.
A close above the 1.2780 resistance zone could open the doors for a move toward 1.2825. Any more gains might send it toward 1.2860. If not, the pair could resume its decline below 1.2740. On the downside, there is a key support forming near 1.2710.
If there is a downside break below the 1.2710 support, the pair could accelerate lower. The next major support is near the 1.2690 zone, below which the pair could test 1.2650. Any more losses could lead the pair toward the 1.2550 support.
EUR/GBP Technical Analysis
On the hourly chart of EUR/GBP at FXOpen, the pair struggled to gain pace for a move above 0.8520. The Euro settled below 0.8490 and started a fresh decline against the British Pound.
There was a clear move below the 0.8470 pivot level. The EUR/GBP chart suggests that the pair settled below the 50-hour simple moving average and 0.8460. A low is formed near 0.8412 and the pair is now consolidating losses.
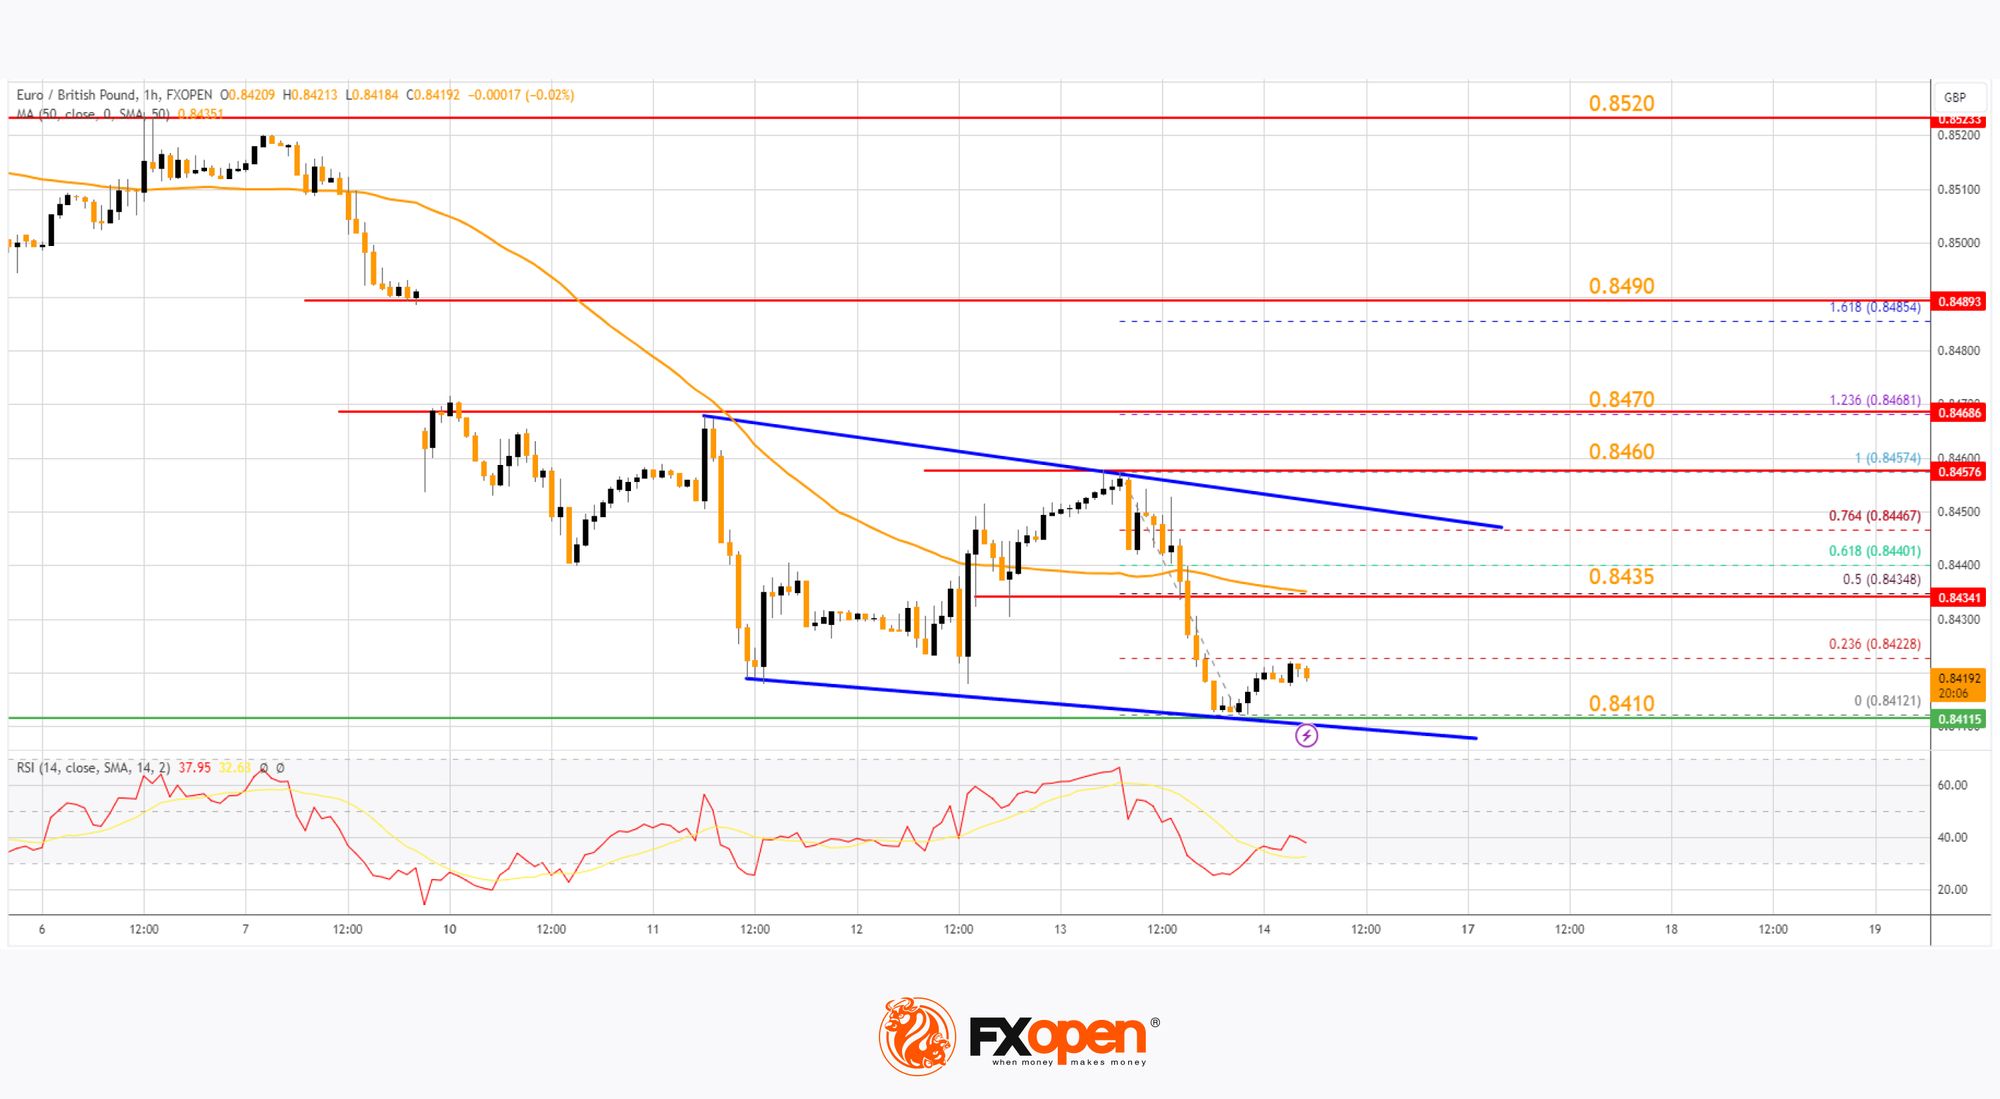
Immediate resistance is near the 50% Fib retracement level of the downward move from the 0.8457 swing high to the 0.8412 low at 0.8435 and the 50-hour simple moving average.
The next major resistance could be near the 76.4% Fib retracement level of the downward move from the 0.8457 swing high to the 0.8412 low at 0.8445. A close above the 0.8445 level might accelerate gains. In the stated case, the bulls may perhaps aim for a test of 0.8470. Any more gains might send the pair toward the 0.8490 level.
Immediate support sits near 0.8410. There is also a major declining channel forming with support at 0.8410. The next major support is near 0.8380. A downside break below the 0.8380 support might call for more downsides. In the stated case, the pair could drop toward the 0.8350 support level.
Read analytical EUR/GBP price forecasts for 2024 and beyond.
Trade over 50 forex markets 24 hours a day with FXOpen. Take advantage of low commissions, deep liquidity, and spreads from 0.0 pips (additional fees may apply). Open your FXOpen account now or learn more about trading forex with FXOpen.
This article represents the opinion of the Companies operating under the FXOpen brand only. It is not to be construed as an offer, solicitation, or recommendation with respect to products and services provided by the Companies operating under the FXOpen brand, nor is it to be considered financial advice.
Stay ahead of the market!
Subscribe now to our mailing list and receive the latest market news and insights delivered directly to your inbox.


Latest articles

Market Analysis: GBP/USD Dips Further As EUR/GBP Regains Traction
GBP/USD failed to climb above 1.3500 and corrected some gains. EUR/GBP started a decent increase and might aim for more gains above 0.8700.
Important Takeaways for GBP/USD and EUR/GBP Analysis Today
· The British Pound


Market Insights with Gary Thomson: Oil, US Retail Sales & NFP in Focus
In this video, we’ll explore the key economic events and market trends, shaping the financial landscape. Get ready for insights into financial markets to help you navigate the week ahead. Let’s dive in!
In this episode of Market