


Market Analysis: GBP/USD and EUR/GBP Show Signs of Weakness
FXOpen

GBP/USD failed to climb above 1.2750 and trimmed all gains. EUR/GBP is declining and trading below the 0.8580 pivot level.
Important Takeaways for GBP/USD and EUR/GBP Analysis Today
· The British Pound is attempting a fresh increase from 1.2580.
· There is a key bearish trend line forming with resistance near 1.2655 on the hourly chart of GBP/USD at FXOpen.
· EUR/GBP is declining and showing bearish signs below 0.8580.
· There is a major bearish trend line forming with resistance near 0.8560 on the hourly chart at FXOpen.
GBP/USD Technical Analysis
On the hourly chart of GBP/USD at FXOpen, the pair started a fresh decline from the 1.2745 zone. As mentioned in the previous analysis, the British Pound struggled to recover and declined below the 1.2655 support level against the US Dollar.
The pair even tested the 1.2580 support zone. A low was formed near 1.2577 and the pair is now attempting a fresh increase. There was a move above the 1.2600 zone and it is now testing the 23.6% Fib retracement level of the downward move from the 1.2702 swing high to the 1.2577 low.
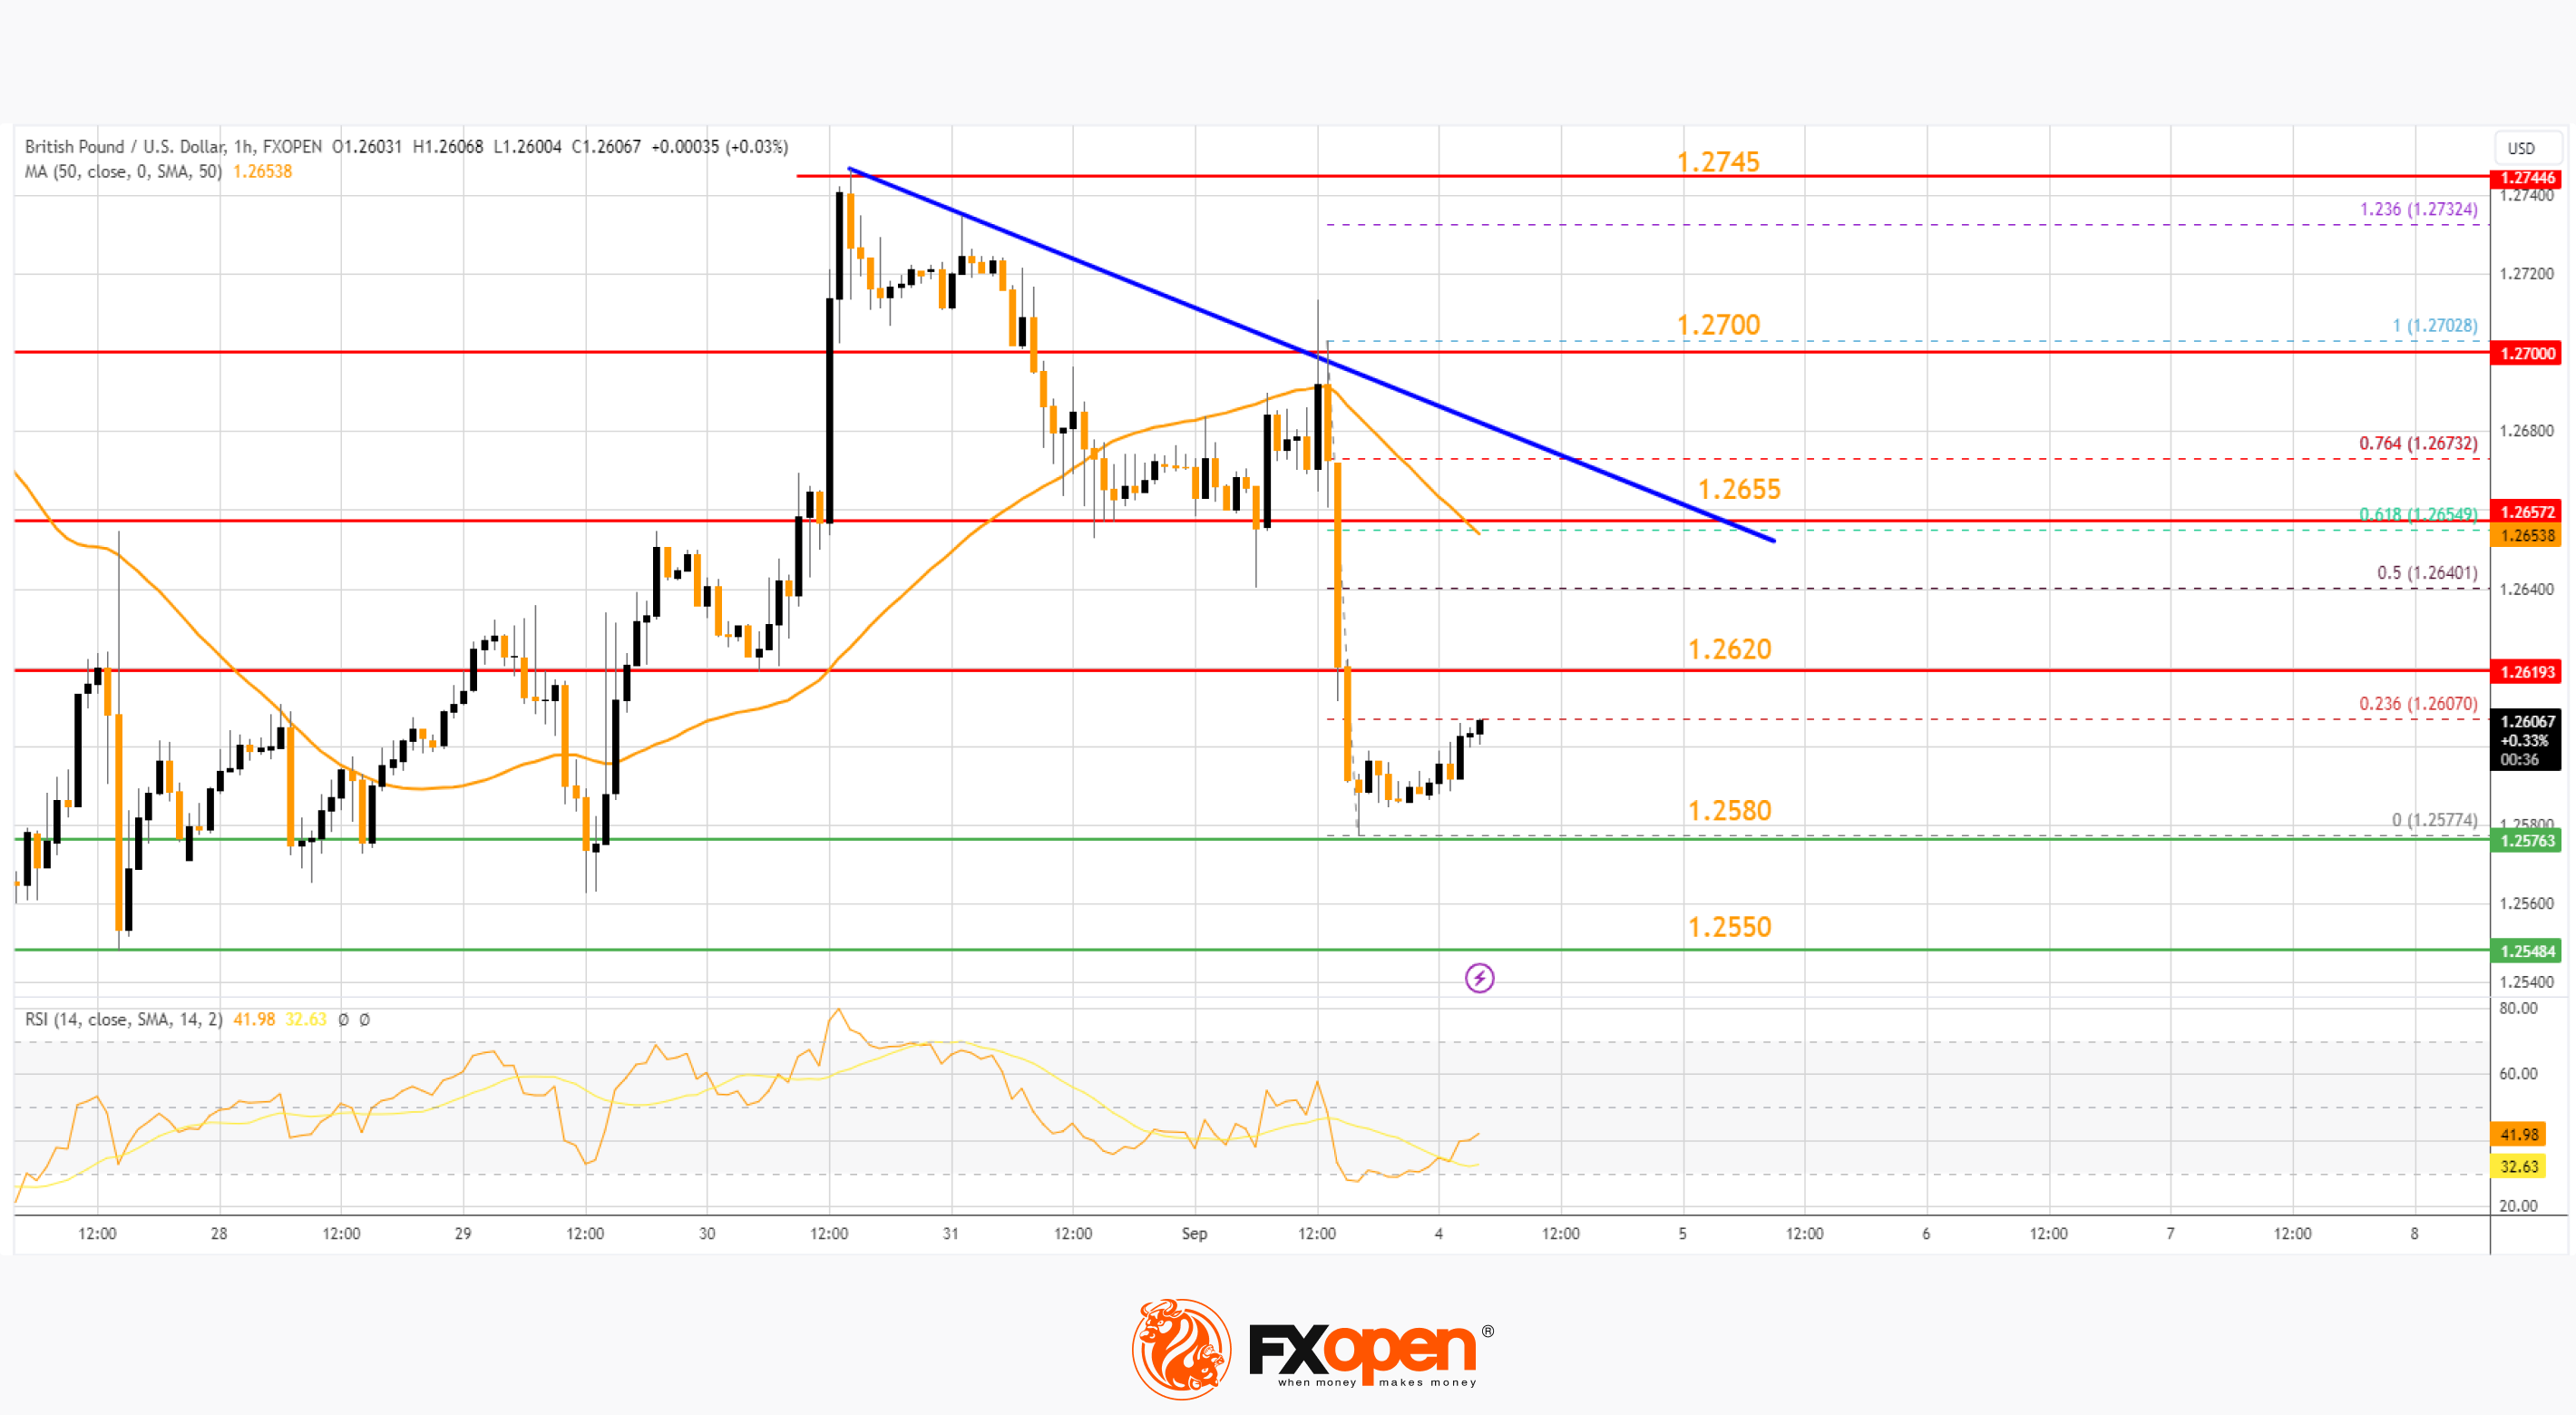
On the upside, the GBP/USD chart indicates that the pair is facing resistance near 1.2620. The next major resistance is near a bearish trend line at 1.2655 and the 50-hour simple moving average.
The trend line is close to the 61.8% Fib retracement level of the downward move from the 1.2702 swing high to the 1.2577 low. A close above the 1.2655 resistance zone could open the doors for a move toward 1.2700.
Any more gains might send it toward 1.2745. If not, the pair could resume its decline below 1.2600. On the downside, there is a key support forming near 1.2580.
If there is a downside break below the 1.2580 support, the pair could accelerate lower. The next major support is near the 1.2550 zone, below which the pair could test 1.2500. Any more losses could lead the pair toward the 1.2450 support.
EUR/GBP Technical Analysis
On the hourly chart of EUR/GBP at FXOpen, the pair struggled to gain pace for a move above 0.8600. The Euro traded formed a top near 0.8610 and started a fresh decline against the British Pound.
There was a clear move below the 0.8580 pivot level. The EUR/GBP chart suggests that the pair settled below the 50-hour simple moving average and 0.8560. A low is formed near 0.8547 and the pair is now consolidating losses.
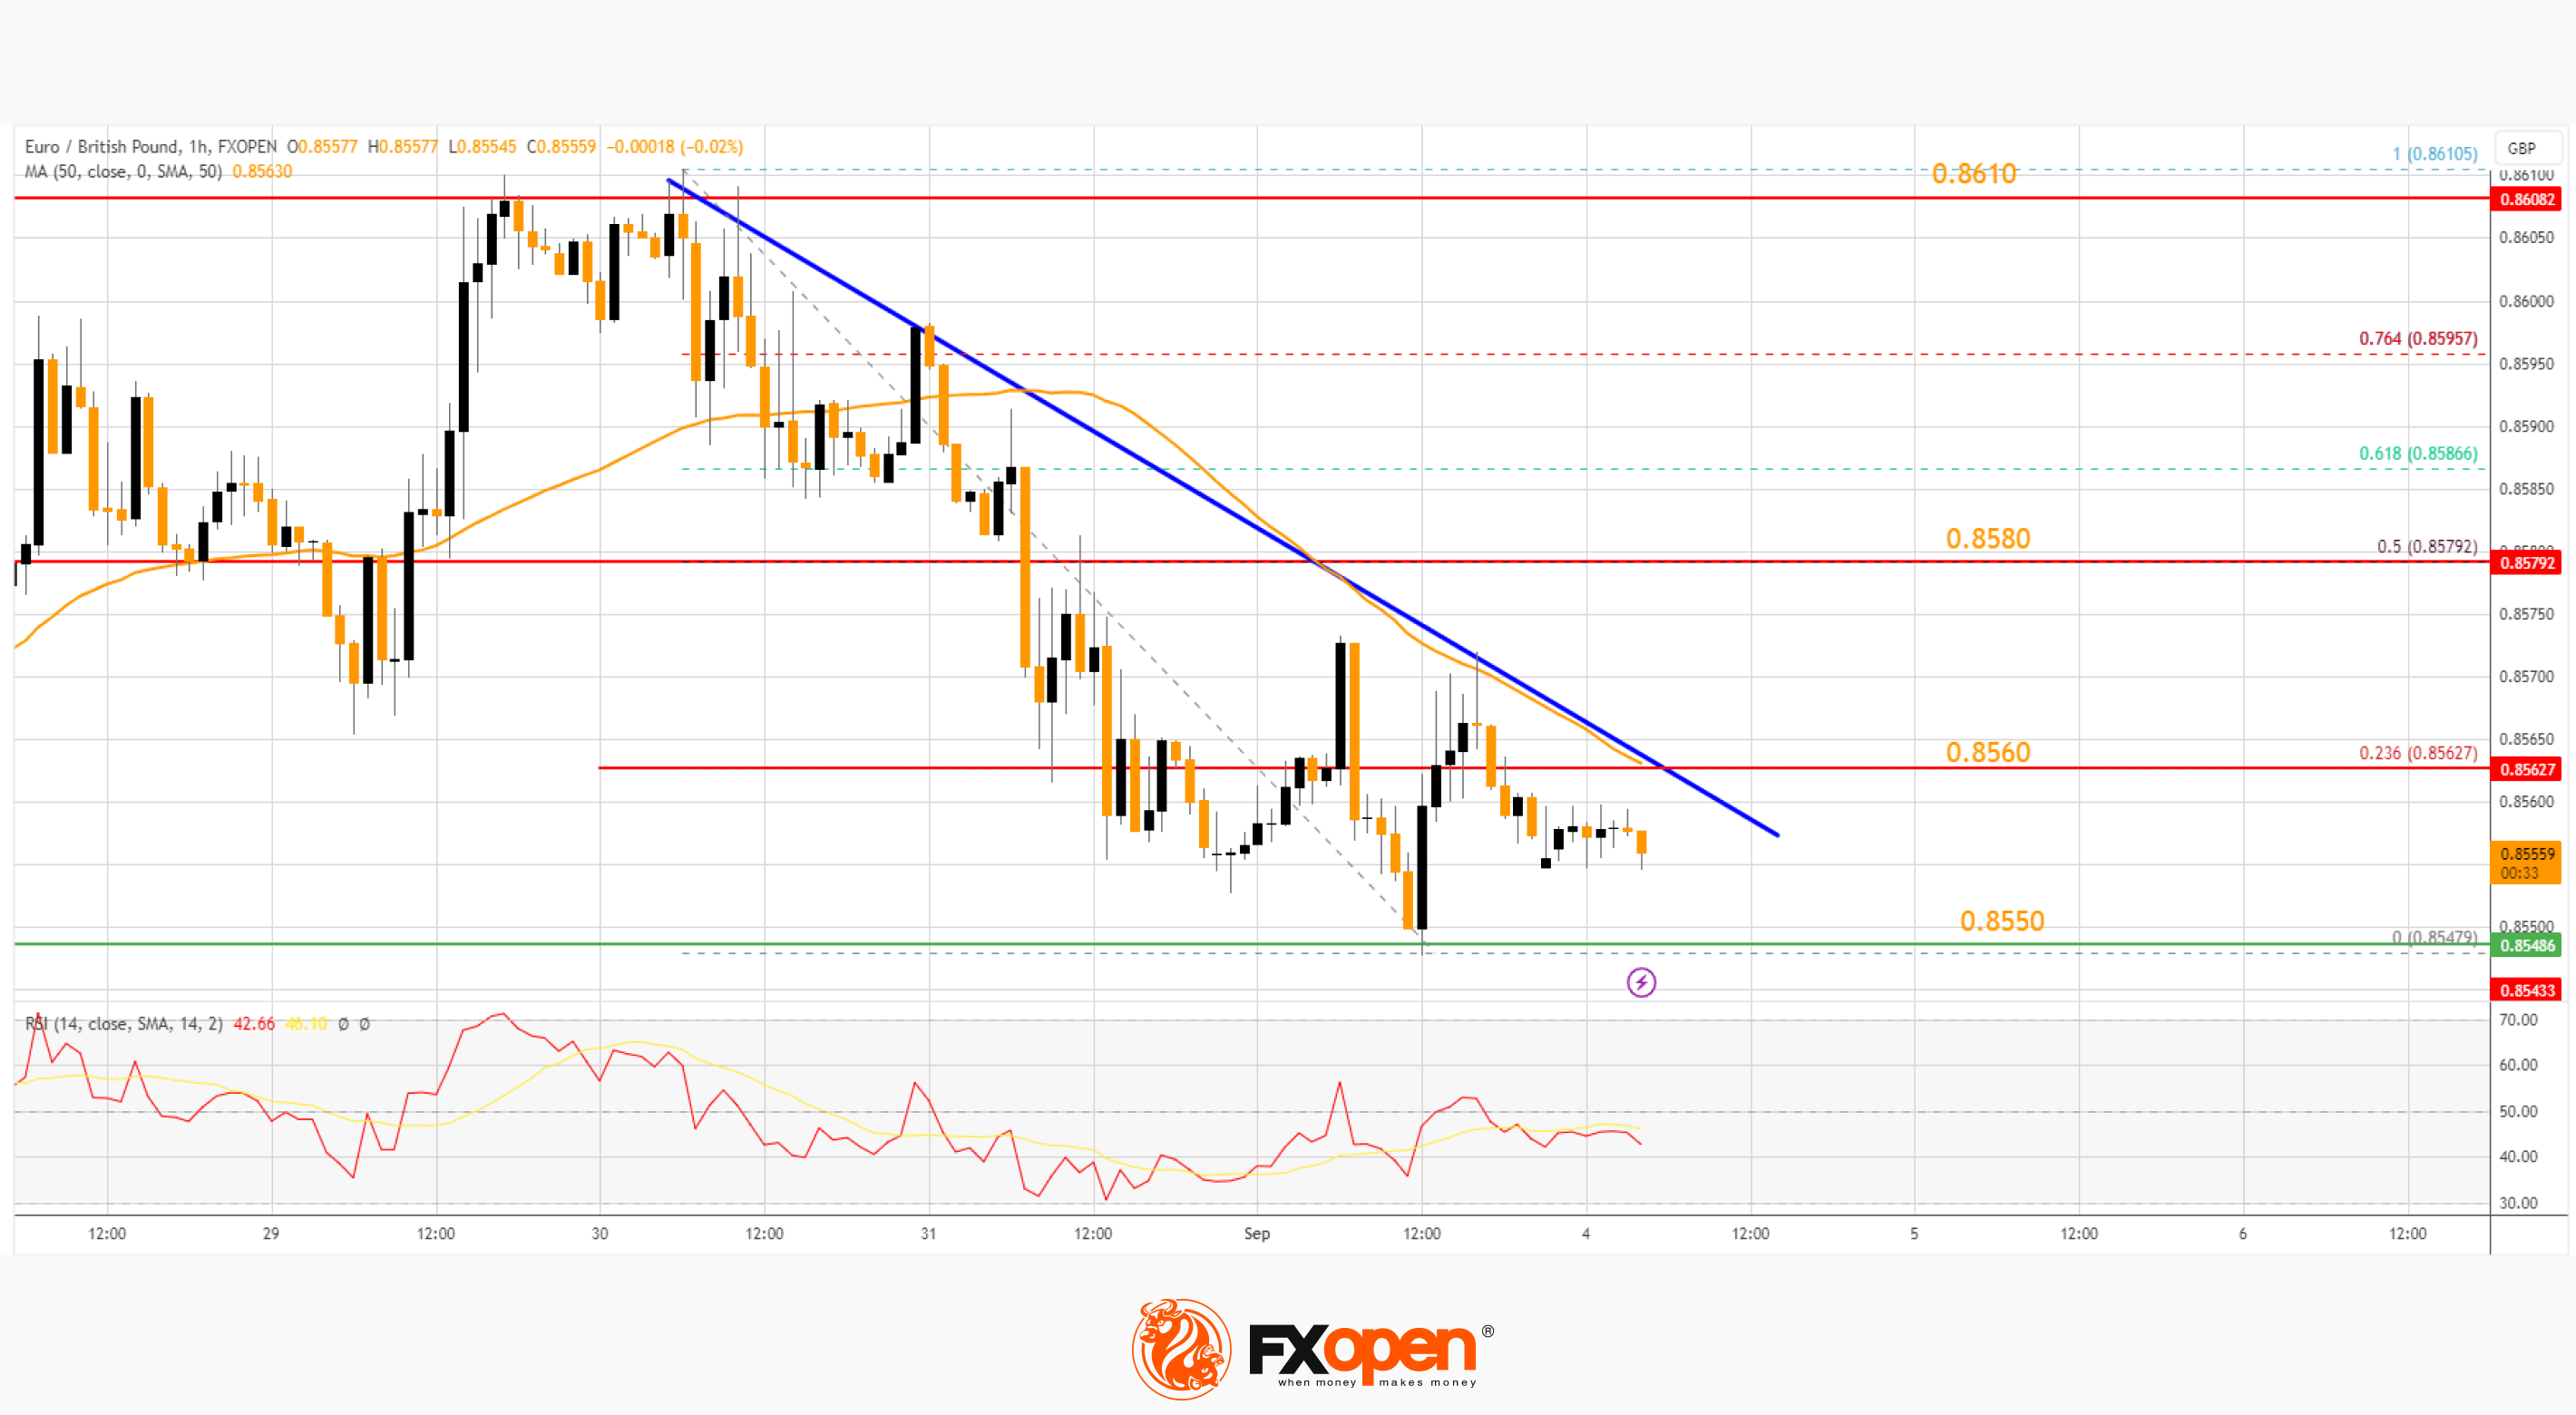
Immediate resistance is near a major bearish trend line at 0.8560. It coincides with the 50-hour simple moving average and the 23.6% Fib retracement level of the downward move from the 0.8610 swing high to the 0.8547 low.
The next major resistance could be near the 50% Fib retracement level of the downward move from the 0.8610 swing high to the 0.8547 low at 0.8580.
A close above the 0.8580 level might accelerate gains. In the stated case, the bulls may perhaps aim for a test of 0.8600. Any more gains might send the pair toward the 0.8650 level.
Immediate support sits near 0.8550. The next major support is near 0.8525. A downside break below the 0.8525 support might call for more downsides. In the stated case, the pair could drop toward the 0.8465 support level.
Trade over 50 forex markets 24 hours a day with FXOpen. Take advantage of low commissions, deep liquidity, and spreads from 0.0 pips (additional fees may apply). Open your FXOpen account now or learn more about trading forex with FXOpen.
This article represents the opinion of the Companies operating under the FXOpen brand only. It is not to be construed as an offer, solicitation, or recommendation with respect to products and services provided by the Companies operating under the FXOpen brand, nor is it to be considered financial advice.
Stay ahead of the market!
Subscribe now to our mailing list and receive the latest market news and insights delivered directly to your inbox.


Latest articles

Pound Weakens After Soft UK Inflation Data as Euro Awaits Fresh Market Signals
The pound remains under pressure following the release of weaker-than-expected UK inflation data. The slowdown in inflation has strengthened expectations that the Bank of England could adopt a more accommodative policy stance in the coming months, weighing on sterling. Meanwhile,

Alphabet: Record Profit as Markets Await Their Verdict
On 22 July, Alphabet reported its Q2 2026 results, with revenue rising 24% year-on-year to $119.8 billion. Google Cloud revenue surged 82% to $24.77 billion, comfortably exceeding analysts' expectations. Search advertising generated $63.3 billion in revenue (+17%

NZD/USD Analysis: A Tug-of-War at the Critical Level
The kiwi has strengthened meaningfully against most peers this month. However, against the US dollar specifically, NZD/USD remains well below its 2026 highs, trading in the mid-0.58 area versus January's peak near 0.6075.
New Zealand's Q2 inflation