


Market Analysis: GBP/USD Attempts Recovery, USD/CAD Maintains Bullish Strength
FXOpen

GBP/USD is attempting a recovery wave from 1.3035. USD/CAD is showing positive signs and might aim for more gains above 1.4130.
Important Takeaways for GBP/USD and USD/CAD Analysis Today
- The British Pound started a recovery wave above 1.3050 and 1.3080.
- There is a key bearish trend line forming with resistance near 1.3110 on the hourly chart of GBP/USD at FXOpen.
- USD/CAD rallied above 1.4000 and 1.4050 before the bears appeared.
- There is a connecting bullish trend line forming with support at 1.4085 on the hourly chart at FXOpen.
GBP/USD Technical Analysis
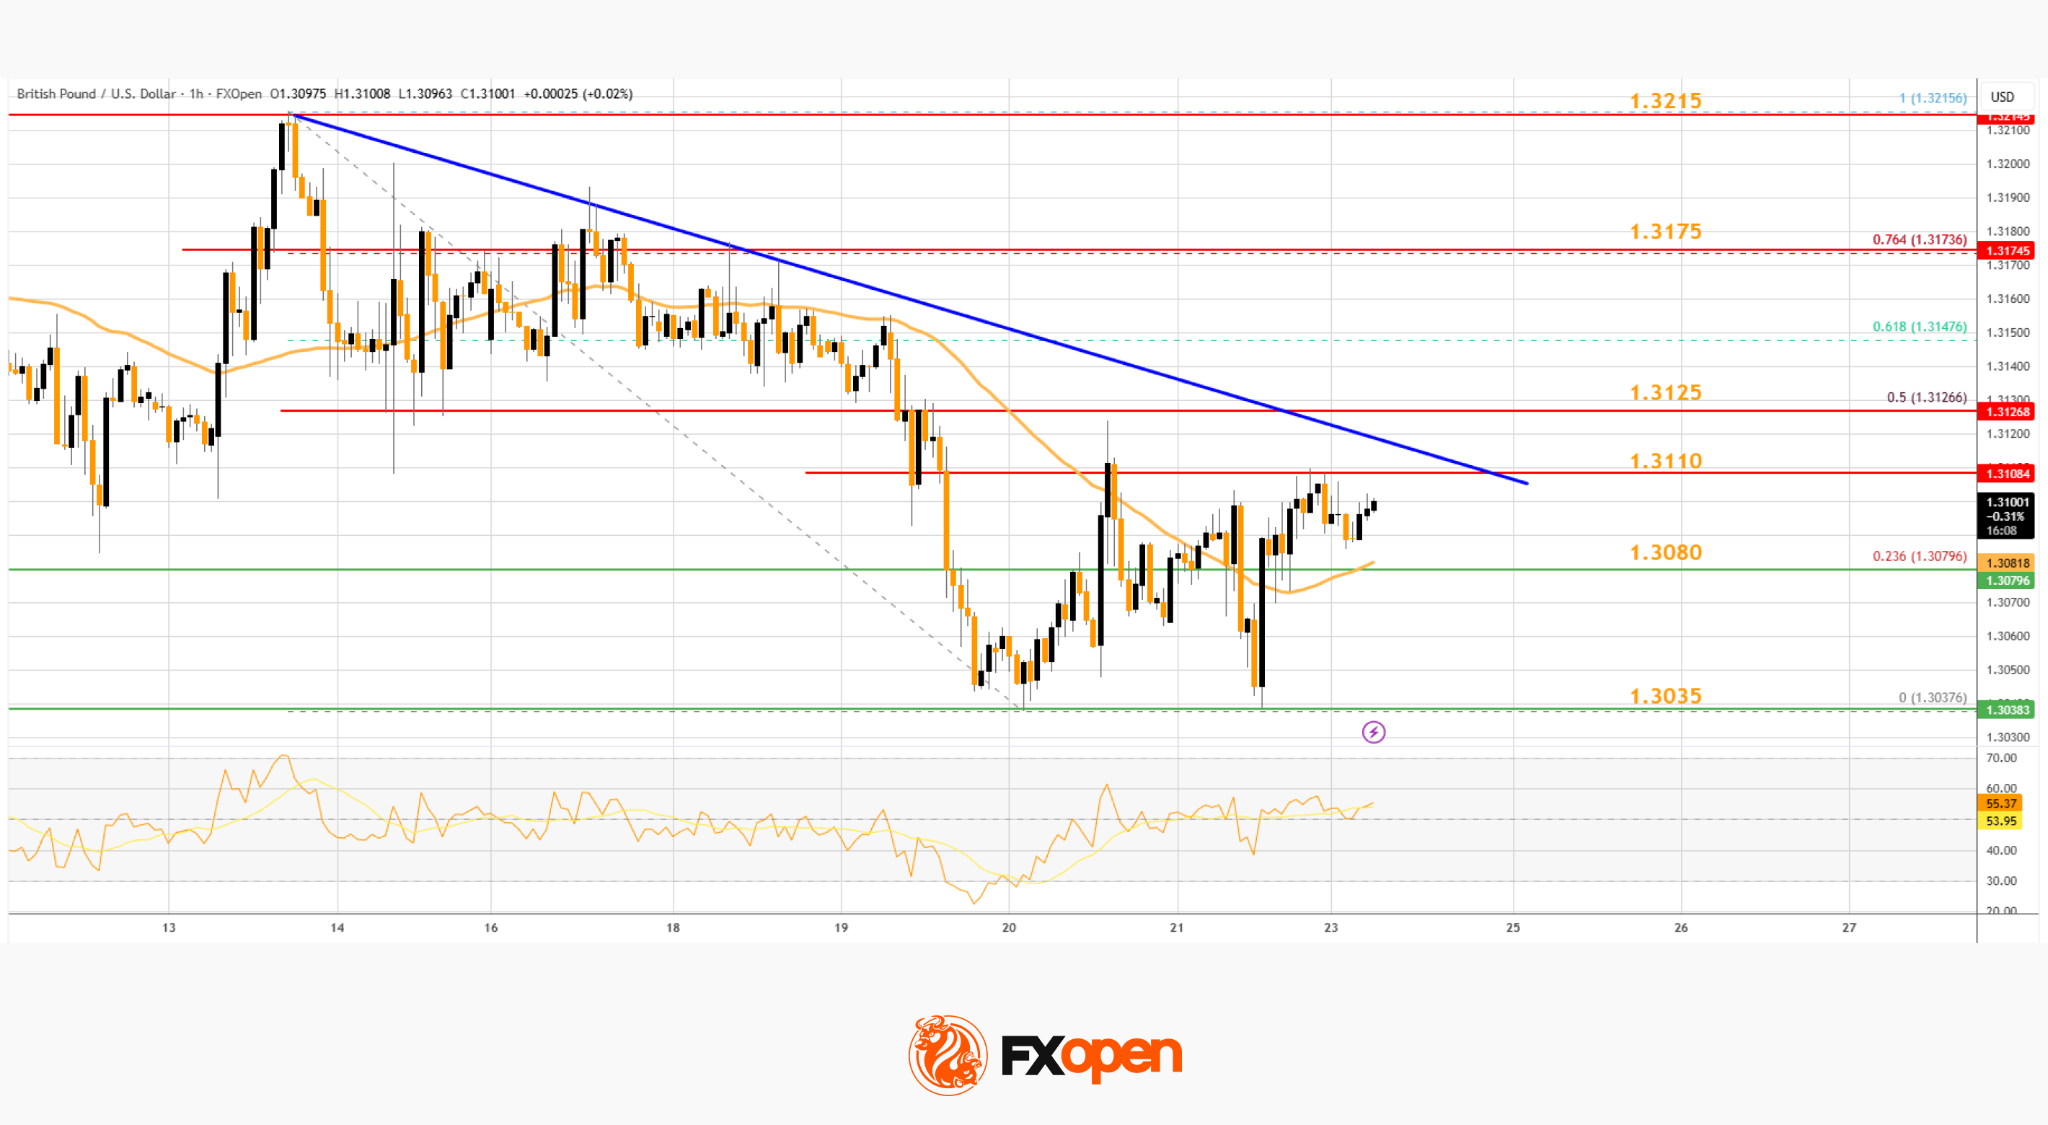
On the hourly chart of GBP/USD at FXOpen, the pair started a fresh decline from 1.3220 after a decent increase. The British pound fell below 1.3150, re-entering a short-term bearish zone against the US dollar.
The pair even traded below 1.3050 and the 50-hour simple moving average. Finally, the bulls appeared near 1.3035. A low was formed near 1.3037 and the pair is now attempting a short-term recovery wave.
There was a fresh upside above 1.3050 and the 23.6% Fib retracement level of the downward move from the 1.3215 swing high to the 1.3037 low. The pair is now showing positive signs above 1.3080. Immediate resistance is near a bearish trend line at 1.3110.
The first major hurdle for the bulls on the GBP/USD chart is 1.3125 and the 50% Fib retracement. A close above 1.3125 might spark a decent increase. The next stop for the bulls might be 1.3175. Any more gains could lead the pair toward 1.3215 in the near term.
Initial support sits near the 50-hour simple moving average at 1.3080. The next key area of interest might be 1.3035, below which there is a risk of another sharp decline. In the stated case, the pair could drop toward 1.2965.
USD/CAD Technical Analysis
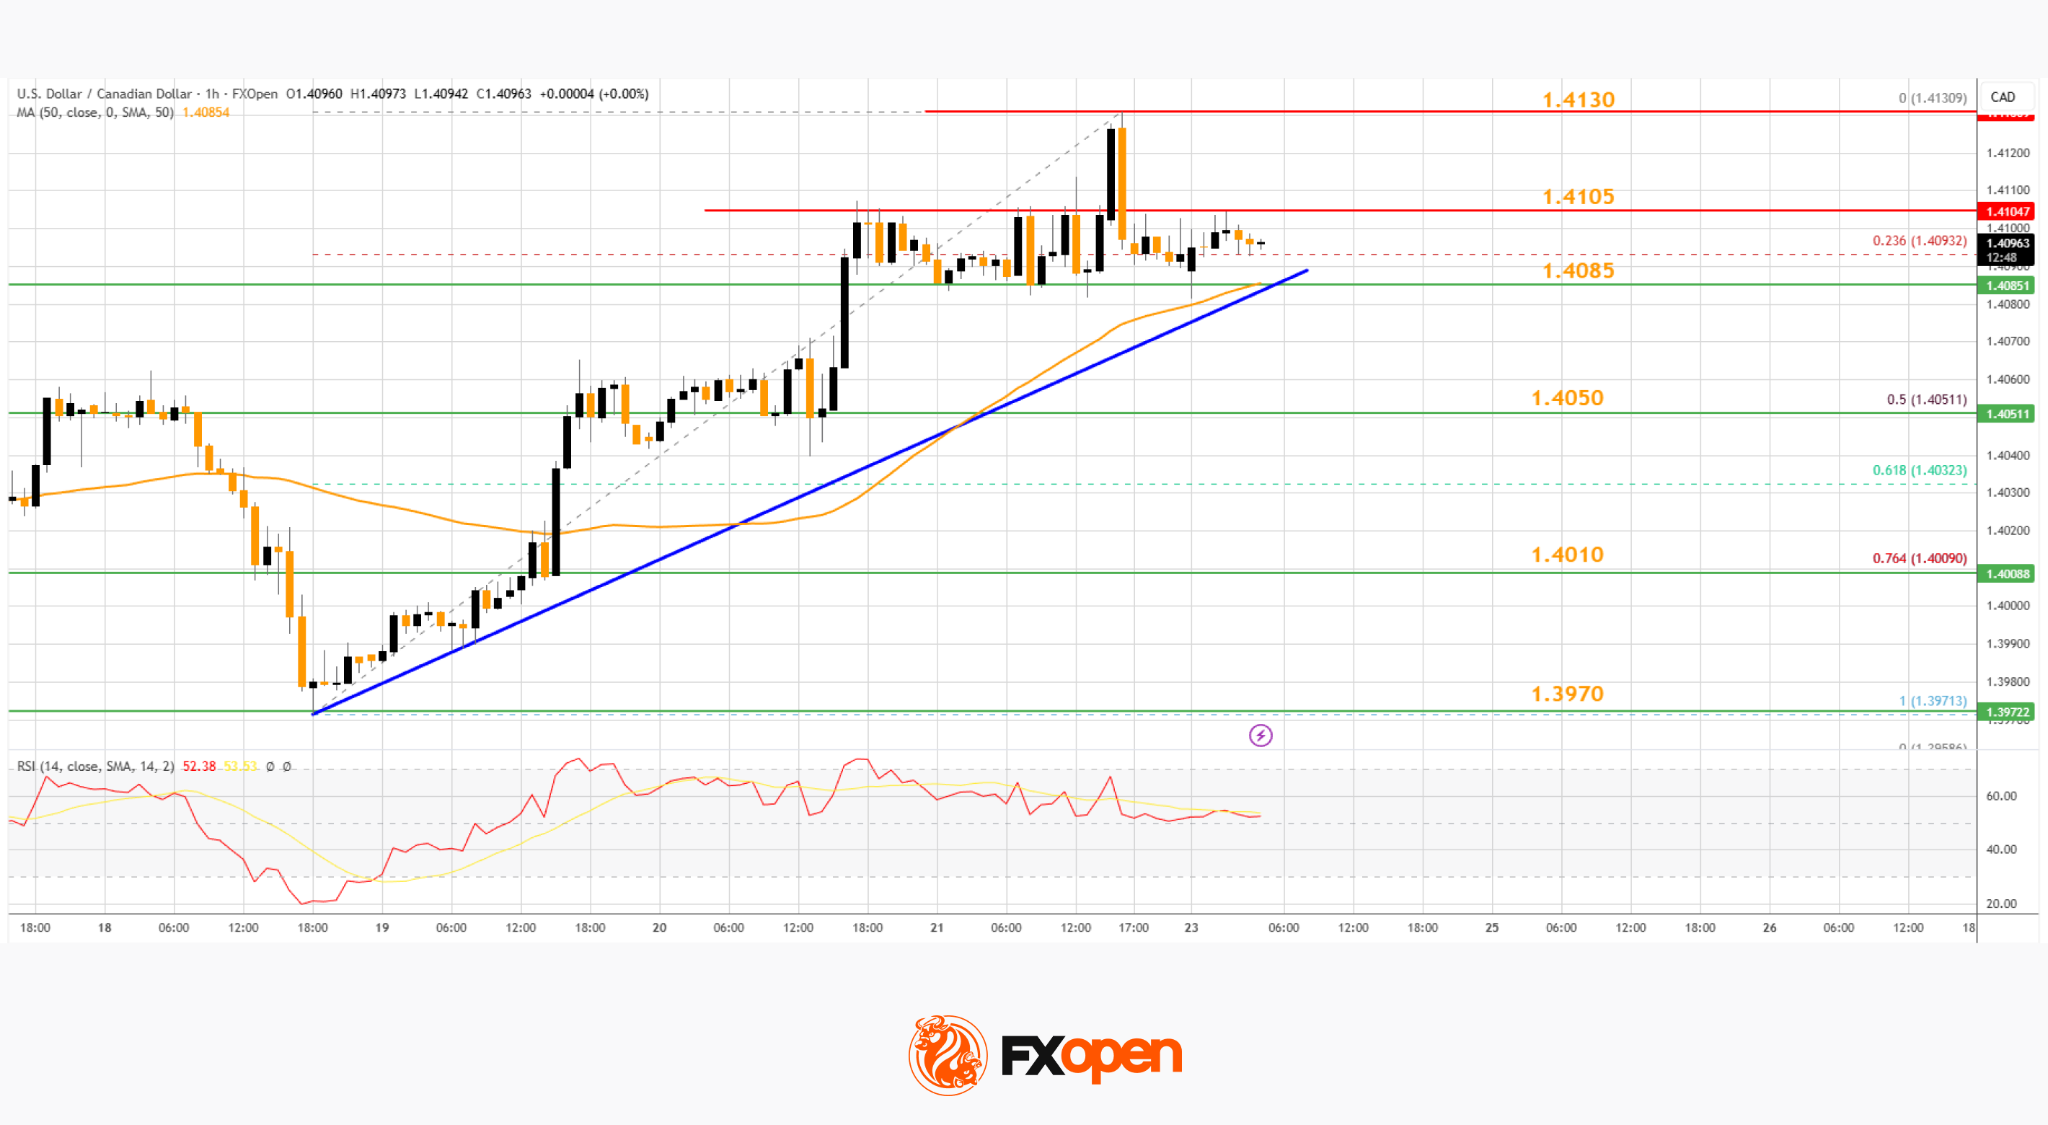
On the hourly chart of USD/CAD at FXOpen, the pair formed a strong support base above the 1.3970 level. The US Dollar started a fresh increase above 1.4000 against the Canadian Dollar.
The pair cleared the 50-hour simple moving average and climbed above 1.4050. Finally, it tested the 1.4130 zone before the bears appeared. The pair traded below the 23.6% Fib retracement level of the upward move from the 1.3971 swing low to the 1.4130 high.
Initial support is near a connecting bullish trend line at 1.4085 and the 50-hour simple moving average. A downside break below the trend line might send the pair toward 1.4050.
The next major area on the USD/CAD chart could be the 76.4% Fib retracement at 1.4010. A close below 1.4010 could push the pair further lower. In the stated case, the bears might aim for a test of 1.3970.
On the upside, initial resistance sits near 1.4105. The main breakout zone could be 1.4130. A clear upside break above 1.4130 could start another steady increase. The next major stop for the bulls might be 1.4200. Any more gains could open the doors for a test of 1.4250.
Trade over 50 forex markets 24 hours a day with FXOpen. Take advantage of low commissions, deep liquidity, and spreads from 0.0 pips (additional fees may apply). Open your FXOpen account now or learn more about trading forex with FXOpen.
This article represents the opinion of the Companies operating under the FXOpen brand only. It is not to be construed as an offer, solicitation, or recommendation with respect to products and services provided by the Companies operating under the FXOpen brand, nor is it to be considered financial advice.
Stay ahead of the market!
Subscribe now to our mailing list and receive the latest market news and insights delivered directly to your inbox.


Latest articles

FTSE 100: Correction Has Ended, but a New Impulse Has Yet to Form
Fundamental backdrop
The UK inflation report for April, published on 20 May, delivered unexpectedly positive figures: annual inflation slowed to 2.8% in April 2026 from 3.3% in March, coming in below the consensus forecast of 3.0% and

Candlestick Wick Analysis in Trading
Candlestick wicks often contain critical information about buying and selling pressure that body patterns alone may not

Market Structure Shift (MSS) in Trading
A Market Structure Shift (MSS) is an ICT trading concept used to identify potential changes