


Market Analysis: GBP/USD Back In Demand as USD/CAD Slides Further
FXOpen

GBP/USD started a fresh increase above 1.3350 and 1.3400. USD/CAD declined and is now consolidating losses below 1.3800.
Important Takeaways for GBP/USD and USD/CAD Analysis Today
· The British Pound is eyeing more gains above 1.3430.
· There is a key bullish trend line forming with support at 1.3390 on the hourly chart of GBP/USD at FXOpen.
· USD/CAD started a fresh decline after it failed to stay above 1.3800.
· There is a connecting bearish trend line with resistance at 1.3780 on the hourly chart at FXOpen.
GBP/USD Technical Analysis
On the hourly chart of GBP/USD at FXOpen, the pair formed a base above the 1.3300 level. The British Pound started a steady increase above 1.3350 against the US Dollar, as discussed in the previous analysis.
The pair gained strength above 1.3380 and the 50-hour simple moving average. It even cleared the 1.3400 handle and tested 1.3450. It is now consolidating gains below 1.3430. There was a minor pullback below the 50% Fib retracement level of the upward move from the 1.3354 swing low to the 1.3456 high, and the RSI dipped below 50.
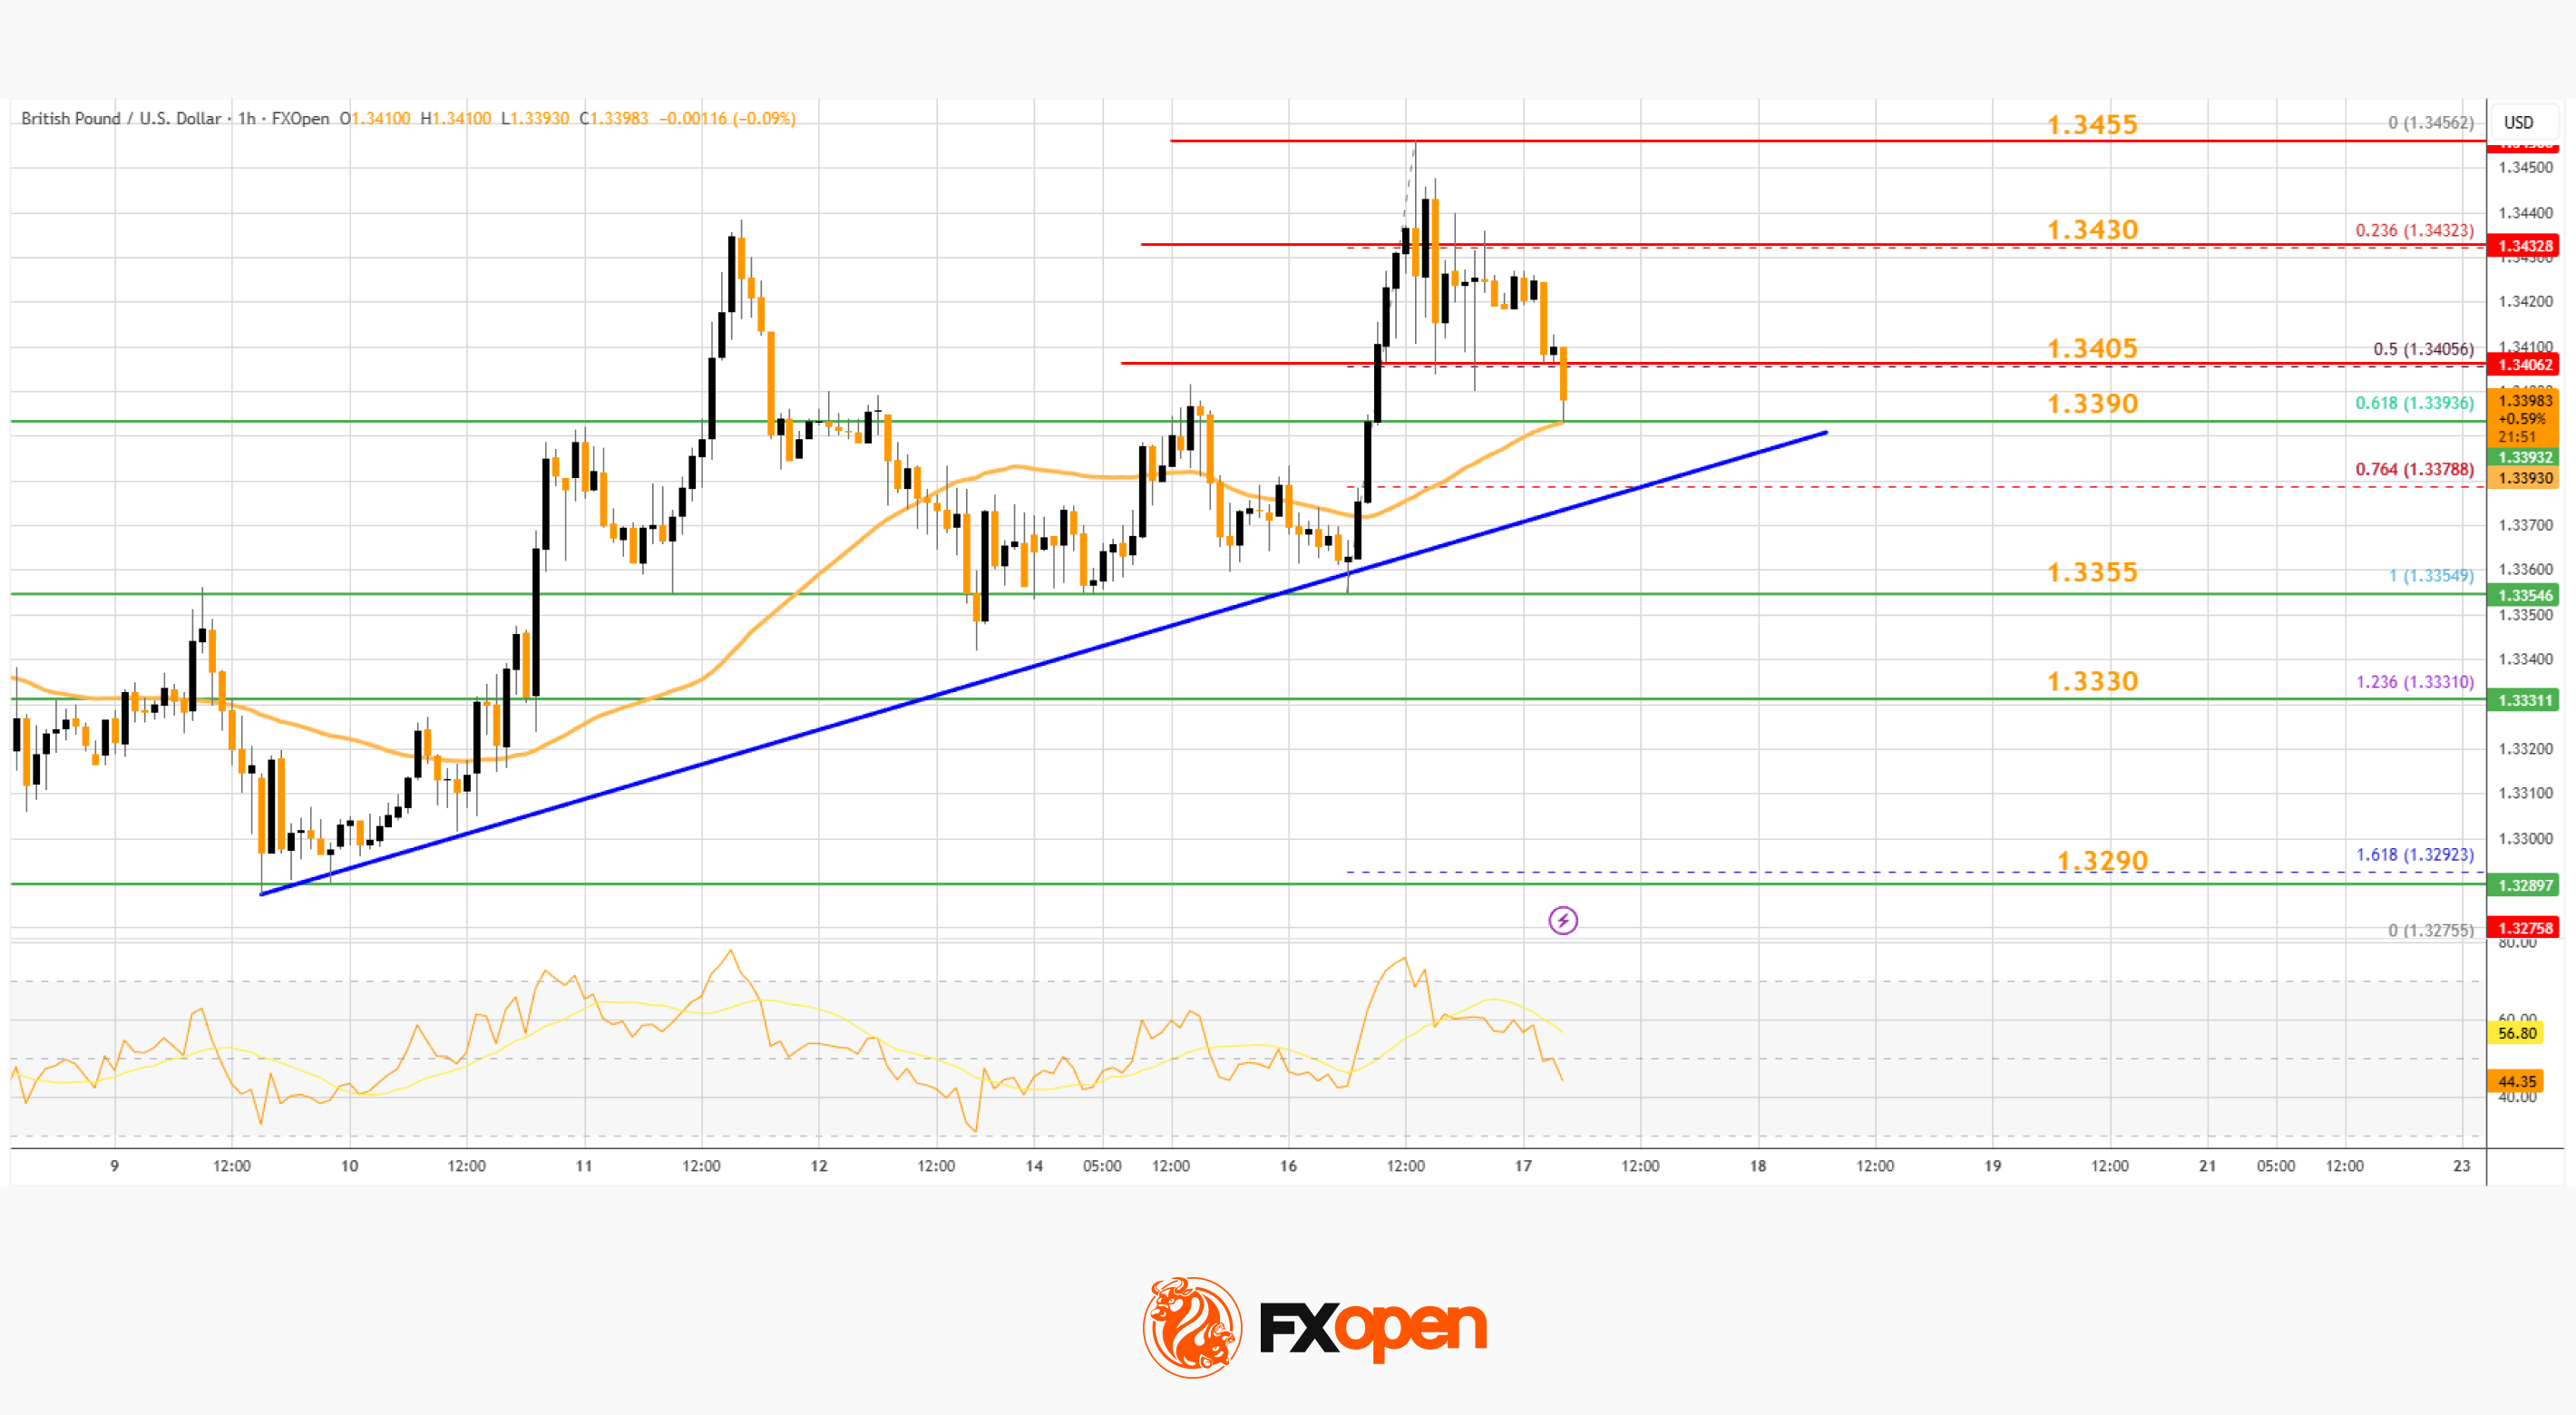
However, there is a key bullish trend line forming with support at 1.3390. On the upside, the bulls face resistance near 1.3405 on the GBP/USD chart. The first major hurdle could be 1.3430.
An upside break above 1.3430 could send the pair toward 1.3455. Any more gains might open the doors for a test of 1.3500. If there is a downside correction, immediate support is near the 1.3390 level, the trend line, the 61.8% Fib retracement, and the 50-hour simple moving average.
The first major area of interest for the bulls could be near 1.3355. The next pivot level sits near 1.3330. If there is a break below 1.3330, the pair could extend the decline. In the stated case, the pair could drop and test 1.3290. Any more losses might call for a move toward 1.3250.
USD/CAD Technical Analysis
On the hourly chart of USD/CAD at FXOpen, the pair climbed toward 1.3880 before the bears appeared. The US Dollar formed a swing high near 1.3872 and recently declined below 1.3800 against the Canadian Dollar.
There was also a close below the 50-hour simple moving average and 1.3780. The bulls are now active near 1.3730, but they might fail to protect more losses. If there is an upside correction, the pair could face resistance near 1.3780 and a connecting bearish trend line.
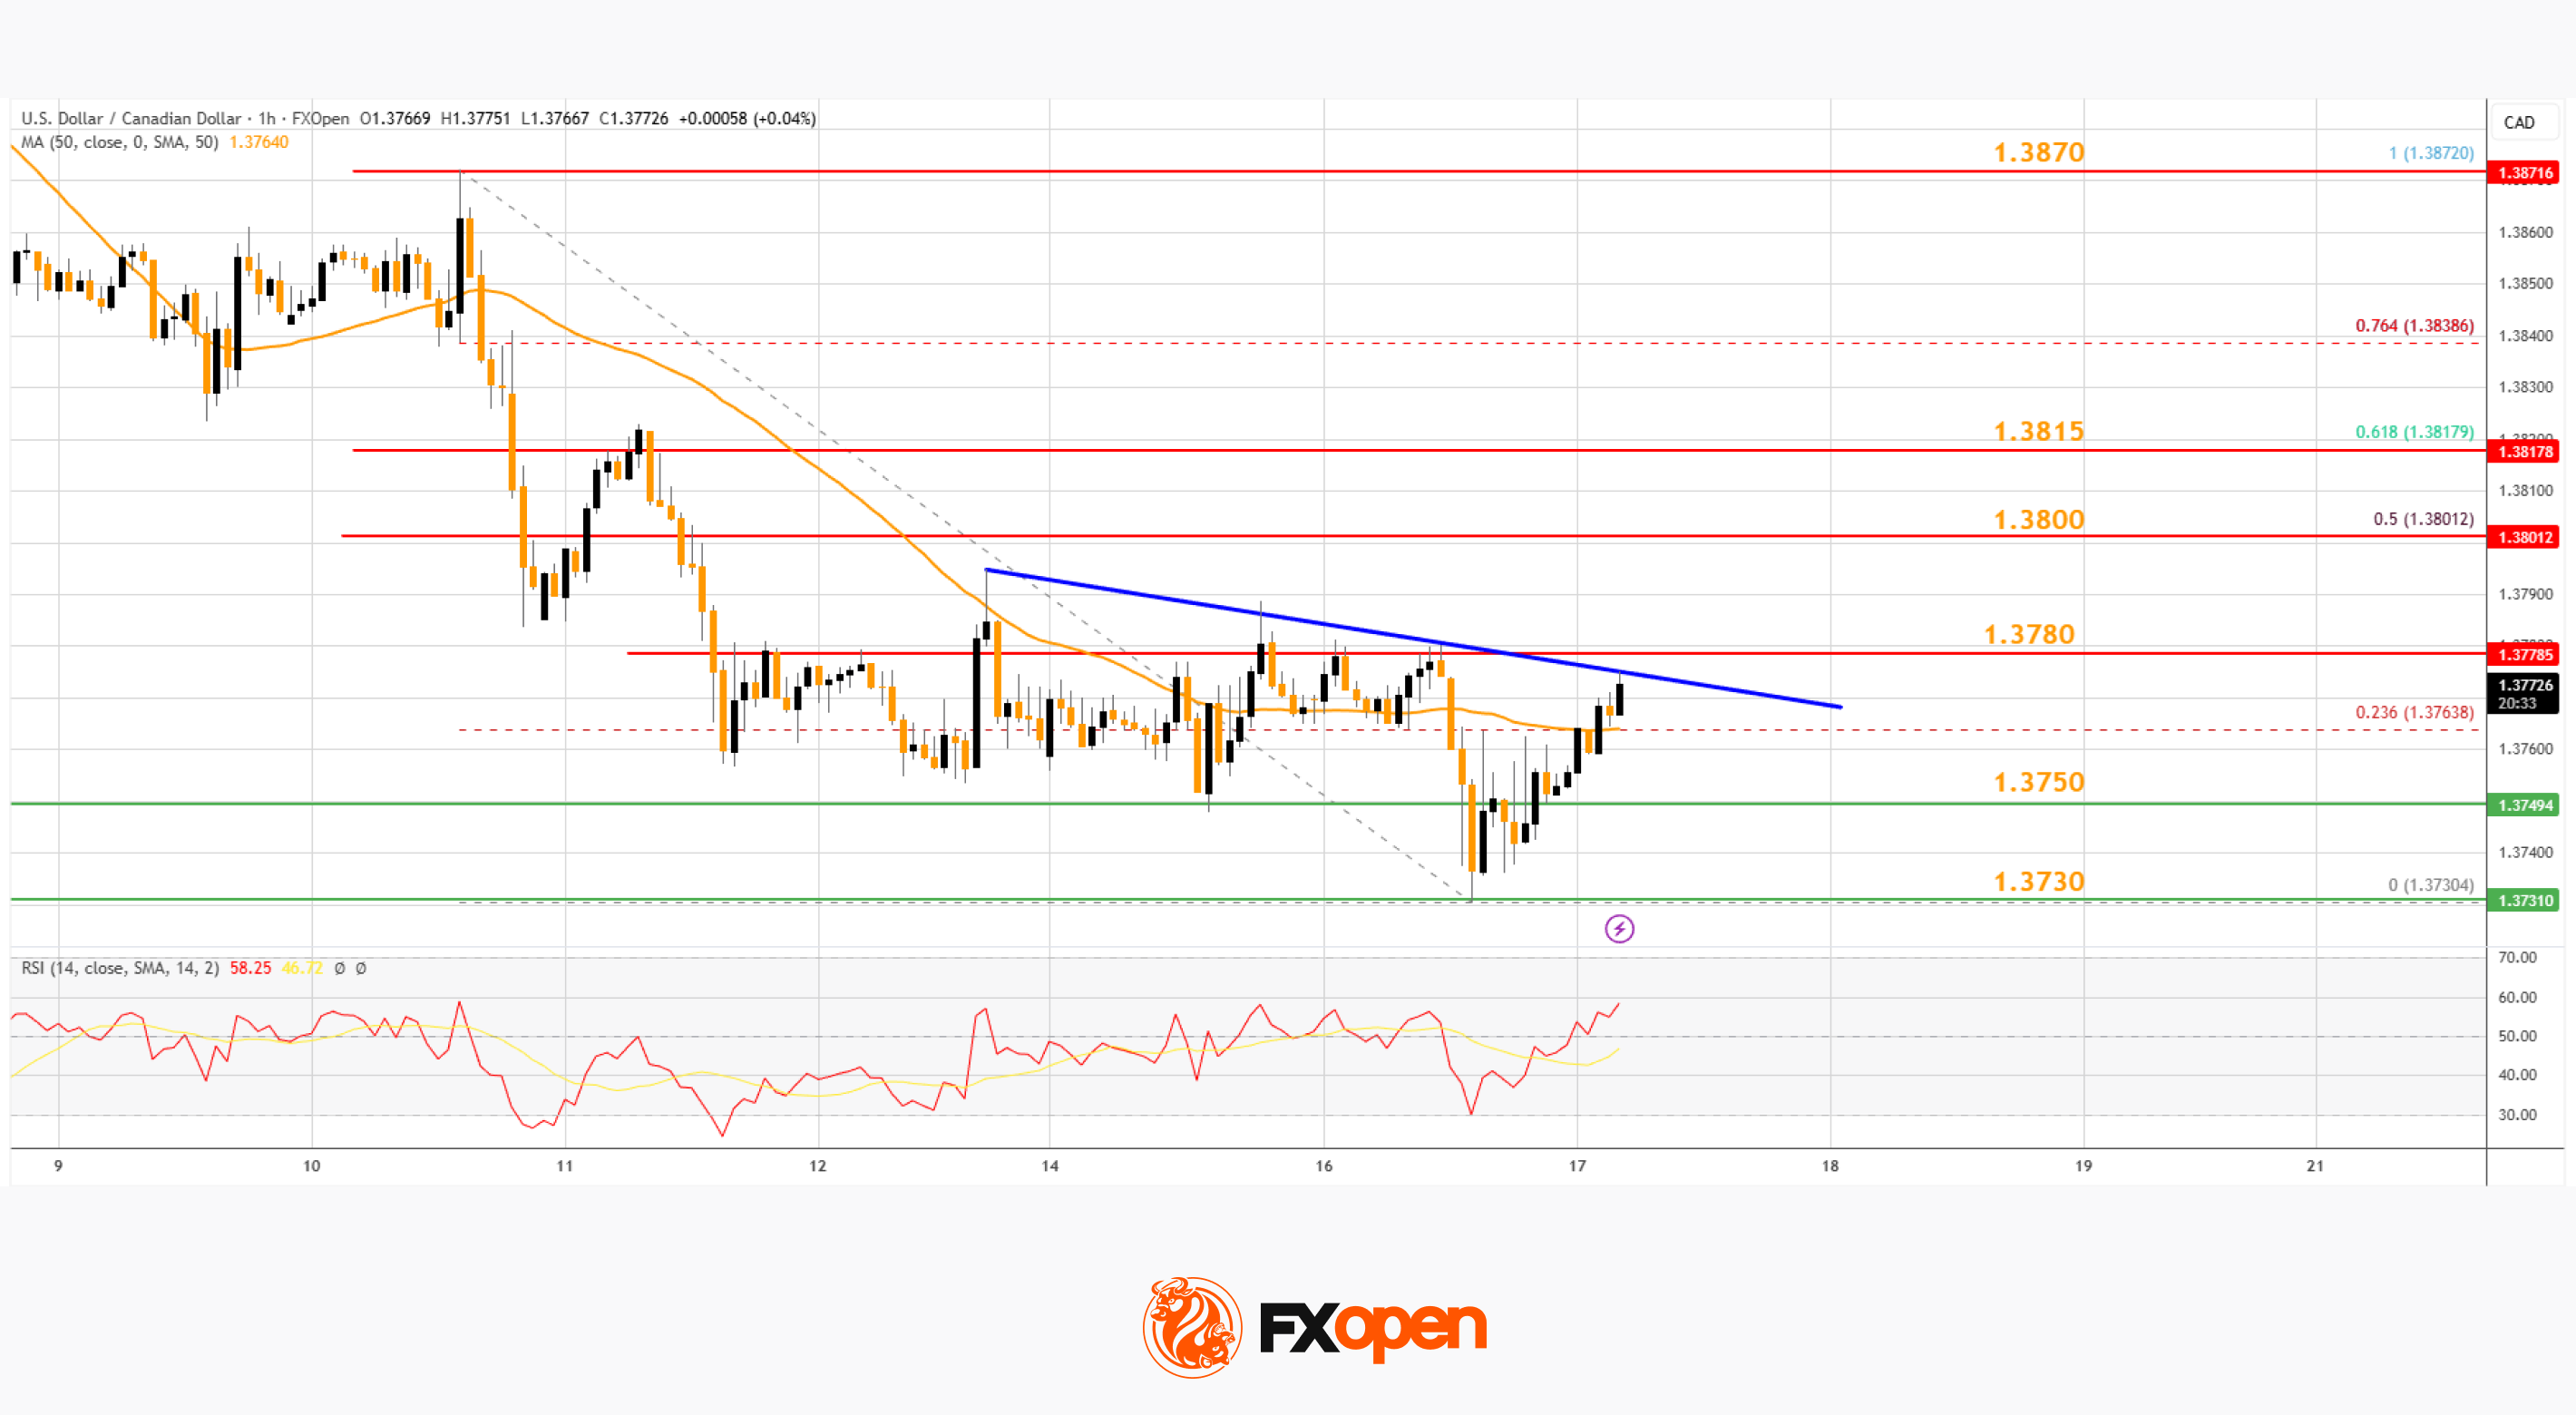
An upside break above the trend line might send the pair toward the 50% Fib retracement level of the downward move from the 1.3872 swing high to the 1.3730 low.
The next key hurdle on the USD/CAD chart is near the 61.8% Fib retracement at 1.3815. If there is a close above 1.3815, the pair could rise toward 1.3870. The next major sell zone is 1.3900, above which it could rise steadily toward the 1.4000 handle.
Immediate support is near the 1.3750 level. The first major area of interest for the bulls could be 1.3730. A close below the 1.3730 level might trigger a strong decline. In the stated case, USD/CAD might test 1.3650. Any more losses may possibly open the doors for a drop toward 1.3600.
Trade over 50 forex markets 24 hours a day with FXOpen. Take advantage of low commissions, deep liquidity, and spreads from 0.0 pips (additional fees may apply). Open your FXOpen account now or learn more about trading forex with FXOpen.
This article represents the opinion of the Companies operating under the FXOpen brand only. It is not to be construed as an offer, solicitation, or recommendation with respect to products and services provided by the Companies operating under the FXOpen brand, nor is it to be considered financial advice.
Stay ahead of the market!
Subscribe now to our mailing list and receive the latest market news and insights delivered directly to your inbox.


Latest articles

DAX 40: consolidation amid technology sell-off
A wave of selling in the technology sector that emerged earlier this week has weighed on European equities. The trigger was investor concern over the profitability of large-scale debt-funded investments by major US tech companies in AI infrastructure. The Nasdaq

Euro Hits Fresh Yearly Lows Amid Dovish ECB Signals
The euro remains under pressure following weak macroeconomic data from the euro area and fresh signals that the European Central Bank is prepared to maintain a more accommodative monetary policy stance. Data released yesterday pointed to a deterioration in business

Pound at Key Levels: Markets Assess Impact of Political Uncertainty in the UK
The British pound remains under pressure following increased political uncertainty in the United Kingdom triggered by the Prime Minister’s resignation. Investors are assessing potential shifts in the political and economic policy outlook after the head of government stepped down,