


FXOpen

GBP/USD failed to climb above 1.3800 and corrected some gains. EUR/GBP is rising and might climb above the 0.8670 resistance.
Important Takeaways for GBP/USD and EUR/GBP Analysis Today
- The British Pound is showing bearish signs below the 1.3700 support against the US dollar.
- There is a key bearish trend line forming with resistance near 1.3650 on the hourly chart of GBP/USD at FXOpen.
- EUR/GBP is gaining pace and trading above the 0.8600 zone.
- There was a break above a contracting triangle with resistance at 0.8630 on the hourly chart at FXOpen.
GBP/USD Technical Analysis
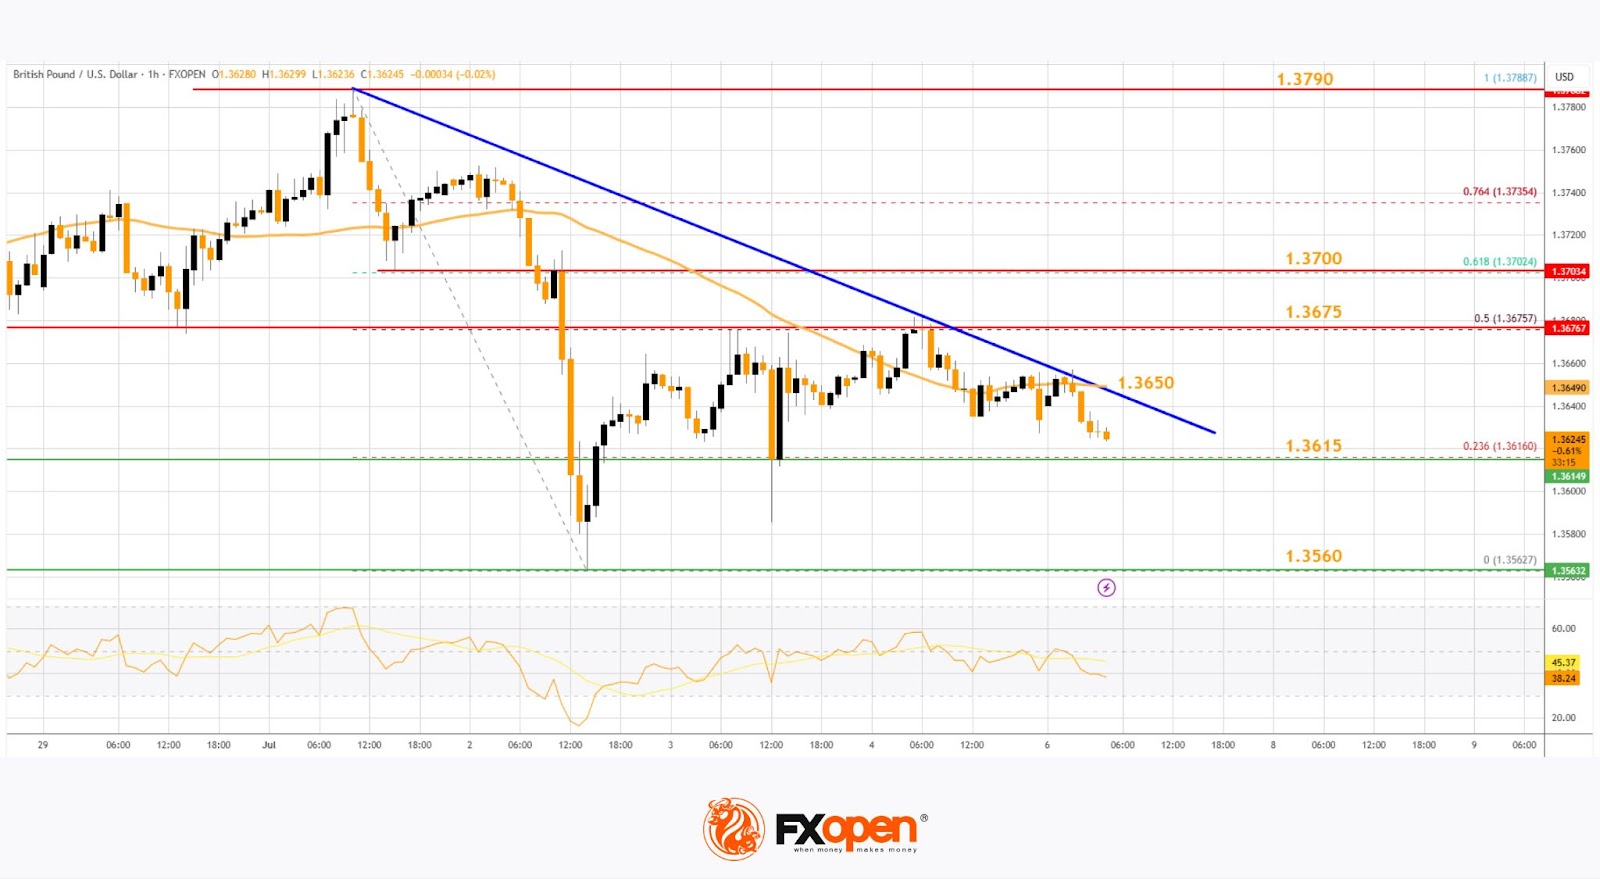
On the hourly chart of GBP/USD at FXOpen, the pair failed to stay above the 1.3750 pivot level. As a result, the British Pound started a fresh decline below 1.3720 against the US Dollar.
There was a clear move below 1.3700 and the 50-hour simple moving average. The bears pushed the pair below 1.3650. Finally, there was a spike below the 1.3600 support zone. A low was formed near 1.3562 and the pair is now consolidating losses.
There was a minor move above the 1.3615 level. On the upside, the GBP/USD chart indicates that the pair is facing resistance near the 1.3650 level. There is also a key bearish trend line forming with resistance near 1.3650.
The next major resistance is near the 50% Fib retracement level of the downward move from the 1.3788 swing high to the 1.3562 low at 1.3675. A close above the 1.3670 resistance zone could open the doors for a move toward the 1.3700 zone. The 61.8% Fib retracement level is at 1.3700. Any more gains might send GBP/USD toward 1.3790.
On the downside, there is a key support forming near 1.3615. If there is a downside break below the 1.3615 support, the pair could accelerate lower. The next major support is near the 1.3560 zone, below which the pair could test 1.3500. Any more losses could lead the pair toward the 1.3440 support.
EUR/GBP Technical Analysis
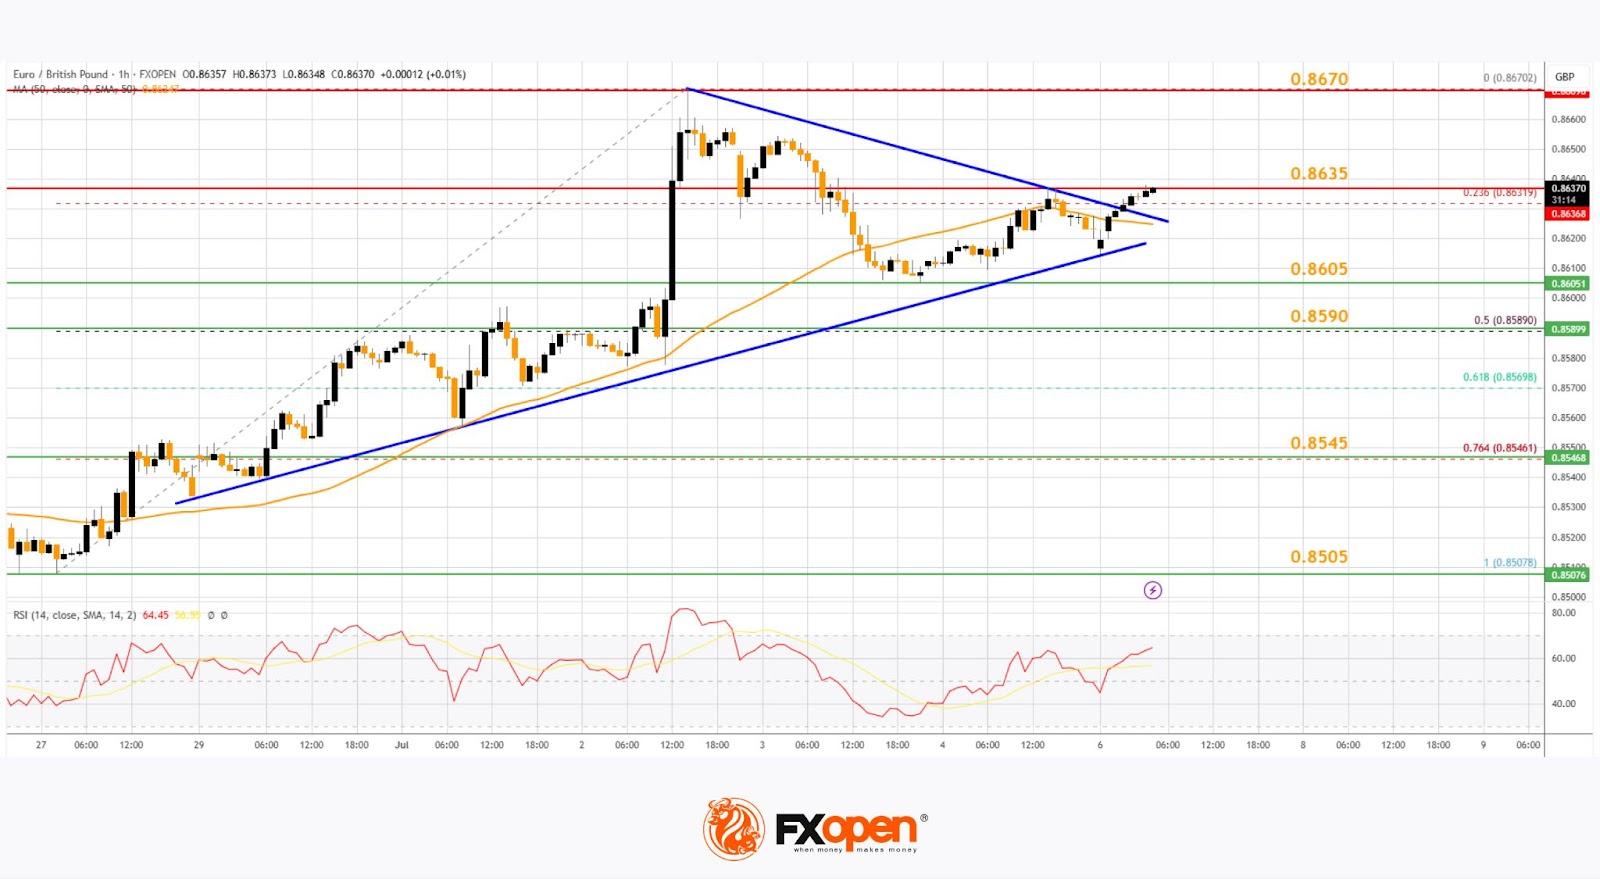
On the hourly chart of EUR/GBP at FXOpen, the pair started a decent increase from the 0.8500 zone. The Euro traded above the 0.8580 resistance level to enter a positive zone against the British Pound.
The pair settled above the 50-hour simple moving average and 0.8620. It traded as high as 0.8670 before a downside correction. There was a move below the 23.6% Fib retracement level of the upward move from the 0.8507 swing low to the 0.8670 high.
However, the pair is stable above the 0.8600 support zone. The next major support is near the 50% Fib retracement level of the upward move from the 0.8507 swing low to the 0.8670 high at 0.8590.
A downside break below 0.8590 might call for more downsides. In the stated case, the pair could drop toward the 0.8545 support level. Any more losses might call for an extended drop toward the 0.8505 pivot zone.
The EUR/GBP chart suggests that the pair is facing resistance near the 0.8635 zone. A close above the 0.8635 level might accelerate gains. In the stated case, the bulls may perhaps aim for a test of 0.8670. Any more gains might send the pair toward the 0.8700 level.
Trade over 50 forex markets 24 hours a day with FXOpen. Take advantage of low commissions, deep liquidity, and spreads from 0.0 pips (additional fees may apply). Open your FXOpen account now or learn more about trading forex with FXOpen.
This article represents the opinion of the Companies operating under the FXOpen brand only. It is not to be construed as an offer, solicitation, or recommendation with respect to products and services provided by the Companies operating under the FXOpen brand, nor is it to be considered financial advice.
Stay ahead of the market!
Subscribe now to our mailing list and receive the latest market news and insights delivered directly to your inbox.


Latest articles

EUR/USD and USD/CHF Pull Back: Market Reacts to Fundamentals
European currencies have shown a recovery in recent trading sessions after their recent decline, displaying early signs of a reversal. The US dollar is weakening amid expectations surrounding upcoming US macroeconomic data, while market participants are reassessing their short-term positions

Weak Data Weigh on the Dollar: Market Awaits Trend Confirmation
The US dollar is retreating from recent highs, moving into a moderate correction after a prolonged period of gains. Pressure on the currency is building amid weaker-than-expected macroeconomic data, while market participants adopt a wait-and-see approach ahead of key labour

Market Analysis: EUR/USD Aims Recovery While USD/JPY Gives Back Recent Gains
EUR/USD is recovering losses from 1.1450. USD/JPY is correcting gains from 160.50 and might decline further below 158.00.
Important Takeaways for EUR/USD and USD/JPY Analysis Today
· The Euro struggled to stay in a