


Market Analysis: GBP/USD Eyes Fresh Increase While USD/CAD Dips To Support
FXOpen
GBP/USD is attempting a fresh increase from the 1.2310 support. USD/CAD is correcting gains and approaching the 1.3585 support.
Important Takeaways for GBP/USD and USD/CAD Analysis Today
· The British Pound declined steadily from the 1.2475 resistance zone.
· There is a key bearish trend line forming with resistance near 1.2360 on the hourly chart of GBP/USD at FXOpen.
· USD/CAD is correcting gains from the 1.3650 resistance zone.
· There is a declining channel or a bullish flag pattern forming with resistance near 1.3620 on the hourly chart at FXOpen.
GBP/USD Technical Analysis
On the hourly chart of GBP/USD at FXOpen, the pair started a major decline from the 1.2475 zone. The British Pound declined below the 1.2390 support against the US Dollar.
The bears pushed the pair below the 1.2360 support and the 50-hour simple moving average. It retested the 1.2310 support. The recent low was formed near 1.2321 and the price is now attempting a fresh increase.
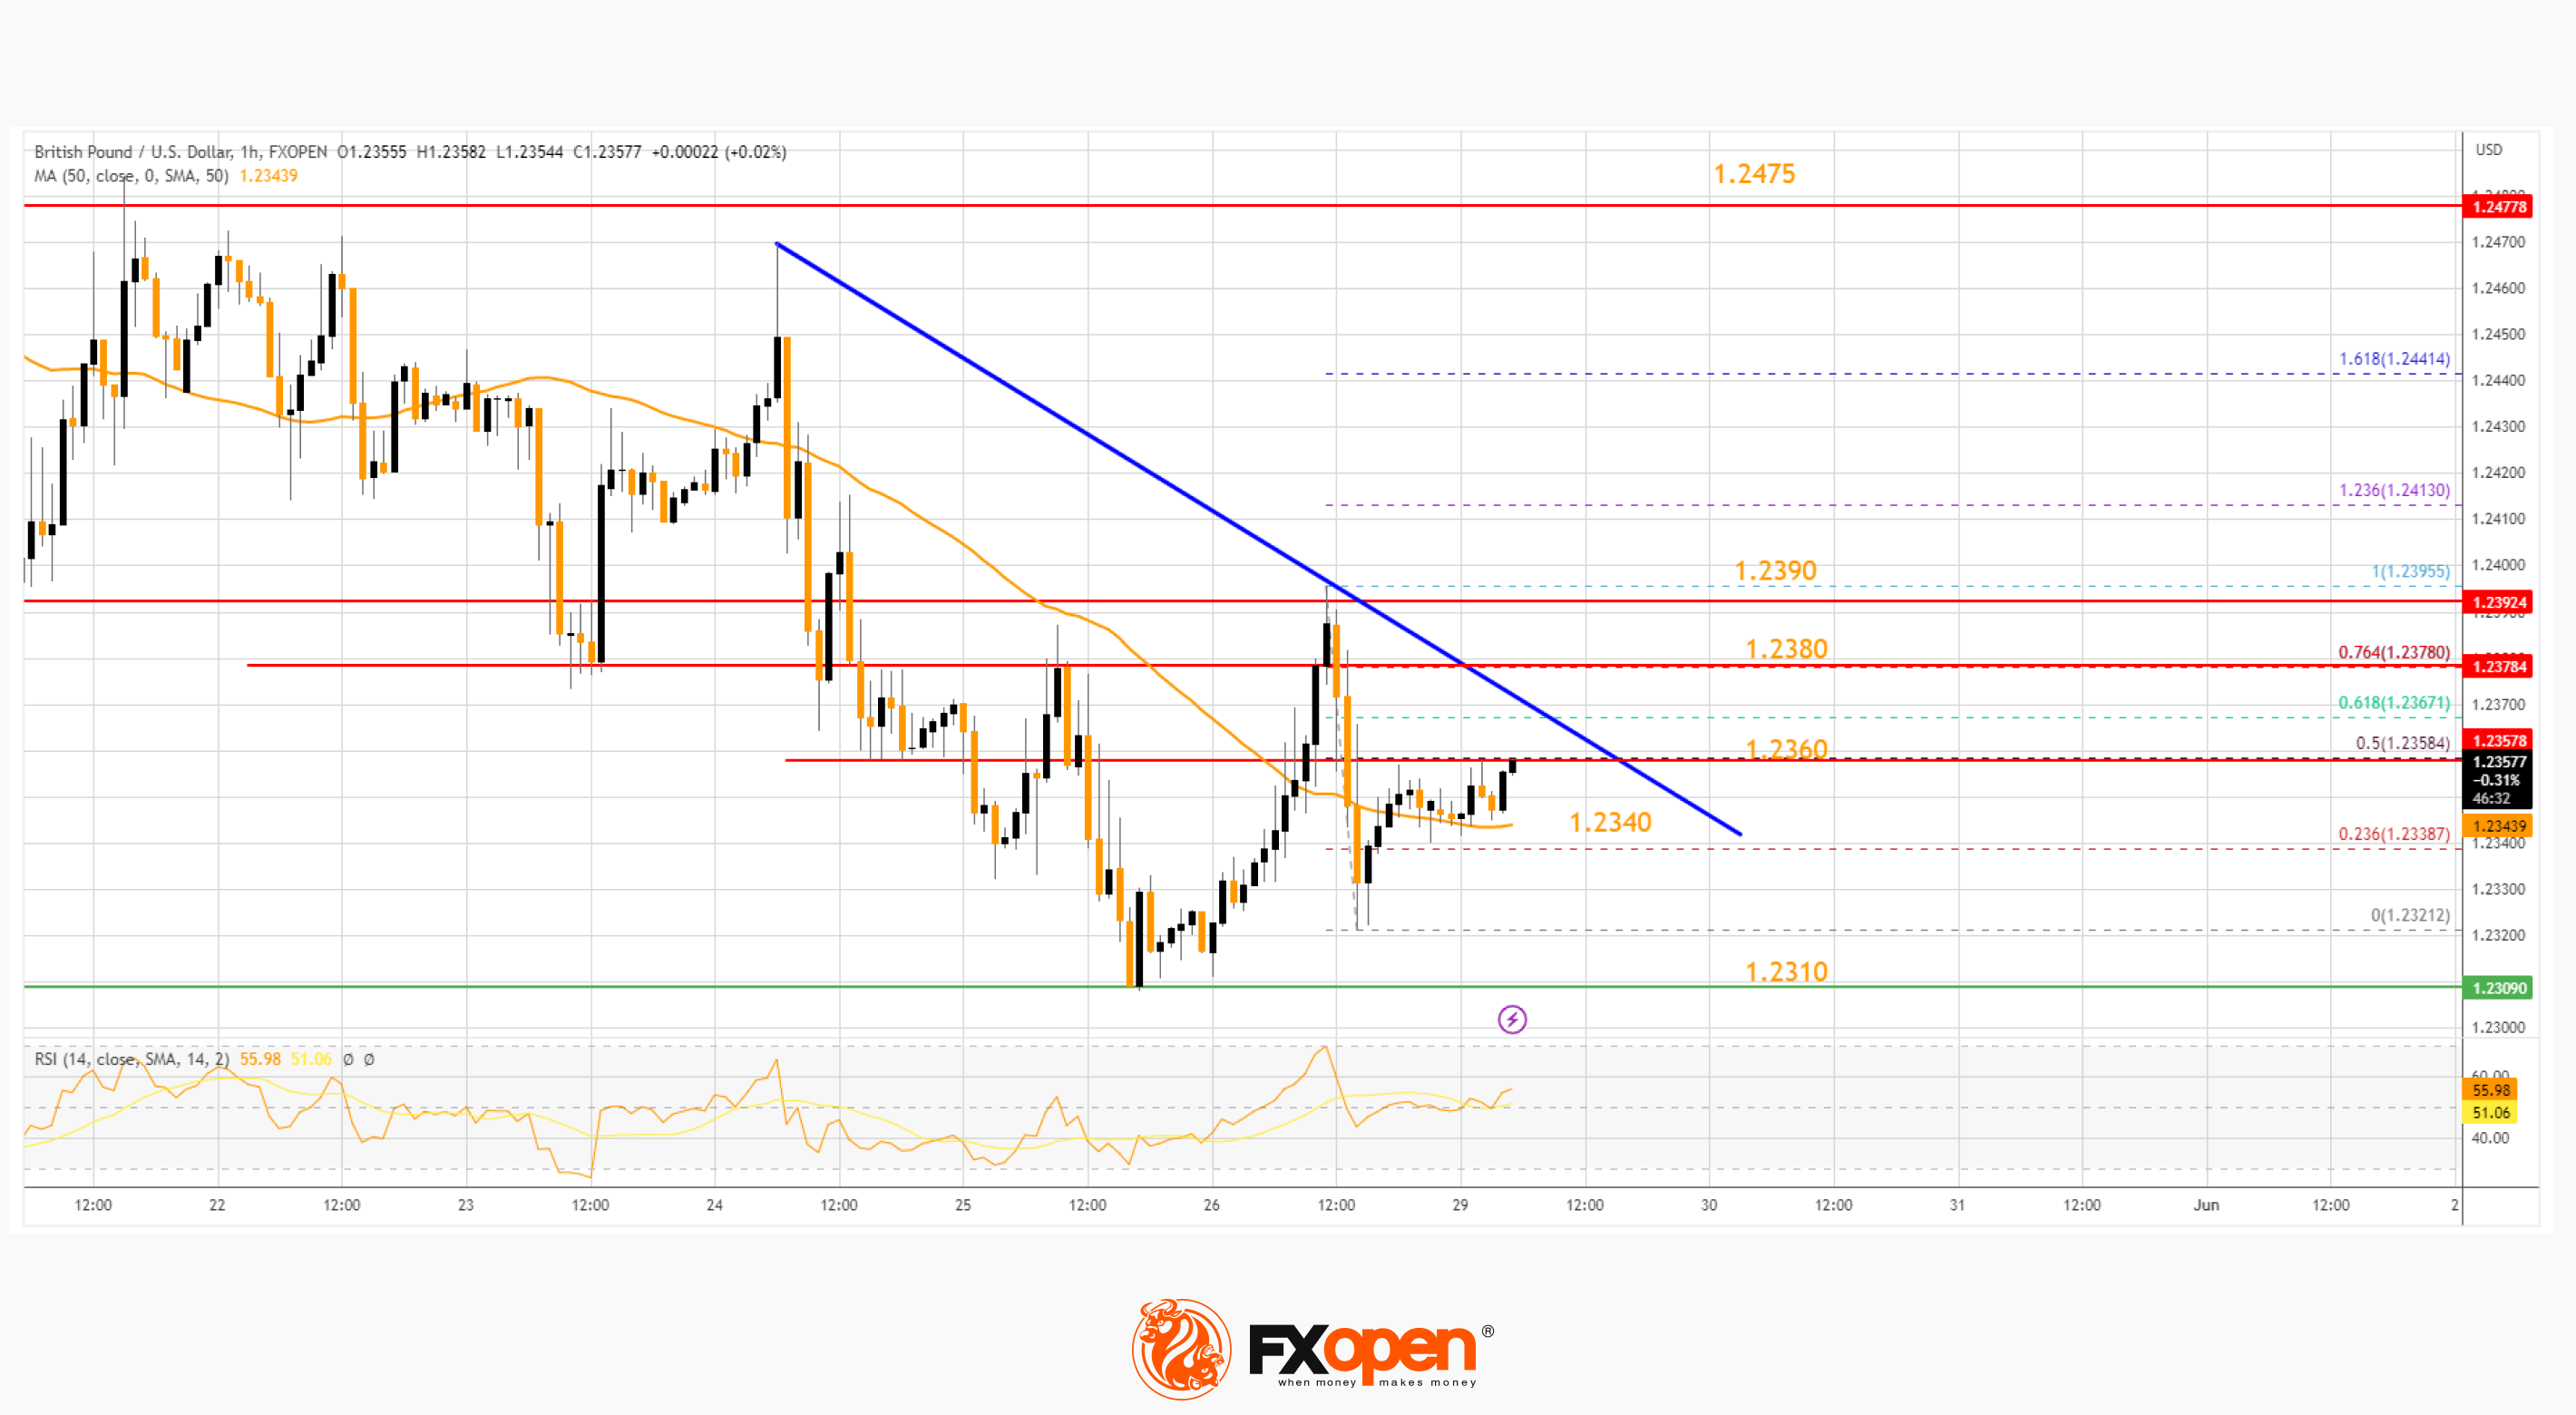
It is back above the 23.6% Fib retracement level of the downward move from the 1.2395 swing high to the 1.2321 low. Immediate resistance is near a key bearish trend at 1.2360.
The 50% Fib retracement level of the downward move from the 1.2395 swing high to the 1.2321 low is also near the trend line resistance. The first major resistance on the GBP/USD chart is near the 1.2380 level. The next major resistance is near the 1.2390 level. Any more gains could lead the pair toward the 1.2475 resistance in the near term.
If there is no upside break and RSI dips below 50, the pair might start a fresh decline. Initial support sits near the 50-hour simple moving average at 1.2340. The next major support sits at 1.2310, where the bulls might take a stand. If there is a downside break, GBP/USD might test the 1.2240 support.
USD/CAD Technical Analysis
On the hourly chart of USD/CAD at FXOpen, the pair was able to climb above the 1.3550 resistance. However, the US Dollar struggled near 1.3650 against the Canadian Dollar.
A high was formed near 1.3646 and the pair is now correcting gains. There was a move below the 1.3620 support and the 50-hour simple moving average. A low is formed near 1.3595 and the pair is now consolidating.
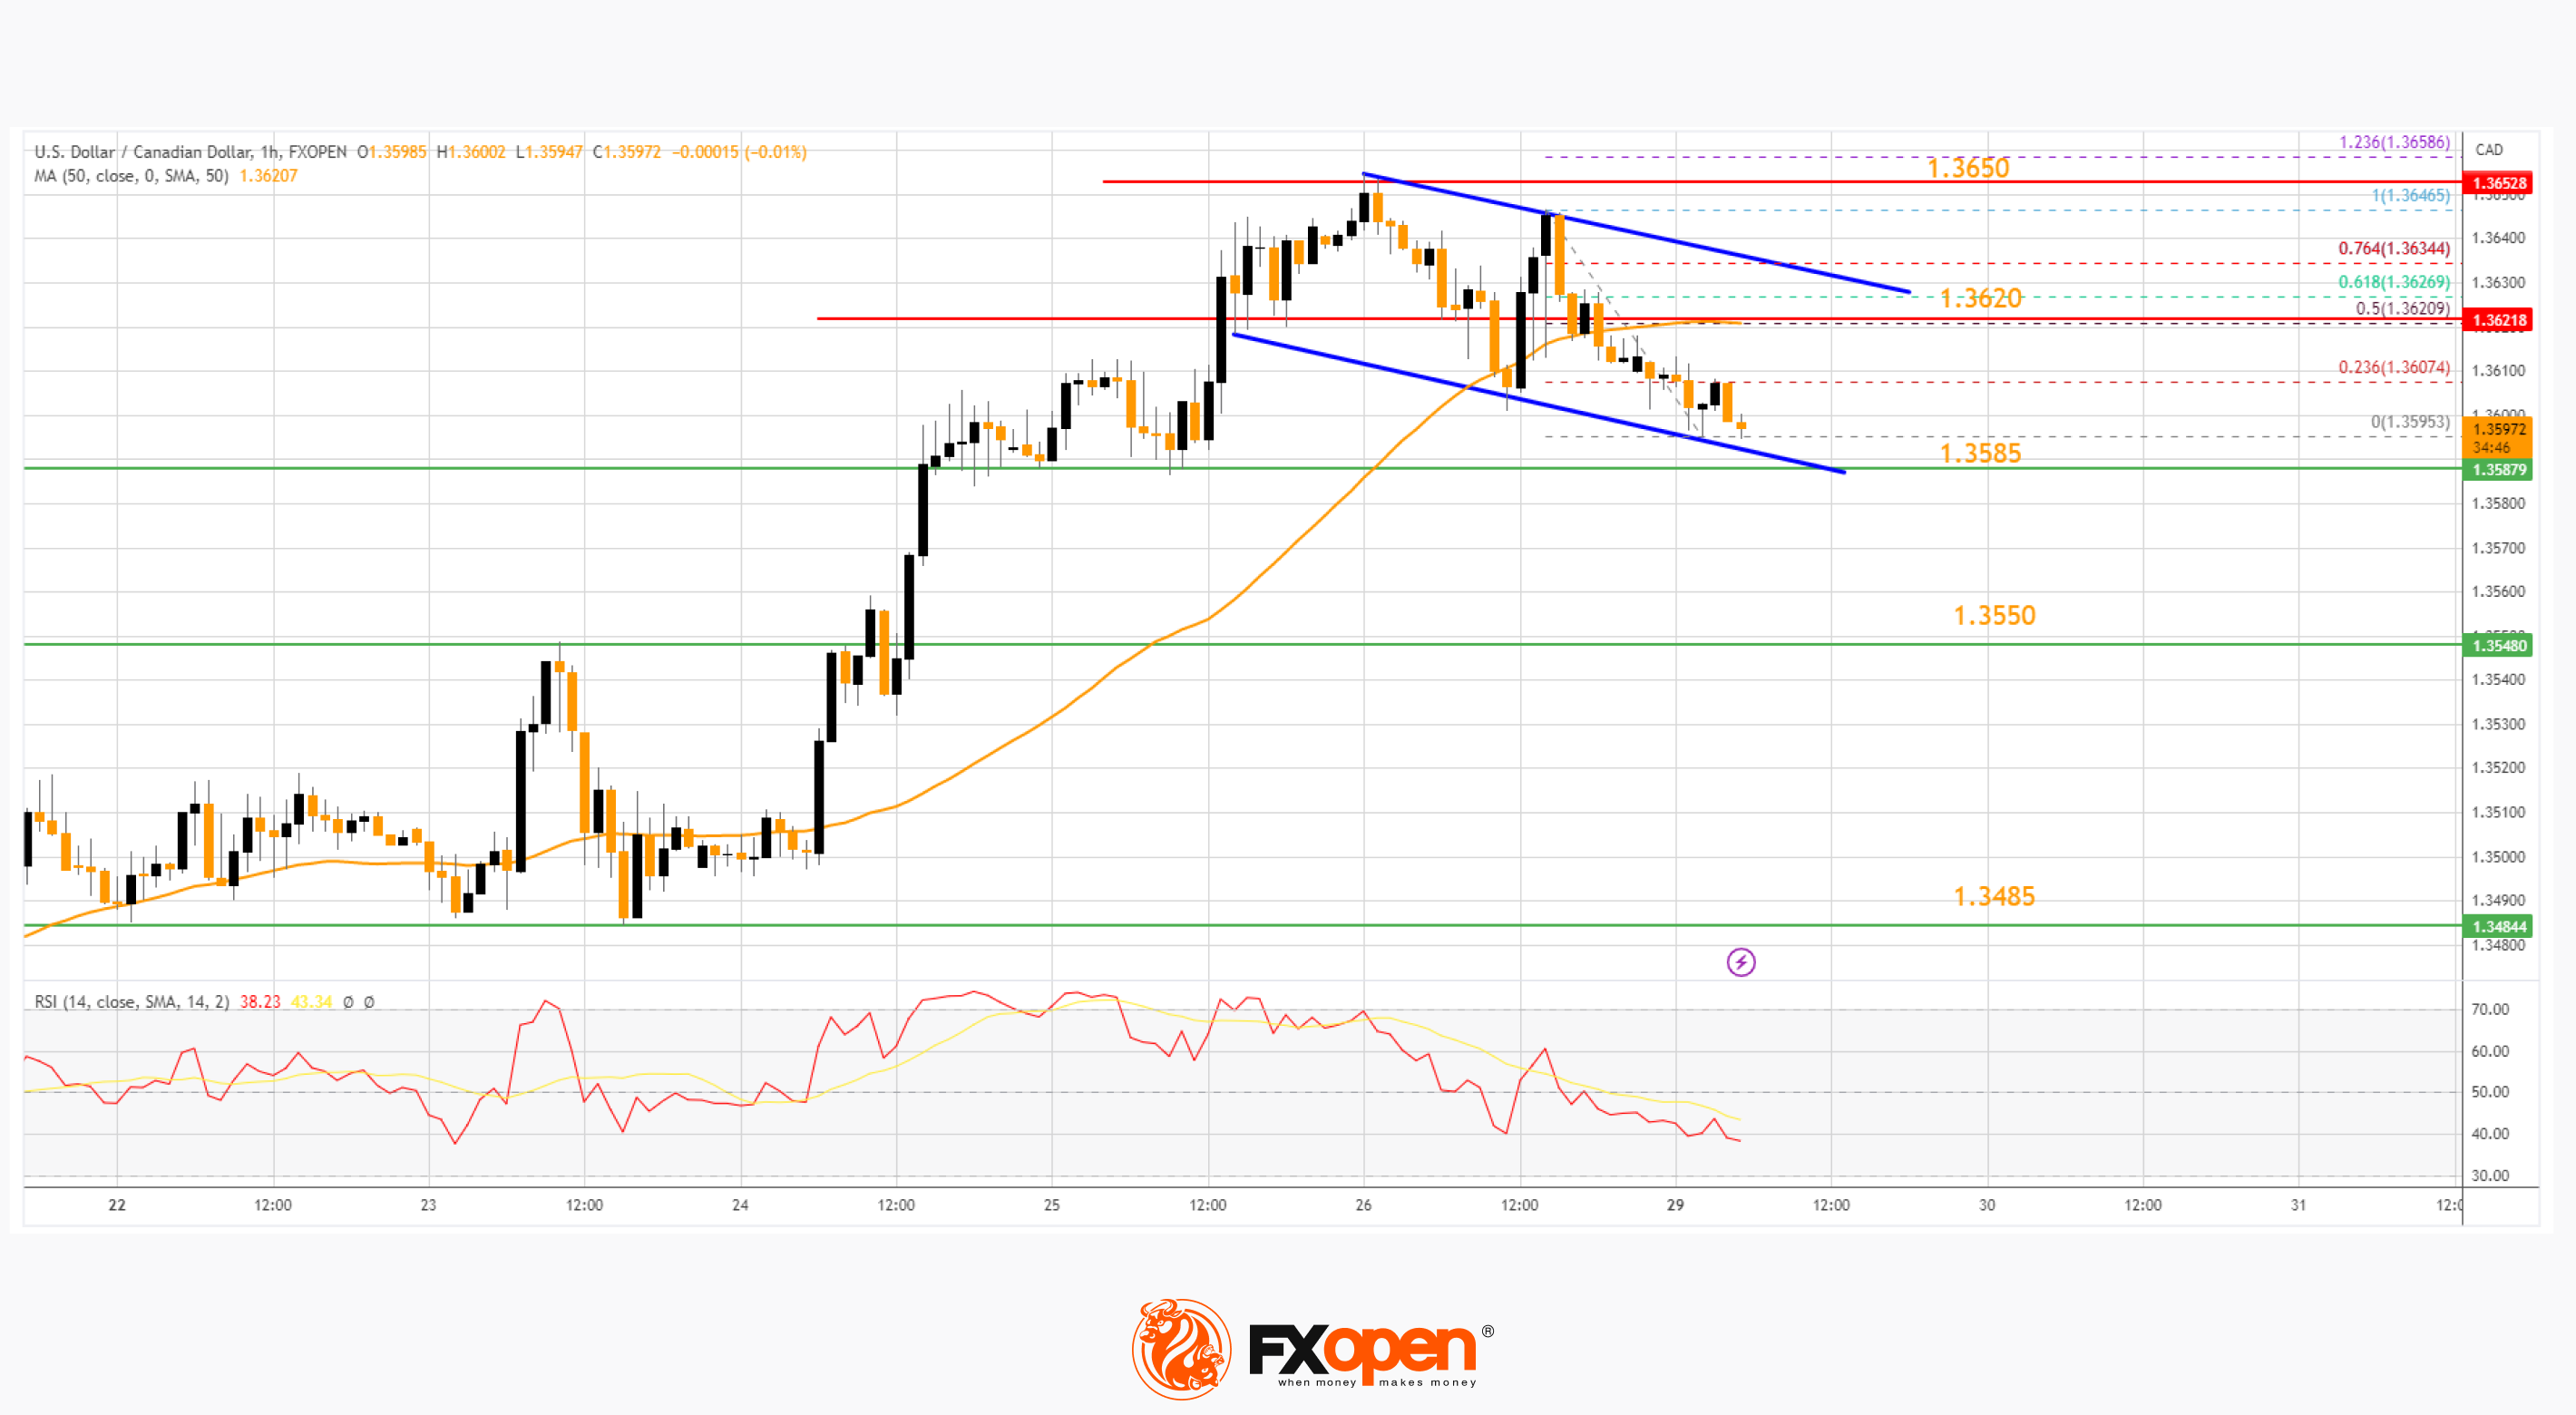
Immediate resistance is near the 23.6% Fib retracement level of the downward move from the 1.3646 swing high to the 1.3595 low at 1.3608. The next major resistance is near the 50-hour simple moving average.
There is also a declining channel or a bullish flag pattern forming with resistance on the same USD/CAD chart. It is close to the 50% Fib retracement level of the downward move from the 1.3646 swing high to the 1.3595 low.
A close above the 1.3620 level might send the pair toward the 1.3650 level. Any more gains could open the doors for a test of the 1.3700 level.
On the downside, the pair is likely to find bids near 1.3585. The next major support is near the 1.3550 level. A downside break below the 1.3550 support level could push the pair further lower. The next major support is near the 1.3500 zone, below which the pair might revisit the 1.3440 level.
Trade over 50 forex markets 24 hours a day with FXOpen. Take advantage of low commissions, deep liquidity, and spreads from 0.0 pips (additional fees may apply). Open your FXOpen account now or learn more about trading forex with FXOpen.
This article represents the opinion of the Companies operating under the FXOpen brand only. It is not to be construed as an offer, solicitation, or recommendation with respect to products and services provided by the Companies operating under the FXOpen brand, nor is it to be considered financial advice.
Stay ahead of the market!
Subscribe now to our mailing list and receive the latest market news and insights delivered directly to your inbox.


Latest articles

Weekly Market Insights with Gary Thomson: The Week of Central Banks and Earnings
In this video, we’ll explore the key economic events and market trends, shaping the financial landscape. Get ready for insights into financial markets to help you navigate the week ahead. Let’s dive in!
In this episode of Market

Intel at a Crossroads: Earnings Beat Meets Technical Resistance
Intel has just delivered its strongest quarter in over fifteen years, and the market reaction says it all. Q2 2026 revenue surged 25% year-over-year to $16.1 billion, crushing the consensus estimate of $14.42 billion, while adjusted EPS of

Tesla: Complex Range Structure Breaks Down Following Quarterly Earnings
Tesla released its Q2 2026 results after the market closed on 22 July. Revenue increased 26% year-on-year to $28.24 billion, while vehicle deliveries reached a record 480,126 units. However, operating margin fell sharply to 1.4%, down from