


FXOpen
GBP/USD started a fresh increase above the 1.3200 zone. USD/CAD declined and now consolidates below the 1.3600 level.
Important Takeaways for GBP/USD and USD/CAD Analysis Today
· The British Pound is eyeing more gains above the 1.3300 resistance.
· There is a key expanding triangle forming with support near 1.3200 on the hourly chart of GBP/USD at FXOpen.
· USD/CAD started a fresh decline after it failed to clear the 1.3650 resistance.
· There was a break below a short-term contracting triangle with support at 1.3560 on the hourly chart at FXOpen.
GBP/USD Technical Analysis
On the hourly chart of GBP/USD at FXOpen, the pair formed a base above the 1.3100 level. The British Pound started a steady increase above the 1.3200 resistance zone against the US Dollar, as discussed in the previous analysis.
The pair gained strength above the 1.3235 level. The bulls even pushed the pair above the 1.3300 level and the 50-hour simple moving average. The pair tested the 1.3315 zone and is currently consolidating gains.
There was a minor decline below the 1.3300 level. The pair tested the 23.6% Fib retracement level of the upward move from the 1.3153 swing low to the 1.3314 high.
The bulls are now active near the 1.3275 level. If there is another decline, the pair could find support near the 1.3235 level or the 50% Fib retracement level of the upward move from the 1.3153 swing low to the 1.3314 high.
The first major support sits near the 1.3200 zone. There is also a key expanding triangle forming with support near 1.3200. The next major support is 1.3150. If there is a break below 1.3150, the pair could extend the decline.
The next key support is near the 1.3115 level. Any more losses might call for a test of the 1.3075 support. Conversely, the bulls might aim for more gains. The RSI moved above the 60 level on the GBP/USD chart and the pair is now approaching a major hurdle at 1.3315.
An upside break above the 1.3315 zone could send the pair toward 1.3350. Any more gains might open the doors for a test of 1.3420.
USD/CAD Technical Analysis
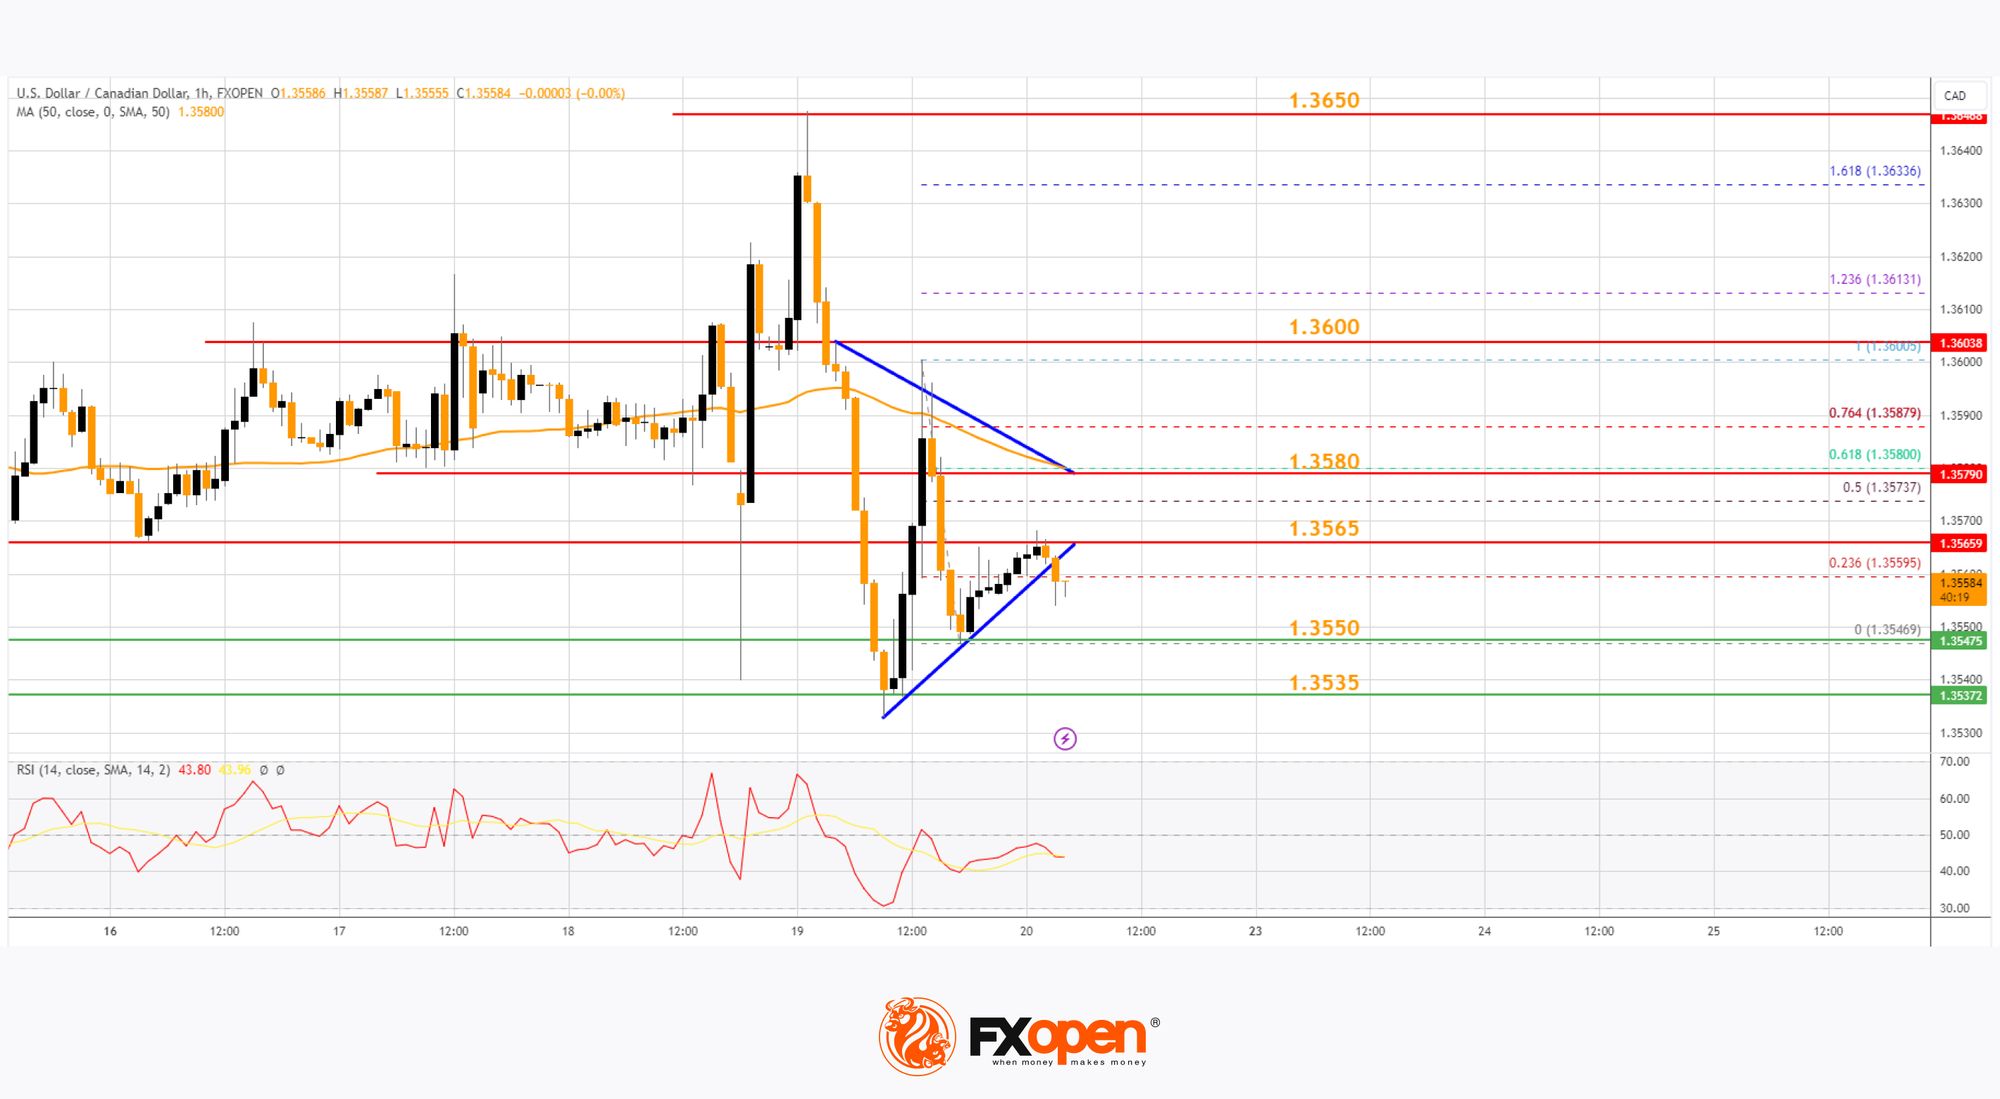
On the hourly chart of USD/CAD at FXOpen, the pair climbed toward the 1.3620 resistance zone before the bears appeared. The US Dollar formed a swing high near 1.3650 and recently declined below the 1.3600 support against the Canadian Dollar.
There was also a close below the 50-hour simple moving average and 1.3580. Besides, there was a break below a short-term contracting triangle with support at 1.3560.

The bulls are now active near the 1.3550 level. Recently, the pair corrected some losses and climbed above the 23.6% Fib retracement level of the downward move from the 1.3600 swing high to the 1.3546 low.
If there is a fresh increase, the pair could face resistance near the 1.3565 level. The next key resistance on the USD/CAD chart is near the 61.8% Fib retracement level of the downward move from the 1.3600 swing high to the 1.3546 low is 1.3580.
If there is an upside break above 1.3580, the pair could rise toward the 1.3600 resistance. The next major resistance is near the 1.3650 level, above which it could rise steadily toward the 1.3700 resistance zone.
Immediate support is near the 1.3550 level. The first major support is near 1.3535. A close below the 1.3535 level might trigger a strong decline. In the stated case, USD/CAD might test 1.3500. Any more losses may possibly open the doors for a drop toward the 1.3450 support.
Trade over 50 forex markets 24 hours a day with FXOpen. Take advantage of low commissions, deep liquidity, and spreads from 0.0 pips (additional fees may apply). Open your FXOpen account now or learn more about trading forex with FXOpen.
This article represents the opinion of the Companies operating under the FXOpen brand only. It is not to be construed as an offer, solicitation, or recommendation with respect to products and services provided by the Companies operating under the FXOpen brand, nor is it to be considered financial advice.
Stay ahead of the market!
Subscribe now to our mailing list and receive the latest market news and insights delivered directly to your inbox.


Latest articles

Market Analysis: GBP/USD Dips Further As EUR/GBP Regains Traction
GBP/USD failed to climb above 1.3500 and corrected some gains. EUR/GBP started a decent increase and might aim for more gains above 0.8700.
Important Takeaways for GBP/USD and EUR/GBP Analysis Today
· The British Pound


Market Insights with Gary Thomson: Oil, US Retail Sales & NFP in Focus
In this video, we’ll explore the key economic events and market trends, shaping the financial landscape. Get ready for insights into financial markets to help you navigate the week ahead. Let’s dive in!
In this episode of Market