


Market Analysis: GBP/USD Remains At Risk While EUR/GBP Turns Green
FXOpen
GBP/USD started a fresh decline from the 1.2285 resistance zone. EUR/GBP is rising and might climb above the 0.8720 resistance.
Important Takeaways for GBP/USD and EUR/GBP Analysis Today
· The British Pound is showing bearish signs below the 1.2200 support.
· There is a key contracting triangle forming with resistance near 1.2155 on the hourly chart of GBP/USD at FXOpen.
· EUR/GBP is gaining pace and trading above the 0.8700 zone.
· There is a major contracting triangle forming with resistance near 0.8720 on the hourly chart at FXOpen.
GBP/USD Technical Analysis
On the hourly chart of GBP/USD at FXOpen, the pair attempted a fresh increase above 1.2200, as discussed in the previous analysis. However, the British Pound failed above 1.2285 and started a fresh decline against the US Dollar.
There was a clear move below 1.2200 and the 50-hour simple moving average. The bears pushed the pair 1.2155. Finally, there was a spike below the 1.2110 support zone. A low was formed near 1.2069 and the pair is now consolidating losses.
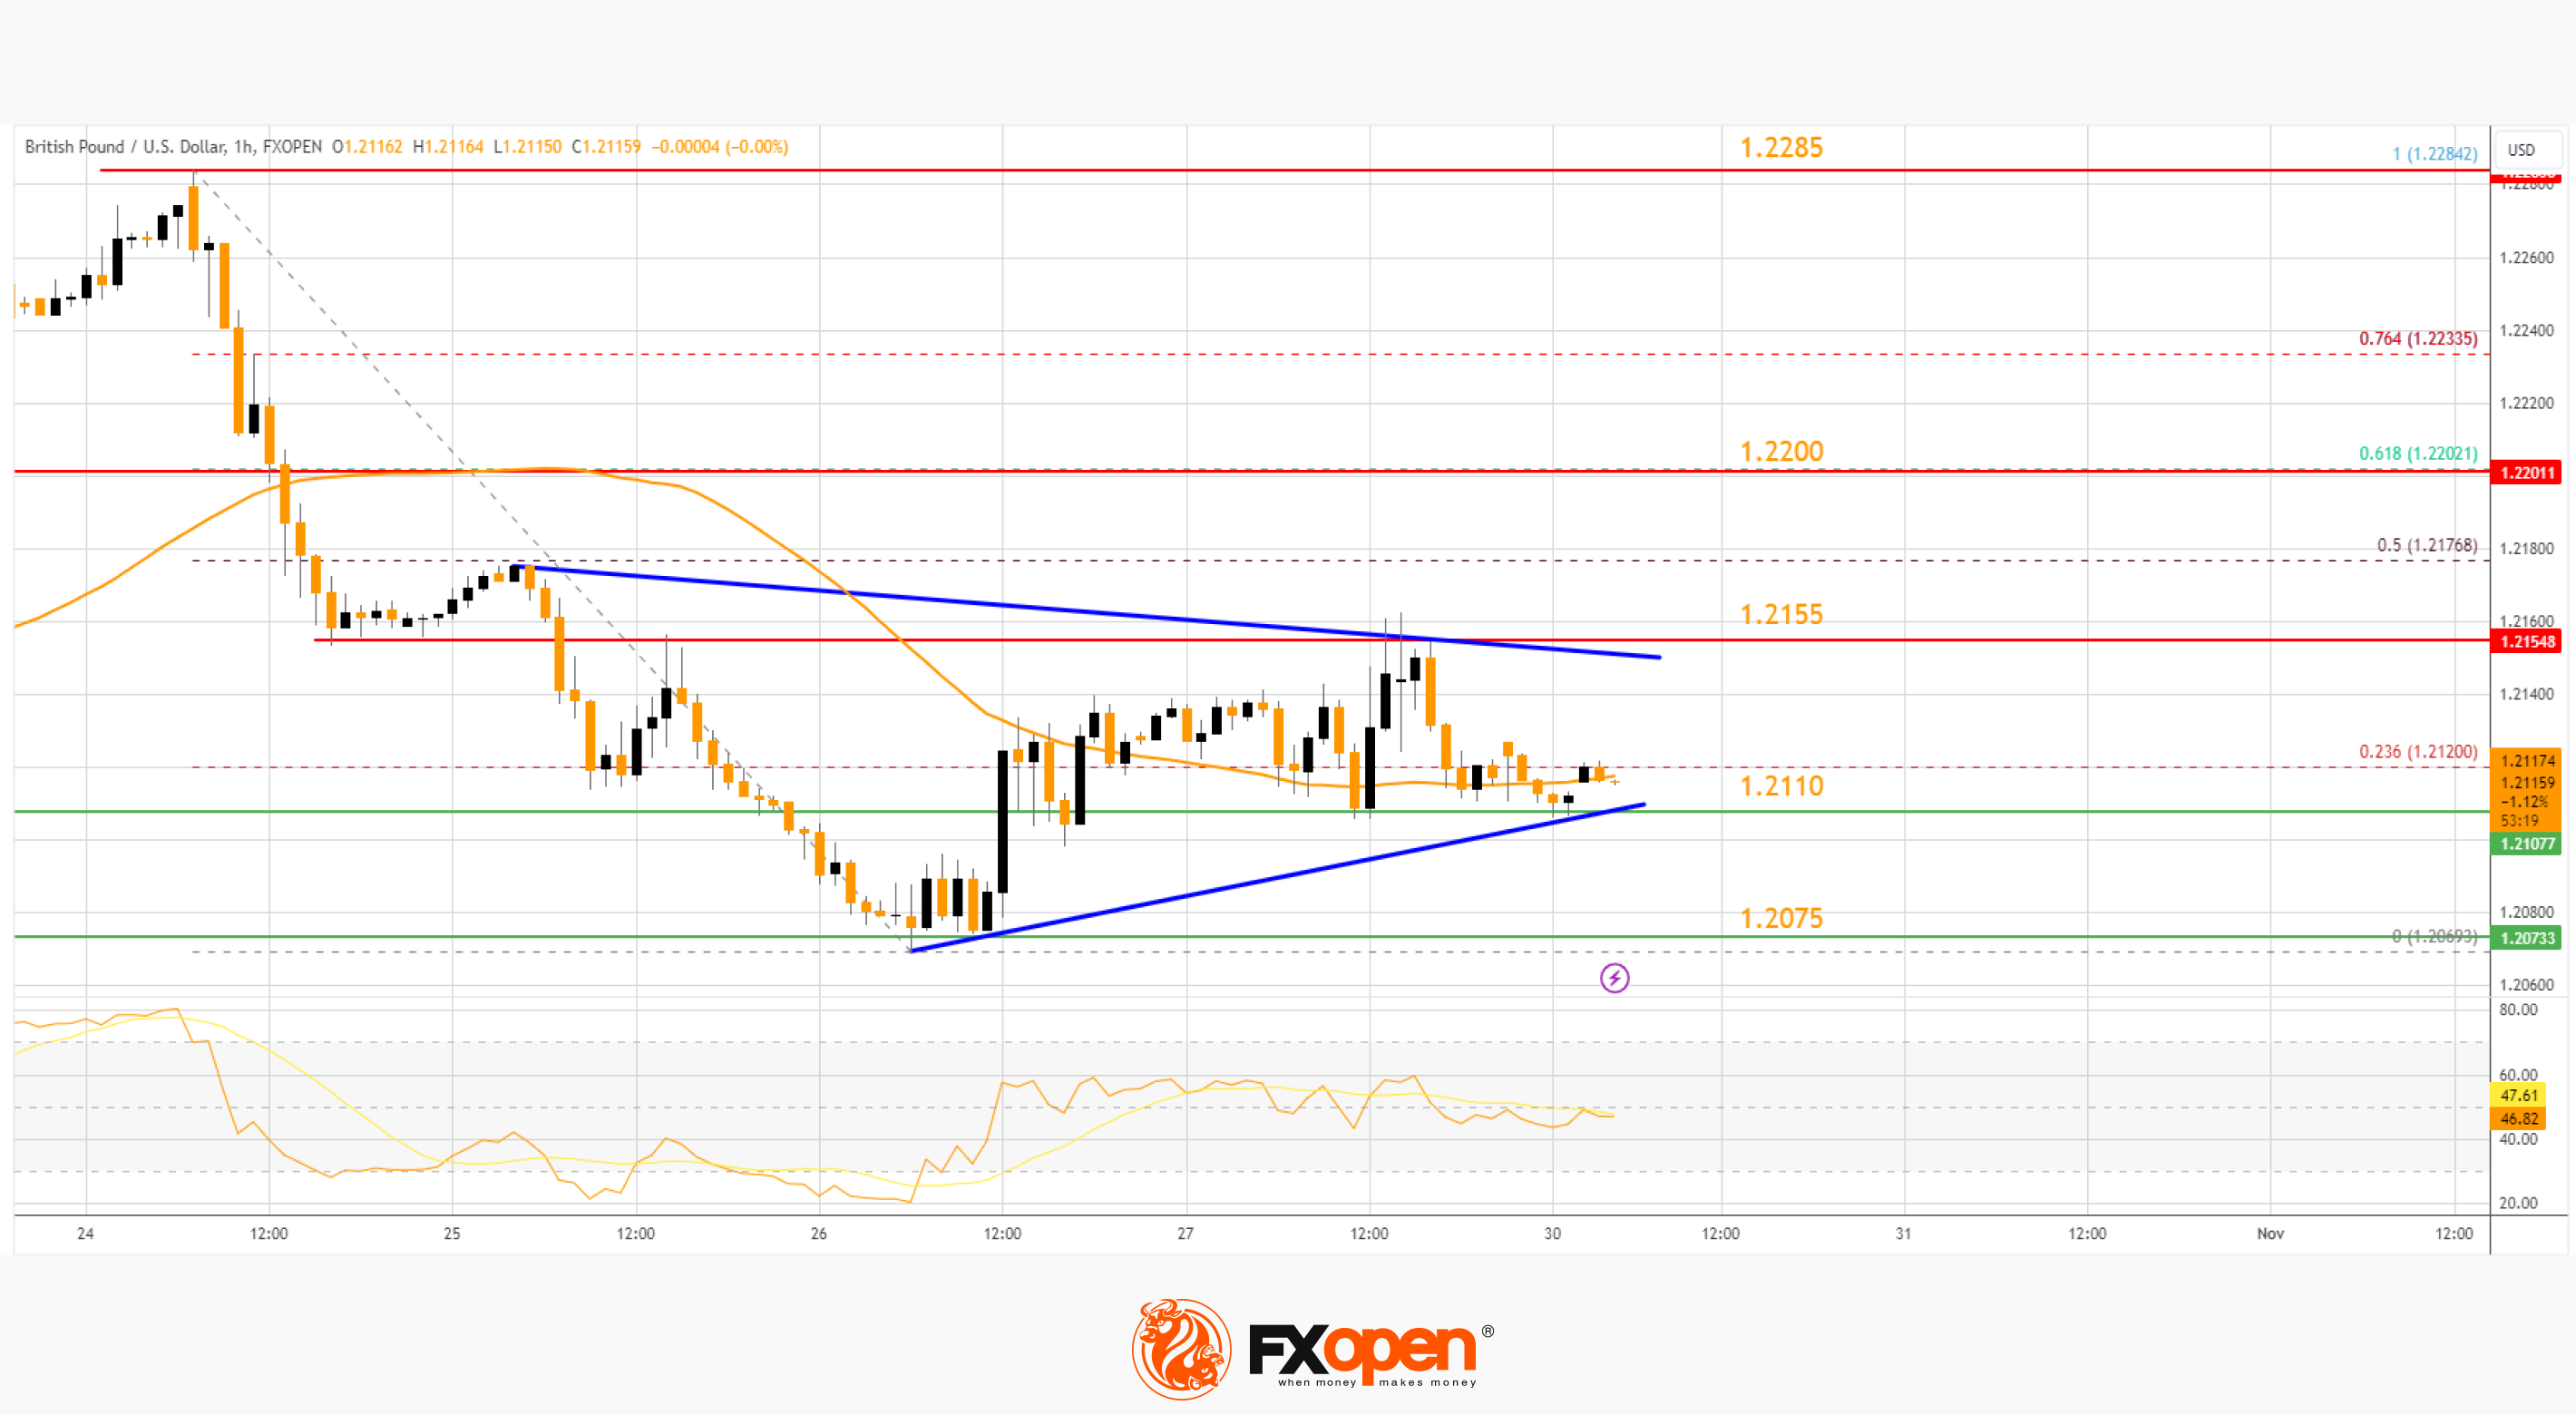
There was a minor move above the 50-hour simple moving average and the 23.6% Fib retracement level of the downward move from the 1.2284 swing high to the 1.2069 low.
On the upside, the GBP/USD chart indicates that the pair is facing resistance near a key contracting triangle at 1.2155. The next major resistance is near the 61.8% Fib retracement level of the downward move from the 1.2284 swing high to the 1.2069 low at 1.2200.
A close above the 1.2200 resistance zone could open the doors for a move toward 1.2285. Any more gains might send GBP/USD toward 1.2350.
On the downside, there is a key support forming near 1.2110. If there is a downside break below the 1.2110 support, the pair could accelerate lower. The next major support is near the 1.2075 zone, below which the pair could test 1.2020. Any more losses could lead the pair toward the 1.2000 support.
EUR/GBP Technical Analysis
On the hourly chart of EUR/GBP at FXOpen, the pair started a decent increase from the 0.8680 zone. The Euro traded above the 0.8700 pivot level to enter a positive zone against the British Pound.
The pair settled above the 50-hour simple moving average and the 50% Fib retracement level of the downward move from the 0.8734 swing high to the 0.8691 low. The EUR/GBP chart suggests that the pair is facing resistance near the 0.8720 zone.
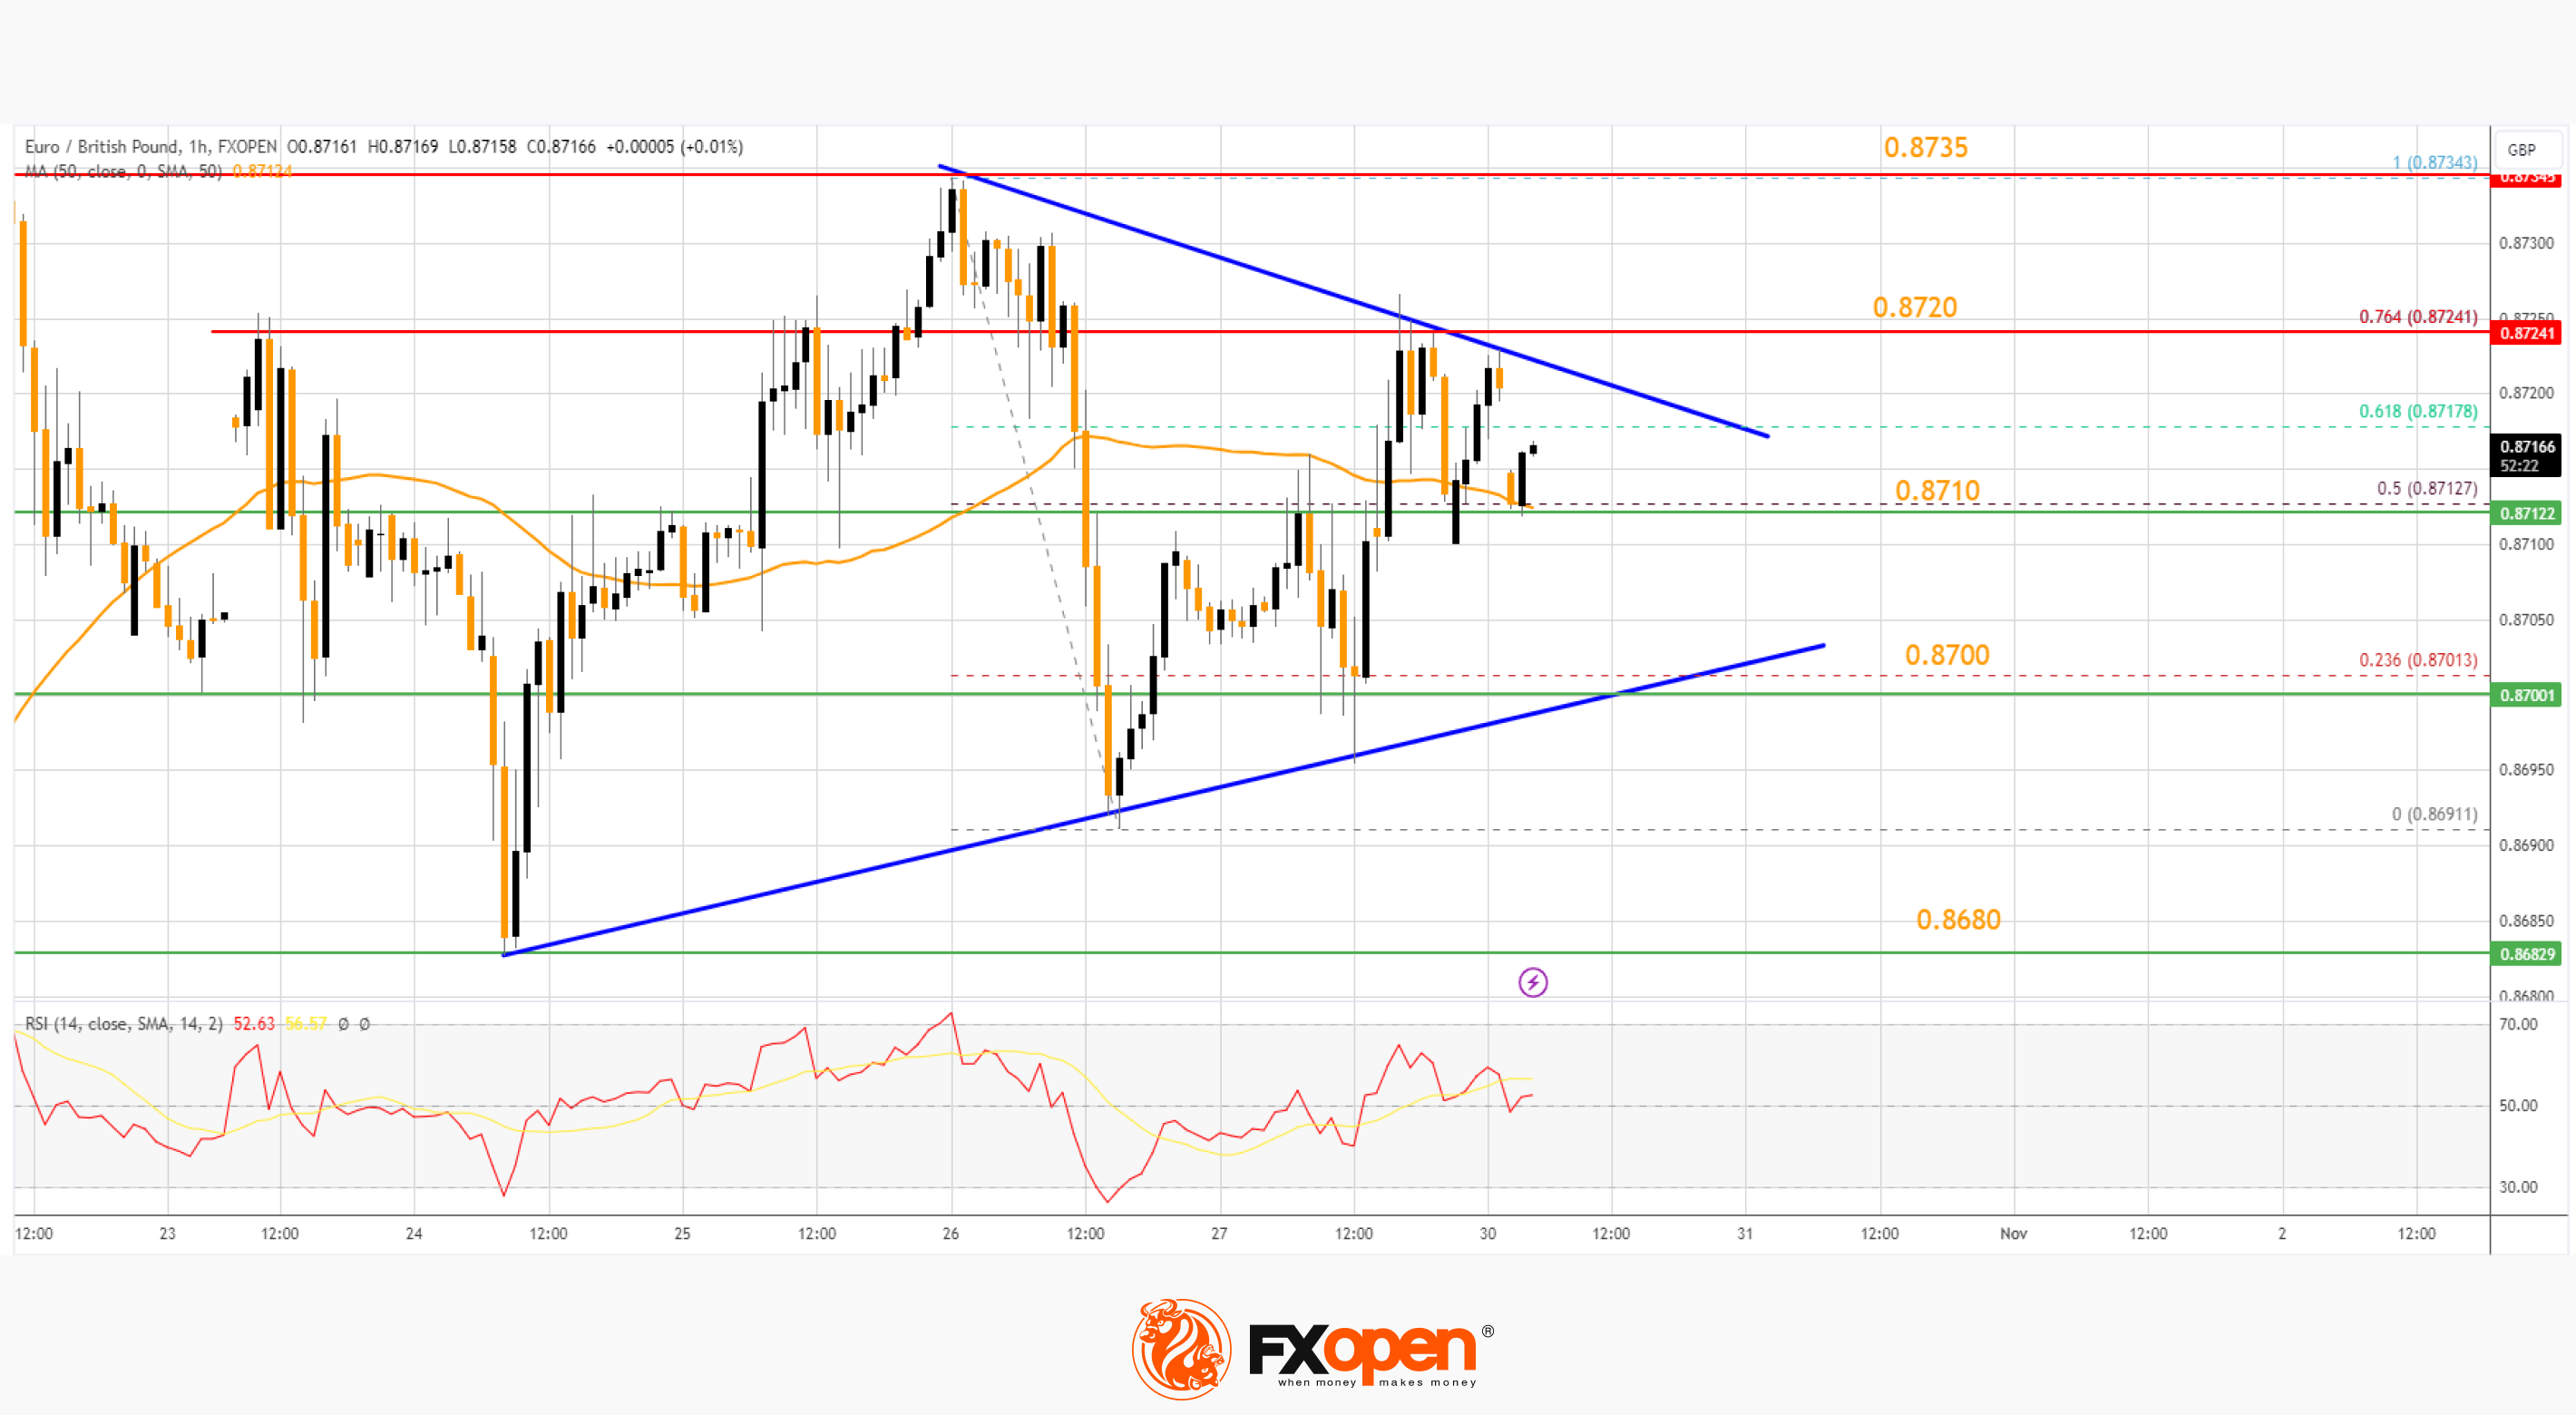
There is also a major contracting triangle forming with resistance near 0.8720. It is close to the 76.4% Fib retracement level of the downward move from the 0.8734 swing high to the 0.8691 low.
A close above the 0.8720 level might accelerate gains. In the stated case, the bulls may perhaps aim for a test of 0.8750. Any more gains might send the pair toward the 0.8785 level. If not, there might be a downside correction.
Immediate support sits near the 50-hour simple moving average at 0.8710. The next major support is at 0.8700. A downside break below the 0.8700 support might call for more downsides.
In the stated case, the pair could drop toward the 0.8680 support level. Any more losses might call for an extended drop toward the 0.8650 pivot zone.
Trade over 50 forex markets 24 hours a day with FXOpen. Take advantage of low commissions, deep liquidity, and spreads from 0.0 pips (additional fees may apply). Open your FXOpen account now or learn more about trading forex with FXOpen.
This article represents the opinion of the Companies operating under the FXOpen brand only. It is not to be construed as an offer, solicitation, or recommendation with respect to products and services provided by the Companies operating under the FXOpen brand, nor is it to be considered financial advice.
Stay ahead of the market!
Subscribe now to our mailing list and receive the latest market news and insights delivered directly to your inbox.


Latest articles

Dow Jones (DJIA): Consolidation Beyond the Trend
Federal Reserve Chair Kevin Warsh testified before Congress on 14–15 July, reaffirming the Fed's commitment to bringing inflation back to target while providing no clear guidance on the future path of interest rates. Meanwhile, June inflation data came in

European Currencies Strengthen Ahead of Key Macroeconomic Releases
EUR/USD and GBP/USD continue to recover moderately following the recent weakening of the US dollar. European currencies have been supported by expectations that US inflationary pressures will continue to ease after softer-than-expected CPI and PPI data, reinforcing market

Brent Crude Oil: From Ceasefire to Crossfire — What's Next?
Just weeks ago, traders were pricing in peace. Now they're pricing in war again—and that reversal says everything about how fragile the current Middle East calm really is.
Brent crude has surged to $86 a barrel, its highest level