


Market Analysis: GBP/USD Restarts Decrease, EUR/GBP Aims Higher
FXOpen

GBP/USD started a fresh decline from the 1.2335 resistance zone. EUR/GBP is rising and might climb above the 0.8665 resistance.
Important Takeaways for GBP/USD and EUR/GBP Analysis Today
· The British Pound is again declining and trading below the 1.2200 support.
· There was a break below a key bullish trend line with support near 1.2220 on the hourly chart of GBP/USD at FXOpen.
· EUR/GBP is rising and trading above the 0.8650 zone.
· There was a break above a major bearish trend line with resistance near 0.8635 on the hourly chart at FXOpen.
GBP/USD Technical Analysis
On the hourly chart of GBP/USD at FXOpen, the pair attempted a fresh increase above 1.2200. However, the British Pound failed above 1.2320 and started a fresh decline against the US Dollar.
There was a clear move below 1.2250 and the 50-hour simple moving average. The bears pushed the pair below a key bullish trend line with support near 1.2220. It opened the doors for a move toward the 1.2120 level.
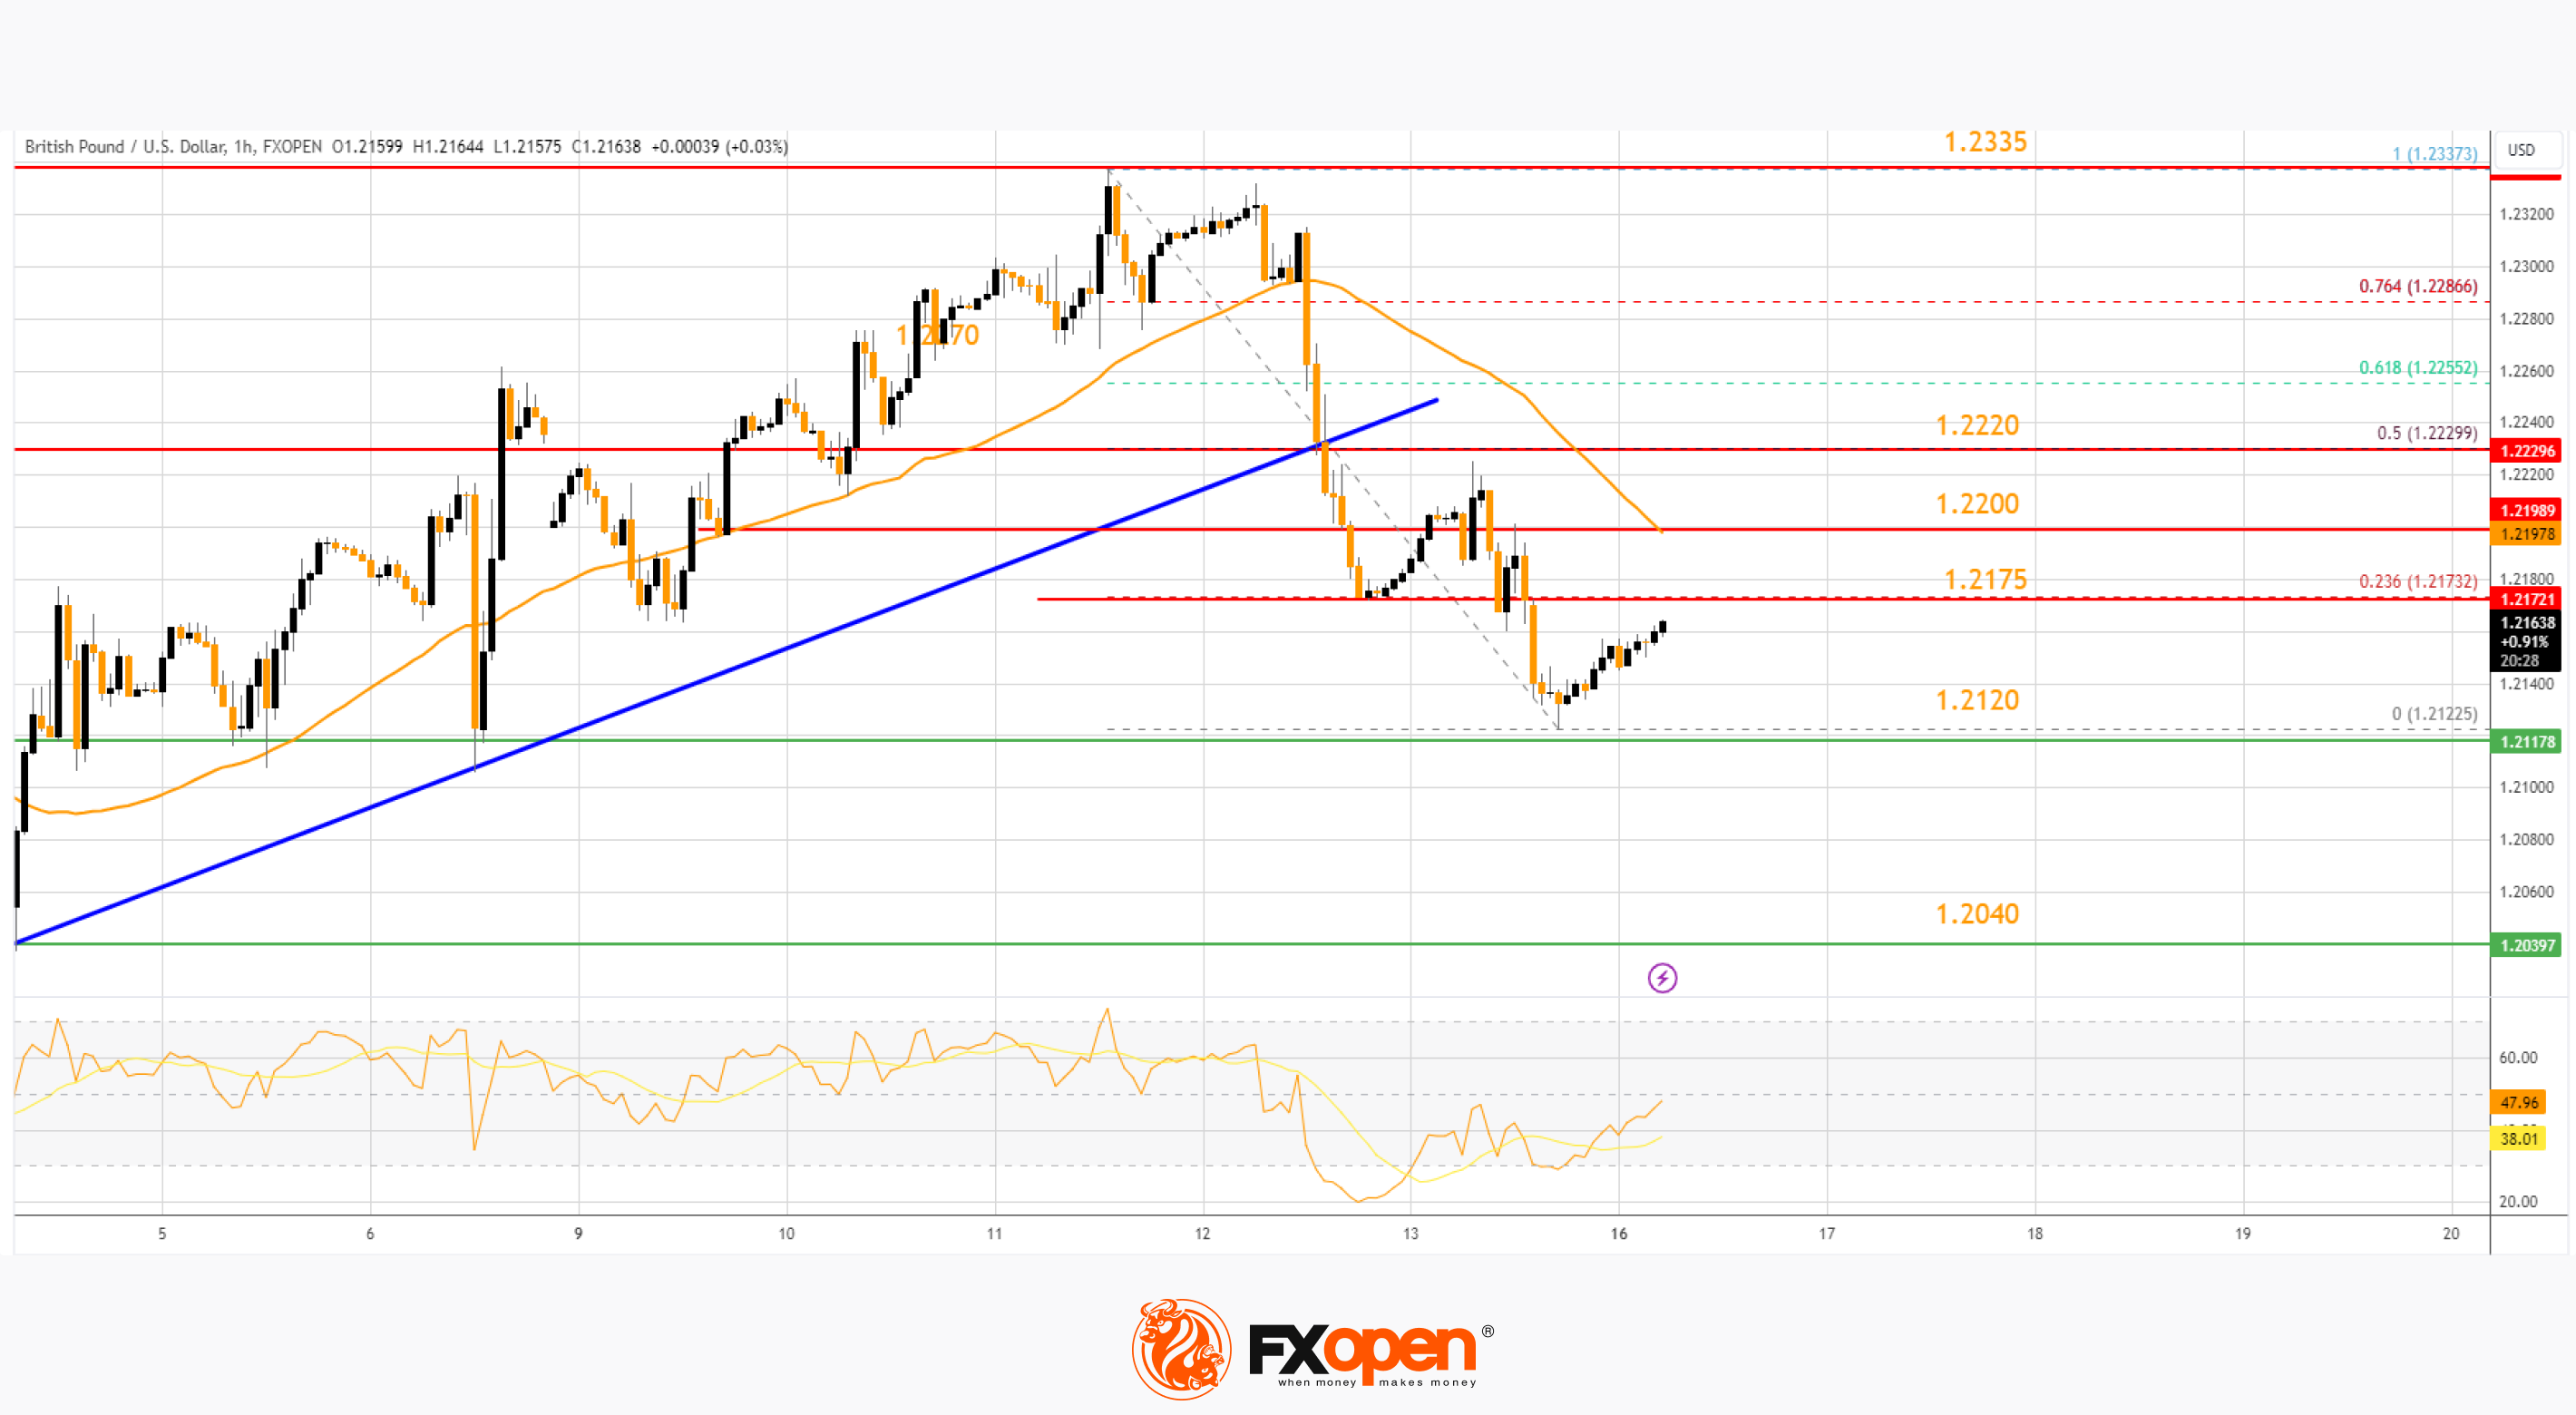
A low is formed near 1.2122 and the pair is now consolidating losses. On the upside, the GBP/USD chart indicates that the pair is facing resistance near the 23.6% Fib retracement level of the downward move from the 1.2337 swing high to the 1.2122 low at 1.2175.
The next major resistance is near the 50-hour simple moving average at 1.2200. The main resistance could be the 50% Fib retracement level of the downward move from the 1.2337 swing high to the 1.2122 low at 1.2220.
A close above the 1.2220 resistance zone could open the doors for a move toward 1.2335. Any more gains might send GBP/USD toward 1.2450.
On the downside, there is a key support forming near 1.2120. If there is a downside break below the 1.2120 support, the pair could accelerate lower. The next major support is near the 1.2040 zone, below which the pair could test 1.2020. Any more losses could lead the pair toward the 1.2000 support.
EUR/GBP Technical Analysis
On the hourly chart of EUR/GBP at FXOpen, the pair started a steady increase from the 0.8620 zone. The Euro traded above the 0.8635 pivot level to enter a positive zone against the British Pound.
Besides, there was a break above a major bearish trend line with resistance near 0.8635. The EUR/GBP chart suggests that the pair settled above the 50-hour simple moving average and 0.8650. Finally, it faced sellers near 0.8665.
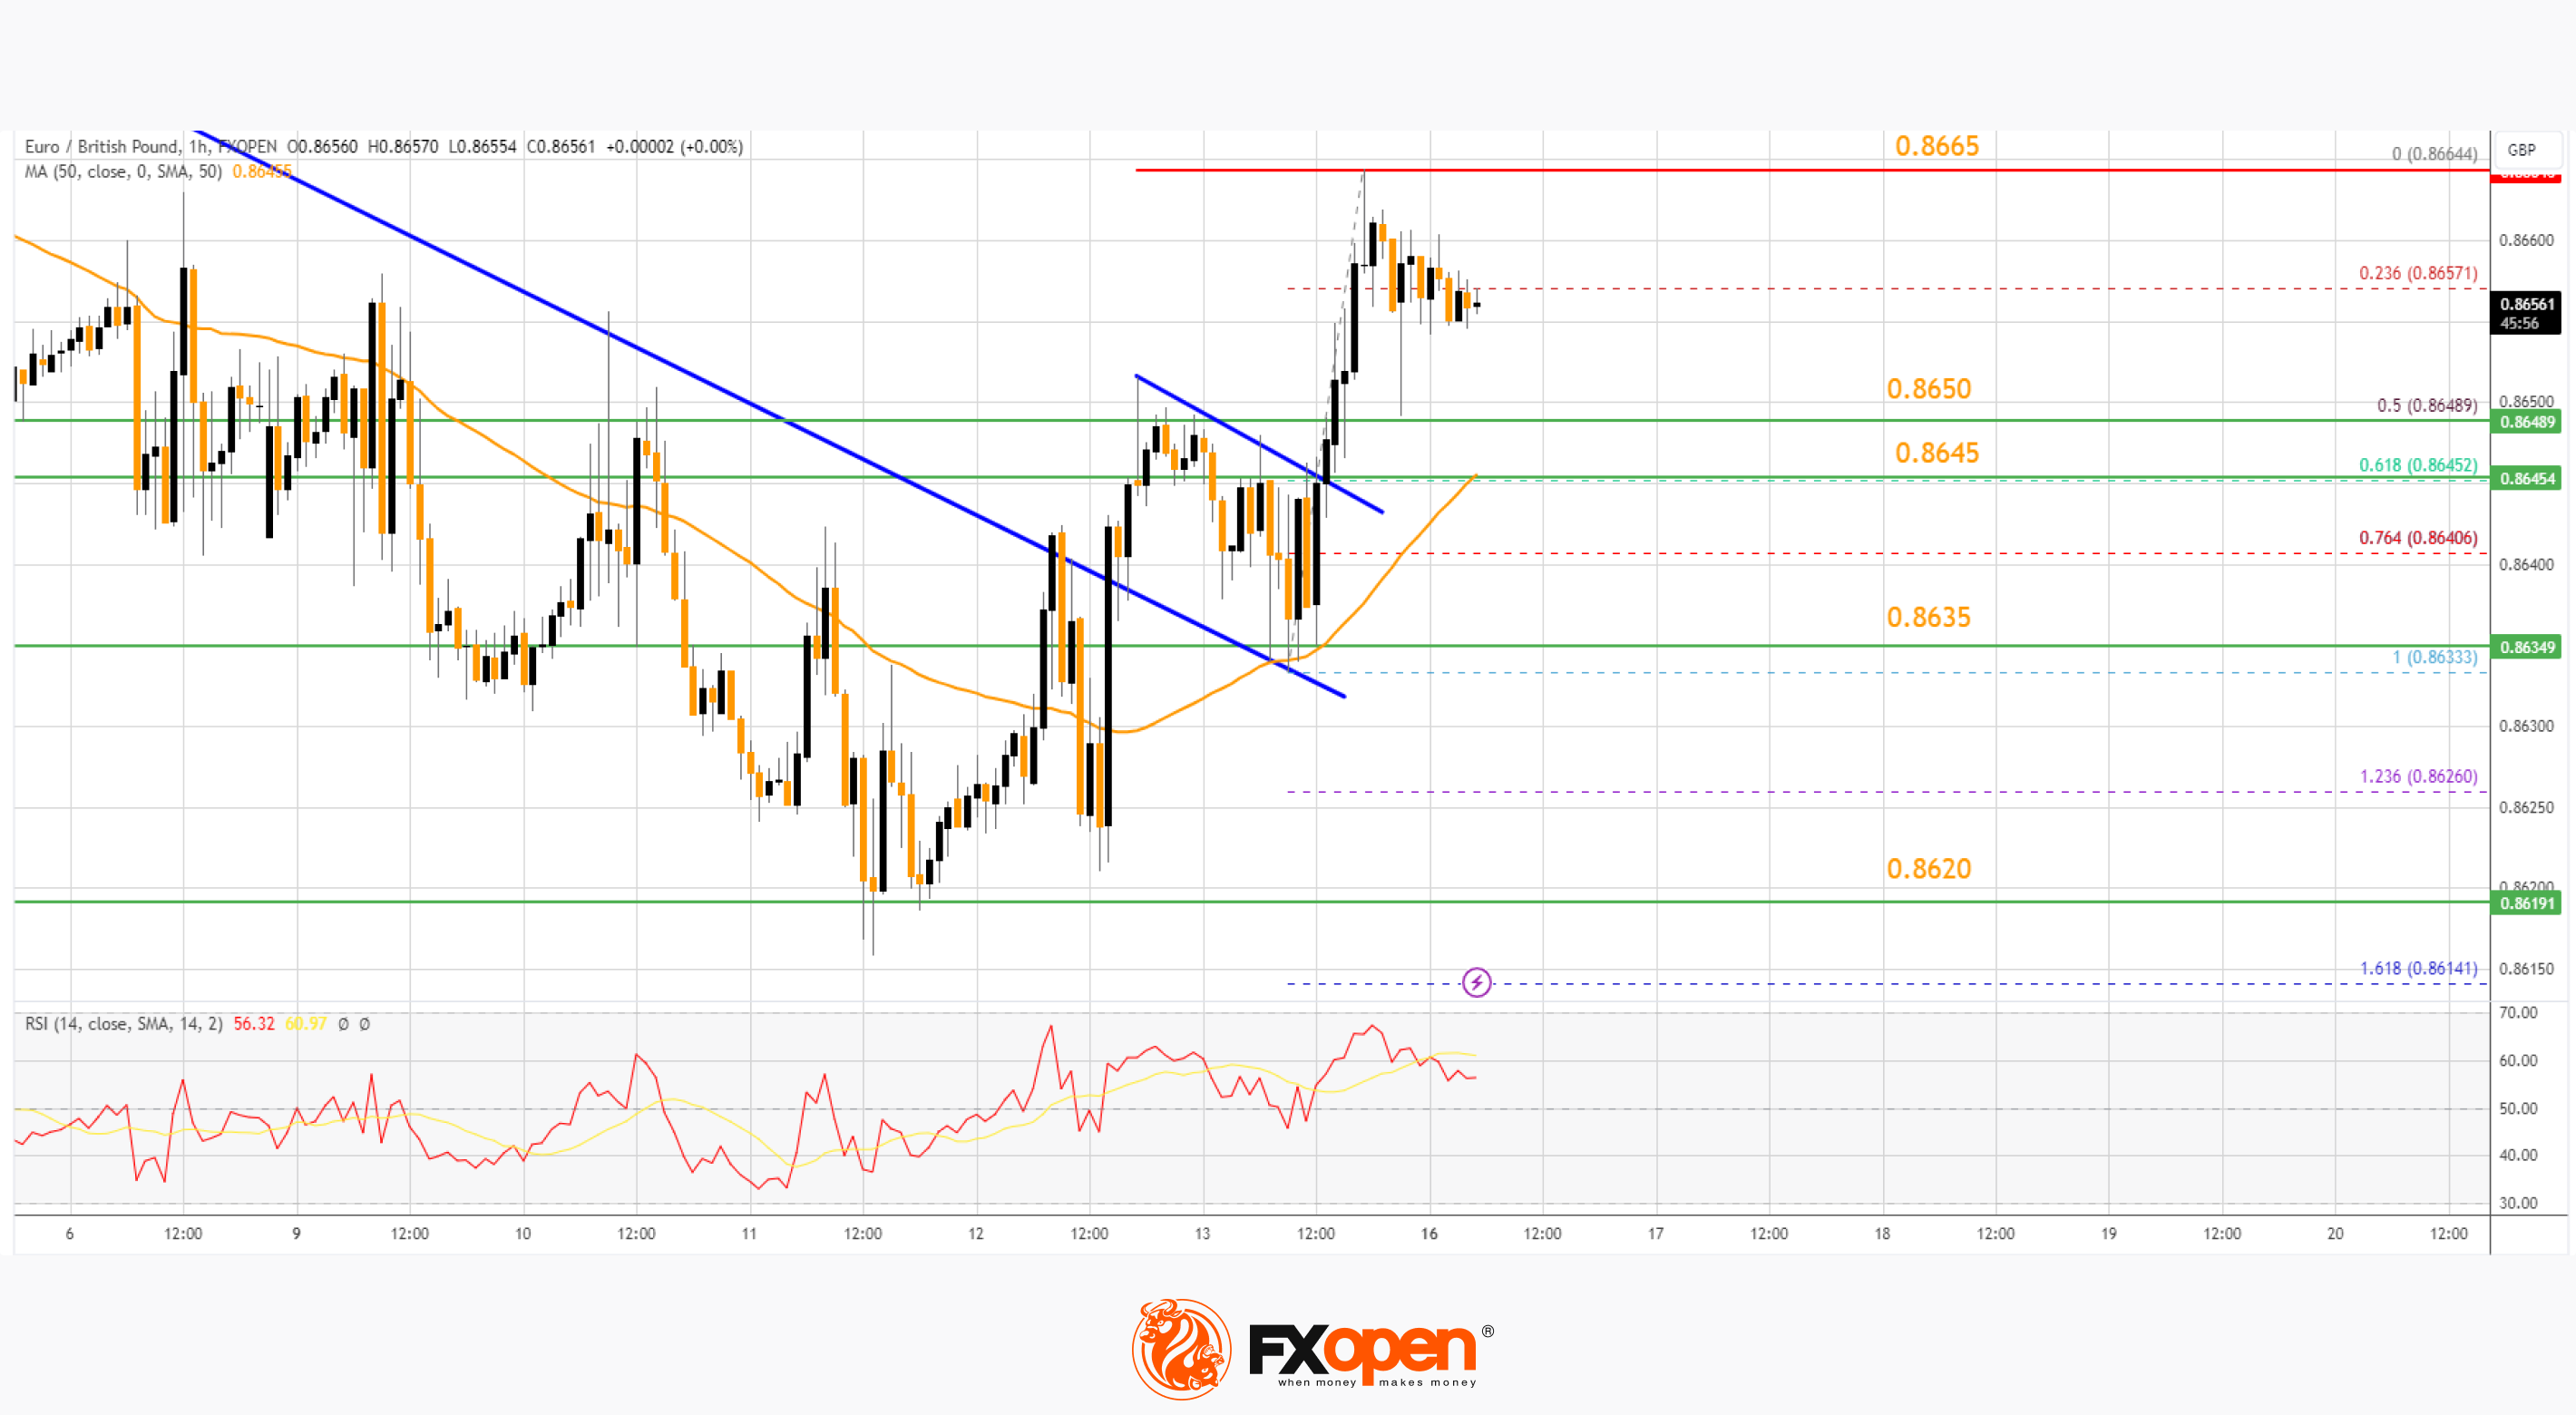
It is now correcting gains and trading below the 23.6% Fib retracement level of the recent increase from the 0.8633 swing low to the 0.8664 high.
Immediate support sits near the 50% Fib retracement level of the recent increase from the 0.8633 swing low to the 0.8664 high at 0.8650. The next major support is near the 50-hour simple moving average at 0.8645.
The main support is 0.8635. A downside break below the 0.8635 support might call for more downsides. In the stated case, the pair could drop toward the 0.8620 support level.
Immediate resistance is near the recent high at 0.8665. The next major resistance could be 0.8680. A close above the 0.8680 level might accelerate gains. In the stated case, the bulls may perhaps aim for a test of 0.8720. Any more gains might send the pair toward the 0.8780 level.
Trade over 50 forex markets 24 hours a day with FXOpen. Take advantage of low commissions, deep liquidity, and spreads from 0.0 pips (additional fees may apply). Open your FXOpen account now or learn more about trading forex with FXOpen.
This article represents the opinion of the Companies operating under the FXOpen brand only. It is not to be construed as an offer, solicitation, or recommendation with respect to products and services provided by the Companies operating under the FXOpen brand, nor is it to be considered financial advice.
Stay ahead of the market!
Subscribe now to our mailing list and receive the latest market news and insights delivered directly to your inbox.


Latest articles

US Dollar Index: A Defining Week for the King of the Markets
The dollar heads into a pivotal week trading near 101.80, just off a 15-month high, with the Fed's July 29 meeting standing as the clear focal point. Markets currently price roughly a 65% chance of a hold, though renewed

NZD/USD: Inflation Surge Meets Strong US Dollar Pressure
On 21 July, Stats NZ reported an acceleration in inflation: the Consumer Price Index rose 1.5% in the second quarter, while the annual inflation rate climbed to 4.1%, its highest level in more than two years and slightly

Weekly Market Insights with Gary Thomson: The Week of Central Banks and Earnings
In this video, we’ll explore the key economic events and market trends, shaping the financial landscape. Get ready for insights into financial markets to help you navigate the week ahead. Let’s dive in!
In this episode of Market